Wind
The routines in this module can be used to load data from the Wind mission.
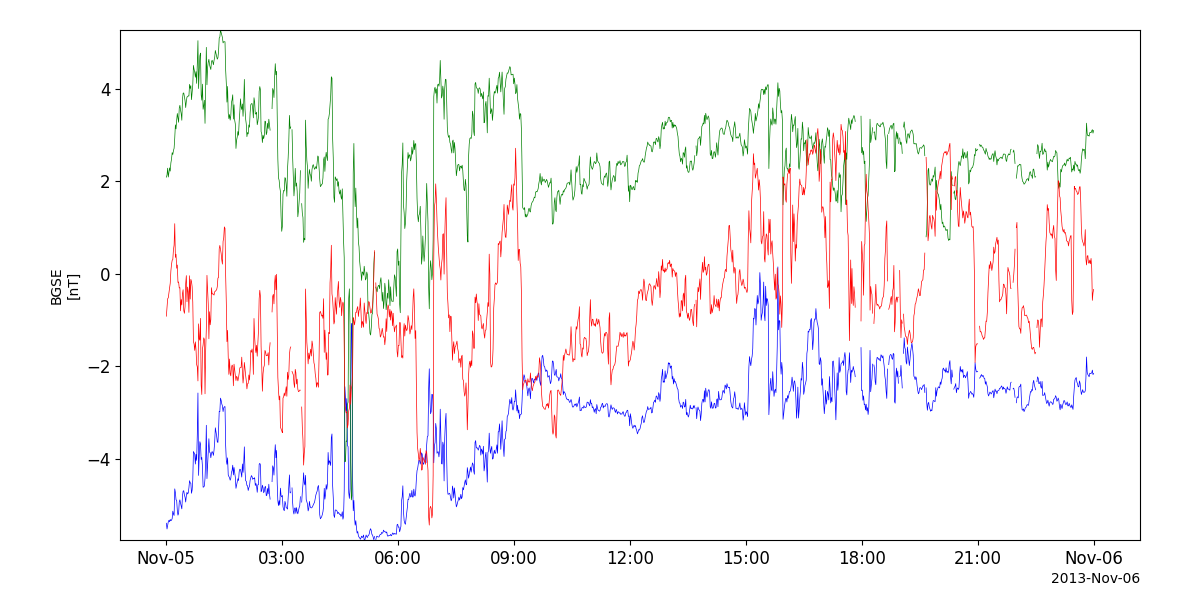
Magnetic Field Investigation (MFI)
- pyspedas.projects.wind.mfi(trange=['2018-11-5', '2018-11-6'], datatype='h0', prefix='', suffix='', get_support_data=False, varformat=None, varnames=[], downloadonly=False, force_download=False, notplot=False, no_update=False, time_clip=False, addmaster=True)[source]
Load data from the WIND Fluxgate Magnetometer
- Parameters:
trange (
listofstr) – time range of interest [starttime, endtime] with the format ‘YYYY-MM-DD’,’YYYY-MM-DD’] or to specify more or less than a day [‘YYYY-MM-DD/hh:mm:ss’,’YYYY-MM-DD/hh:mm:ss’] Default: [‘2018-11-5’, ‘2018-11-6’]datatype (
str) – Data type; Valid options: ‘h0’, ‘h1’, ‘h2’, ‘h3-rtn’, ‘h4-rtn’, ‘k0’ Default: ‘h0’prefix (
str) – The tplot variable names will be given this prefix. Default: ‘’suffix (
str) – The tplot variable names will be given this suffix. Default: ‘’get_support_data (
bool) – Data with an attribute “VAR_TYPE” with a value of “support_data” will be loaded into tplot. Default: Falsevarformat (
str) – The file variable formats to load into tplot. Wildcard character “*” is accepted. Default: None (all variables will be loaded)varnames (
listofstr) – List of variable names to load (if empty list or not specified, all data variables are loaded) Default: [] (all variables will be loaded)downloadonly (
bool) – Set this flag to download the CDF files, but not load them into tplot variables Default: Falseforce_download (
bool) – Set this flag to download the CDF files, even if the local copy is newer. Default: Falsenotplot (
bool) – Return the data in hash tables instead of creating tplot variables Default: Falseno_update (
bool) – If set, only load data from your local cache Default: Falsetime_clip (
bool) – Time clip the variables to exactly the range specified in the trange keyword Default: Falseaddmaster (
bool) – If True, use the metadata from a master CDF at SPDF rather than the metadata in the data file Default: True
- Return type:
Listoftplot variables created.
Examples
>>> import pyspedas
>>> from pyspedas import tplot
>>> vars = pyspedas.projects.wind.mfi(trange=['2018-11-5', '2018-11-6'],datatype='h0')
>>> tplot(vars)
Example
import pyspedas
from pyspedas import tplot
mfi_vars = pyspedas.projects.wind.mfi(trange=['2013-11-5', '2013-11-6'])
tplot('BGSE')
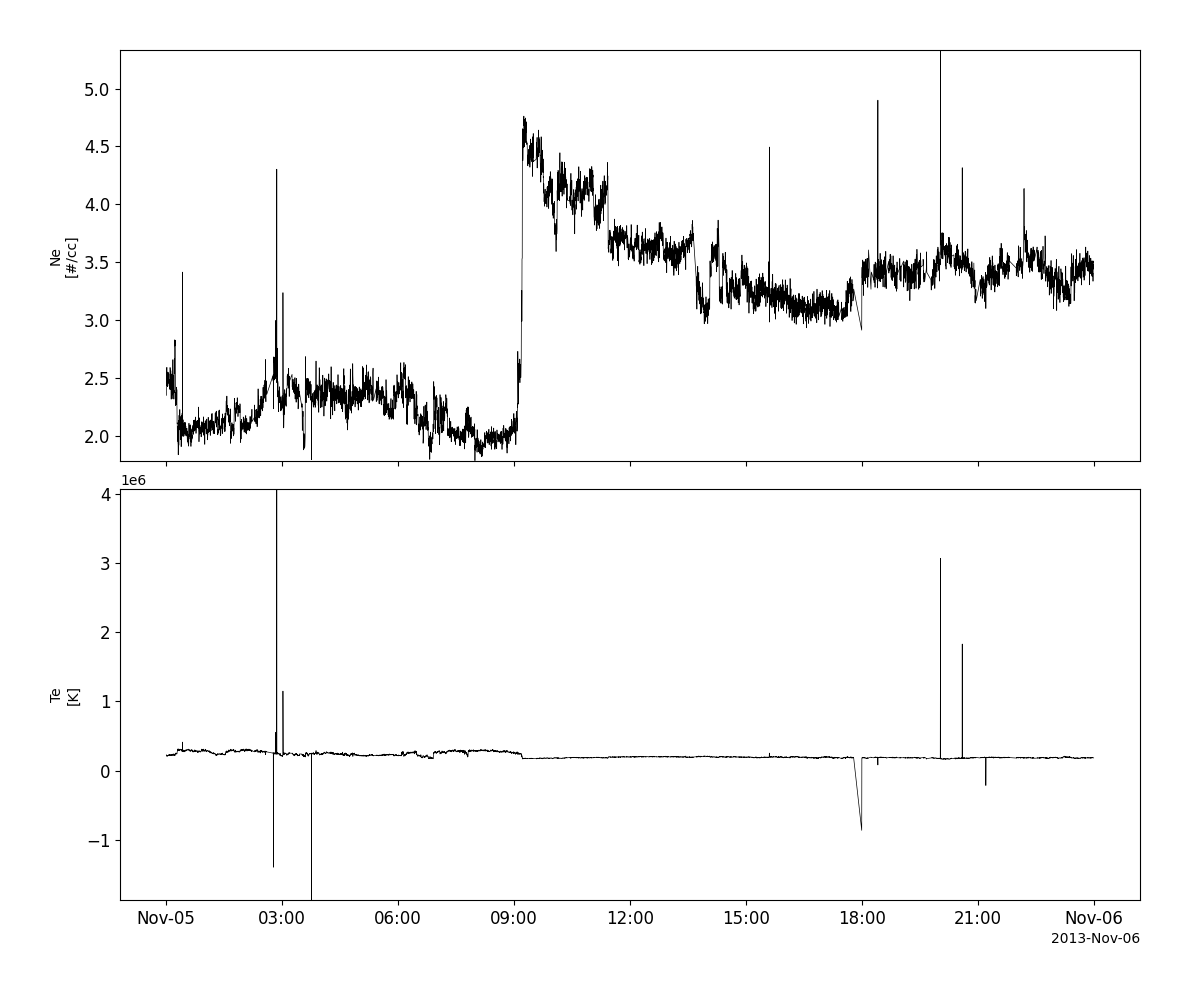
Solar Wind Experiment (SWE)
- pyspedas.projects.wind.swe(trange=['2018-11-5', '2018-11-6'], datatype='h5', prefix='', suffix='', get_support_data=False, varformat=None, varnames=[], downloadonly=False, force_download=False, notplot=False, no_update=False, time_clip=False, addmaster=True)[source]
Load data from the WIND SWE instrument
- Parameters:
trange (
listofstr) – time range of interest [starttime, endtime] with the format ‘YYYY-MM-DD’,’YYYY-MM-DD’] or to specify more or less than a day [‘YYYY-MM-DD/hh:mm:ss’,’YYYY-MM-DD/hh:mm:ss’] Default: [‘2018-11-5’, ‘2018-11-6’]datatype (
str) – Data type; Valid options: ‘h0’, ‘h1’, ‘h3’, ‘h4’, ‘h5’, ‘k0’, ‘m0’, ‘m2’ Default: ‘h5’prefix (
str) – The tplot variable names will be given this prefix. Default: ‘’suffix (
str) – The tplot variable names will be given this suffix. Default: ‘’get_support_data (
bool) – Data with an attribute “VAR_TYPE” with a value of “support_data” will be loaded into tplot. Default: Falsevarformat (
str) – The file variable formats to load into tplot. Wildcard character “*” is accepted. Default: None (all variables will be loaded)varnames (
listofstr) – List of variable names to load (if empty list or not specified, all data variables are loaded) Default: [] (all variables will be loaded)downloadonly (
bool) – Set this flag to download the CDF files, but not load them into tplot variables Default: Falseforce_download (
bool) – Set this flag to download the CDF files, even if the local copy is newer. Default: Falsenotplot (
bool) – Return the data in hash tables instead of creating tplot variables Default: Falseno_update (
bool) – If set, only load data from your local cache Default: Falsetime_clip (
bool) – Time clip the variables to exactly the range specified in the trange keyword Default: Falseaddmaster (
bool) – If True, use the metadata from a master CDF at SPDF rather than the metadata in the data file Default: True
- Return type:
Listoftplot variables created.
Examples
>>> import pyspedas
>>> from pyspedas import tplot
>>> vars = pyspedas.projects.wind.swe(trange=['2018-11-5', '2018-11-6'],datatype='h5')
>>> tplot(vars)
Example
import pyspedas
from pyspedas import tplot
swe_vars = pyspedas.projects.wind.swe(trange=['2013-11-5', '2013-11-6'])
tplot(['N_elec', 'T_elec'])
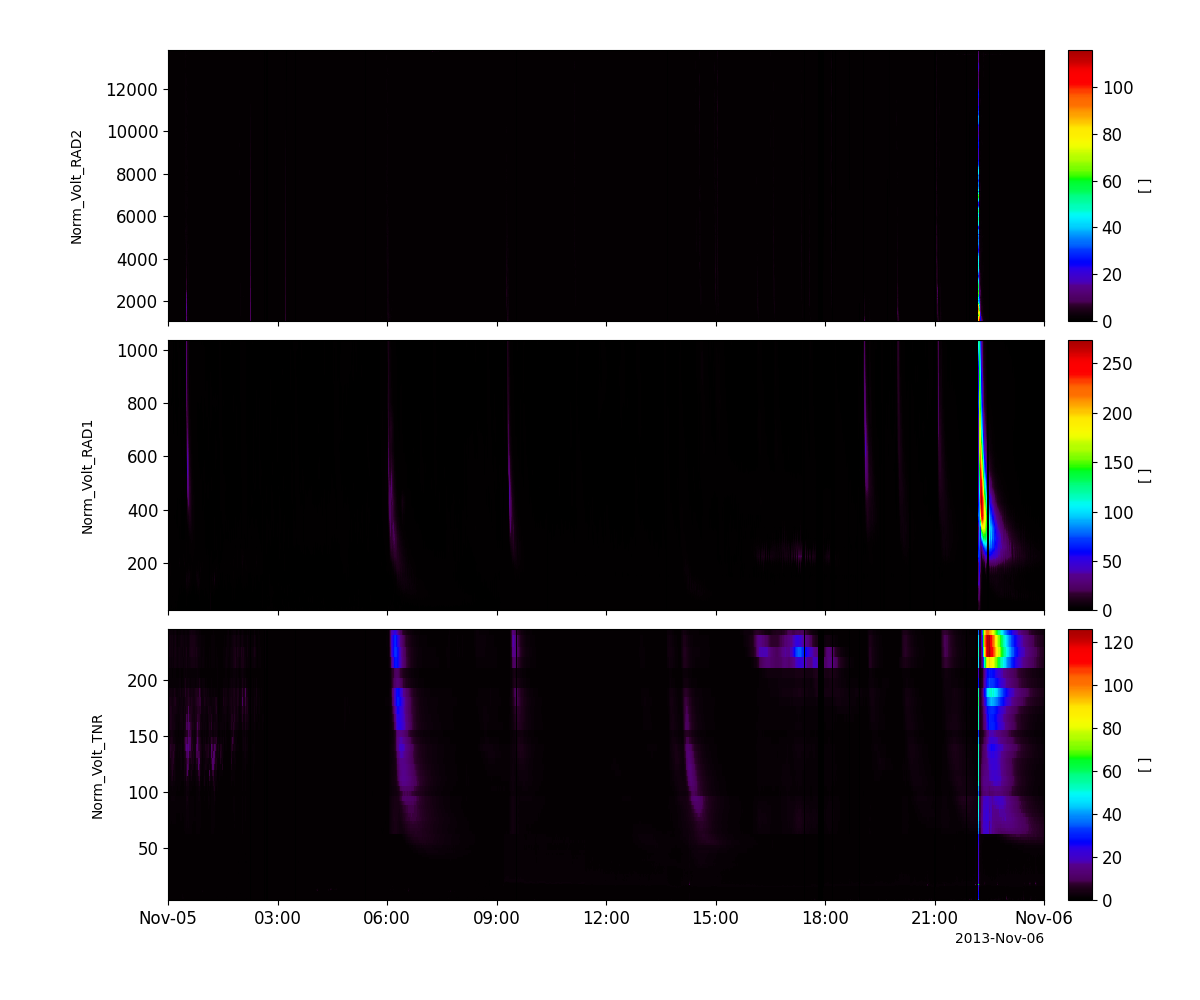
Radio and Plasma Waves (WAVES)
- pyspedas.projects.wind.waves(trange=['2018-11-5', '2018-11-6'], datatype='h1', prefix='', suffix='', get_support_data=False, varformat=None, varnames=[], downloadonly=False, force_download=False, notplot=False, no_update=False, time_clip=False, addmaster=True)[source]
Load WIND Radio/Plasma Wave (WAVES) data
- Parameters:
trange (
listofstr) – time range of interest [starttime, endtime] with the format ‘YYYY-MM-DD’,’YYYY-MM-DD’] or to specify more or less than a day [‘YYYY-MM-DD/hh:mm:ss’,’YYYY-MM-DD/hh:mm:ss’] Default: [‘2018-11-5’,’2018-11-6’]datatype (
str) – Data type; Valid options: ‘h0’, ‘h1’, ‘k0’, ‘tds’, ‘rad1’, ‘rad2’, ‘tnr’ Default: ‘h1’prefix (
str) – The tplot variable names will be given this prefix. Default: ‘’suffix (
str) – The tplot variable names will be given this suffix. Default: ‘’get_support_data (
bool) – Data with an attribute “VAR_TYPE” with a value of “support_data” will be loaded into tplot. Default: Falsevarformat (
str) – The file variable formats to load into tplot. Wildcard character “*” is accepted. Default: None (all variables will be loaded)varnames (
listofstr) – List of variable names to load (if empty list or not specified, all data variables are loaded) Default: [] (all variables will be loaded)downloadonly (
bool) – Set this flag to download the CDF files, but not load them into tplot variables Default: Falseforce_download (
bool) – Set this flag to download the CDF files, even if the local copy is newer. Default: Falsenotplot (
bool) – Return the data in hash tables instead of creating tplot variables Default: Falseno_update (
bool) – If set, only load data from your local cache Default: Falsetime_clip (
bool) – Time clip the variables to exactly the range specified in the trange keyword Default: Falseaddmaster (
bool) – If True, use the metadata from a master CDF at SPDF rather than the metadata in the data file Default: True
- Return type:
Listoftplot variables created.
Examples
>>> import pyspedas
>>> from pyspedas import tplot
>>> vars = pyspedas.projects.wind.waves(trange=['2018-11-5', '2018-11-6'],datatype='h1')
>>> tplot(vars)
Example
import pyspedas
from pyspedas import tplot
waves_vars = pyspedas.projects.wind.waves(trange=['2013-11-5', '2013-11-6'])
tplot(['E_VOLTAGE_RAD2', 'E_VOLTAGE_RAD1', 'E_VOLTAGE_TNR'])
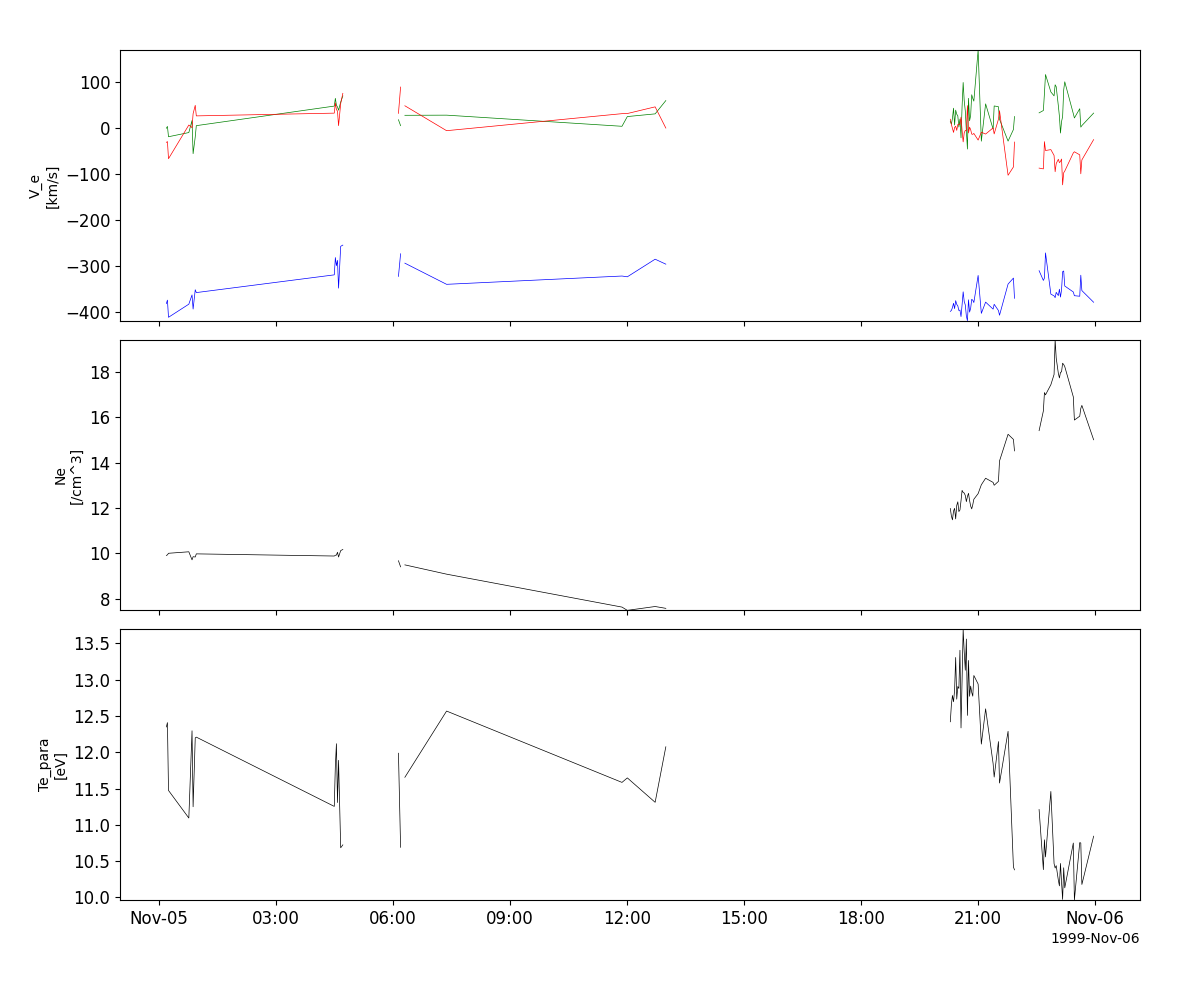
3D Plasma Analyzer (3DP)
- pyspedas.projects.wind.threedp(trange=['1999-11-5', '1999-11-6'], datatype='3dp_emfits_e0', prefix='', suffix='', get_support_data=False, varformat=None, varnames=[], downloadonly=False, force_download=False, notplot=False, no_update=False, berkeley=False, time_clip=False, addmaster=True)[source]
Load WIND 3DP data
- Parameters:
trange (
listofstr) – time range of interest [starttime, endtime] with the format ‘YYYY-MM-DD’,’YYYY-MM-DD’] or to specify more or less than a day [‘YYYY-MM-DD/hh:mm:ss’,’YYYY-MM-DD/hh:mm:ss’] Default: [‘1999-11-5’, ‘1999-11-6’]datatype (
str) – Data type; Valid options: ‘3dp_ehpd’, ‘3dp_ehsp’, ‘3dp_elm2’, ‘3dp_elpd’, ‘3dp_elsp’, ‘3dp_em’, ‘3dp_emfits_e0’, ‘3dp_k0’, ‘3dp_phsp’, ‘3dp_plsp’, ‘3dp_pm’, ‘3dp_sfpd’, ‘3dp_sfsp’, ‘3dp_sopd’, ‘3dp_sosp’ Default: ‘3dp_emfits_e0’prefix (
str) – The tplot variable names will be given this prefix. Default: ‘’suffix (
str) – The tplot variable names will be given this suffix. Default: ‘’get_support_data (
bool) – Data with an attribute “VAR_TYPE” with a value of “support_data” will be loaded into tplot. Default: Falsevarformat (
str) – The file variable formats to load into tplot. Wildcard character “*” is accepted. Default: None (all variables will be loaded)varnames (
listofstr) – List of variable names to load (if empty list or not specified, all data variables are loaded) Default: [] (all variables will be loaded)downloadonly (
bool) – Set this flag to download the CDF files, but not load them into tplot variables Default: Falseforce_download (
bool) – Set this flag to download the CDF files, even if the local copy is newer. Default: Falsenotplot (
bool) – Return the data in hash tables instead of creating tplot variables Default: Falseno_update (
bool) – If set, only load data from your local cache Default: Falsetime_clip (
bool) – Time clip the variables to exactly the range specified in the trange keyword Default: Falseaddmaster (
bool) – If True, use the metadata from a master CDF at SPDF rather than the metadata in the data file Default: True
- Returns:
List of tplot variables created.
- Return type:
Listofstr
Examples
>>> import pyspedas
>>> from pyspedas import tplot
>>> vars = pyspedas.projects.wind.threedp(trange=['1999-11-5', '1999-11-6'],datatype='3dp_emfits_e0')
>>> tplot(vars)
Example
import pyspedas
from pyspedas import tplot
threedp_vars = pyspedas.projects.wind.threedp()
tplot(['V_e_xyz_gse_wi_3dp', 'N_e_dens_wi_3dp', 'T_e_par_wi_3dp'])
Solar Wind and Suprathermal Ion Composition Experiment (SMS)
- pyspedas.projects.wind.sms(trange=['1999-11-5', '1999-11-6'], datatype='k0', prefix='', suffix='', get_support_data=False, varformat=None, varnames=[], downloadonly=False, force_download=False, notplot=False, no_update=False, time_clip=False, addmaster=True)[source]
Load data from the WIND Solar Wind and Suprathermal Ion Composition Instrument
- Parameters:
trange (
listofstr) – time range of interest [starttime, endtime] with the format ‘YYYY-MM-DD’,’YYYY-MM-DD’] or to specify more or less than a day [‘YYYY-MM-DD/hh:mm:ss’,’YYYY-MM-DD/hh:mm:ss’] Default: [‘1999-11-5’, ‘1999-11-6’]datatype (
str) – Data type; Valid options: ‘k0’,’l2’ Default: ‘k0’prefix (
str) – The tplot variable names will be given this prefix. Default: ‘’suffix (
str) – The tplot variable names will be given this suffix. Default: ‘’get_support_data (
bool) – Data with an attribute “VAR_TYPE” with a value of “support_data” will be loaded into tplot. Default: Falsevarformat (
str) – The file variable formats to load into tplot. Wildcard character “*” is accepted. Default: None (all variables will be loaded)varnames (
listofstr) – List of variable names to load (if empty list or not specified, all data variables are loaded) Default: [] (all variables will be loaded)downloadonly (
bool) – Set this flag to download the CDF files, but not load them into tplot variables Default: Falseforce_download (
bool) – Set this flag to download the CDF files, even if the local copy is newer. Default: Falsenotplot (
bool) – Return the data in hash tables instead of creating tplot variables Default: Falseno_update (
bool) – If set, only load data from your local cache Default: Falsetime_clip (
bool) – Time clip the variables to exactly the range specified in the trange keyword Default: Falseaddmaster (
bool) – If True, use the metadata from a master CDF at SPDF rather than the metadata in the data file Default: True
- Return type:
Listoftplot variables created.
Examples
>>> import pyspedas
>>> from pyspedas import tplot
>>> vars = pyspedas.projects.wind.sms(trange=['1999-11-5', '1999-11-6'],datatype='k0')
>>> tplot(vars)
Example
import pyspedas
from pyspedas import tplot
sms_vars = pyspedas.projects.wind.sms()
tplot(['C_ion_temp', 'O_ion_temp'])
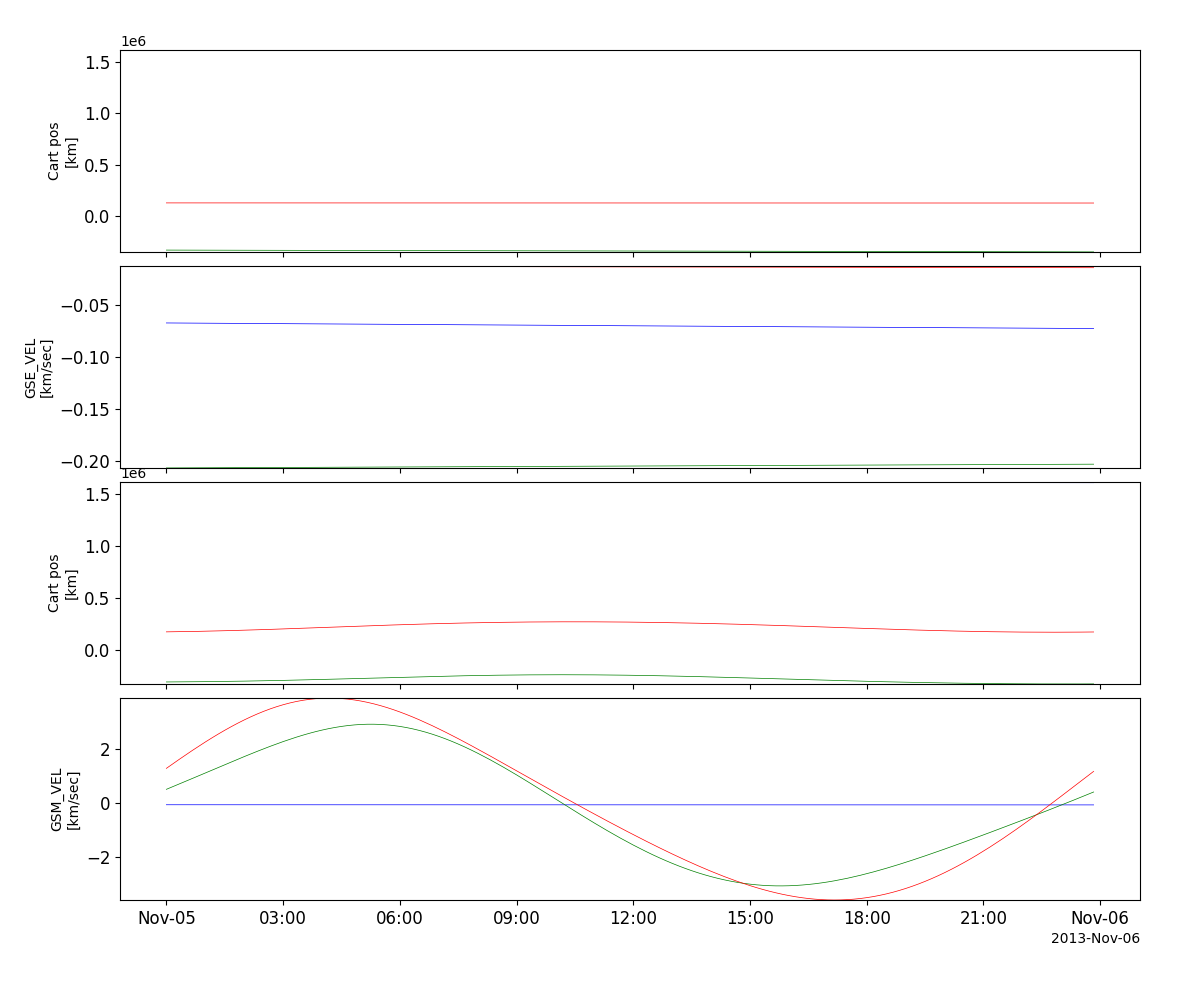
Orbit data
- pyspedas.projects.wind.orbit(trange=['1999-11-5', '1999-11-6'], datatype='pre_or', prefix='', suffix='', get_support_data=False, varformat=None, varnames=[], downloadonly=False, force_download=False, notplot=False, no_update=False, time_clip=False, addmaster=True)[source]
Load WIND orbit data
- Parameters:
trange (
listofstr) – time range of interest [starttime, endtime] with the format ‘YYYY-MM-DD’,’YYYY-MM-DD’] or to specify more or less than a day [‘YYYY-MM-DD/hh:mm:ss’,’YYYY-MM-DD/hh:mm:ss’] Default: [‘1999-11-5’, ‘1999-11-6’]datatype (
str) – Data type; Valid options: ‘def_at’, ‘def_or’, ‘pre_at’, ‘pre_or’, ‘spha_k0’ Default: ‘pre_or’prefix (
str) – The tplot variable names will be given this prefix. Default: ‘’suffix (
str) – The tplot variable names will be given this suffix. Default: ‘’get_support_data (
bool) – Data with an attribute “VAR_TYPE” with a value of “support_data” will be loaded into tplot. Default: Falsevarformat (
str) – The file variable formats to load into tplot. Wildcard character “*” is accepted. Default: None (all variables will be loaded)varnames (
listofstr) – List of variable names to load (if empty list or not specified, all data variables are loaded) Default: [] (all variables will be loaded)downloadonly (
bool) – Set this flag to download the CDF files, but not load them into tplot variables Default: Falseforce_download (
bool) – Set this flag to download the CDF files, even if the local copy is newer. Default: Falsenotplot (
bool) – Return the data in hash tables instead of creating tplot variables Default: Falseno_update (
bool) – If set, only load data from your local cache Default: Falsetime_clip (
bool) – Time clip the variables to exactly the range specified in the trange keyword Default: Falseaddmaster (
bool) – If True, use the metadata from a master CDF at SPDF rather than the metadata in the data file Default: True
- Return type:
Listoftplot variables created.
Examples
>>> import pyspedas
>>> from pyspedas import tplot
>>> vars = pyspedas.projects.wind.orbit(trange=['1999-11-5', '1999-11-6'],datatype='pre_or')
>>> tplot(vars)
Example
import pyspedas
from pyspedas import tplot
orb_vars = pyspedas.projects.wind.orbit(trange=['2013-11-5', '2013-11-6'])
tplot(['GSE_POS', 'GSE_VEL', 'GSM_POS', 'GSM_VEL'])