Dynamics Explorer 2 (DE2)
The routines in this module can be used to load data from the Dynamics Explorer 2 (DE2) mission.
Magnetometer (MAG)
- pyspedas.projects.de2.mag(trange=['1982-12-06', '1982-12-07'], instrument='mag', prefix='', suffix='', get_support_data=False, varformat=None, varnames=[], downloadonly=False, notplot=False, no_update=False, time_clip=False, force_download=False)
This function loads data from the DE2 mission.
Data is available for three years: 1981, 1982, and 1983.
- Parameters:
trange (
listofstr, optional) – Time range of interest [starttime, endtime] with the format [‘YYYY-MM-DD’,’YYYY-MM-DD’] or to specify more or less than a day [‘YYYY-MM-DD/hh:mm:ss’,’YYYY-MM-DD/hh:mm:ss’]. Default is [“1982-12-06”, “1982-12-07”]. Data is available only for years 1981, 1982, 1983.instrument (
str, optional) – Valid options are: ‘mag’, ‘nacs’, ‘rpa’, ‘idm’, ‘wats’, ‘vefi’, ‘lang’. Default is ‘mag’. Each instrument has only one datatype available, so the datatype is not a keyword option.prefix (
str, optional) – The tplot variable names will be given this prefix. Default is no prefix is added.suffix (
str, optional) – The tplot variable names will be given this suffix. Default is no suffix is added.get_support_data (
bool, optional) – Data with an attribute “VAR_TYPE” with a value of “support_data” will be loaded into tplot. Default is only loads in data with a “VAR_TYPE” attribute of “data”.varformat (
str, optional) – The file variable formats to load into tplot. Wildcard character “*” is accepted. Default is all variables are loaded in.varnames (
listofstr, optional) – List of variable names to load. Default is all data variables are loaded.downloadonly (
bool, optional) – Set this flag to download the CDF files, but not load them into tplot variables. Default is False.notplot (
bool, optional) – Return the data in hash tables instead of creating tplot variables. Default is False.no_update (
bool, optional) – If set, only load data from your local cache. Default is False.time_clip (
bool, optional) – Time clip the variables to exactly the range specified in the trange keyword. Default is False.force_download (
bool, optional) – Download file even if local version is more recent than server version. Default is False.
- Returns:
List of tplot variables created. If notplot is set to True, returns a list of dictionaries containing the data. If downloadonly is set to True, returns a list of the downloaded files.
- Return type:
Examples
>>> import pyspedas
>>> vars = pyspedas.projects.de2.load(instrument='mag', trange=['1983-02-10', '1983-02-11'], datatype='62ms', prefix = 'de2_')
>>> print(vars)
['de2_ex', 'de2_ey', 'de2_bx', 'de2_by', 'de2_bz', 'de2_bxm', 'de2_bym', 'de2_bzm',
'de2_glat', 'de2_glon', 'de2_ilat', 'de2_mlt', 'de2_alt']
>>> import pyspedas
>>> vars = pyspedas.projects.de2.lang(trange=['1983-02-10', '1983-02-11'], prefix = 'de2_')
>>> print(vars)
['de2_OrbitNumber', 'de2_electronTemp', 'de2_plasmaDensity', 'de2_satPotential',
'de2_alt', 'de2_glat', 'de2_glon', 'de2_lst', 'de2_lmt', 'de2_L', 'de2_ilat', 'de2_sza']
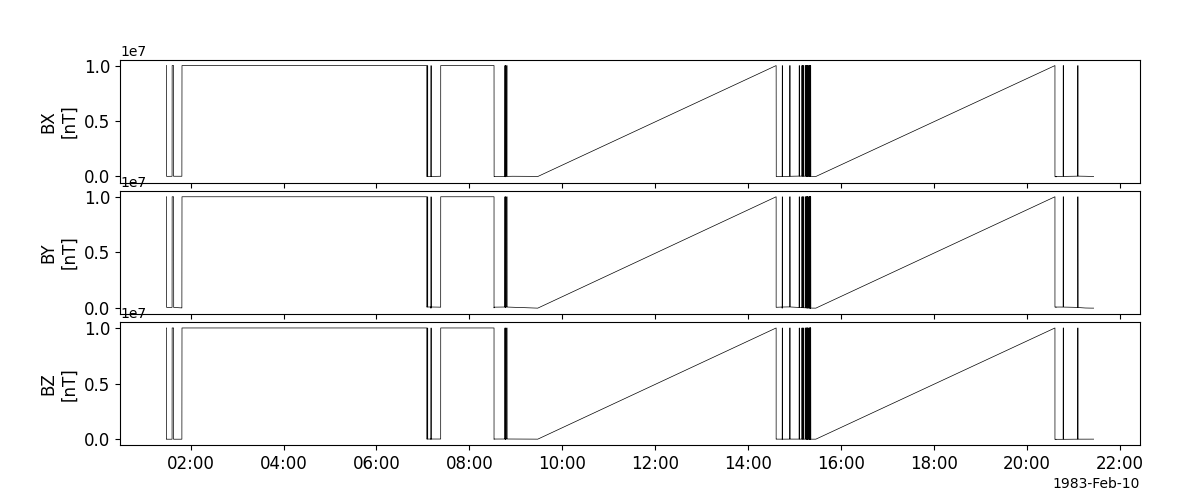
Example
import pyspedas
from pyspedas import tplot
mag_vars = pyspedas.projects.de2.mag(trange=['1983-02-10', '1983-02-11'])
tplot(['bx', 'by', 'bz'])
Neutral Atmosphere Composition Spectrometer (NACS)
- pyspedas.projects.de2.nacs(trange=['1982-12-06', '1982-12-07'], instrument='mag', prefix='', suffix='', get_support_data=False, varformat=None, varnames=[], downloadonly=False, notplot=False, no_update=False, time_clip=False, force_download=False)
This function loads data from the DE2 mission.
Data is available for three years: 1981, 1982, and 1983.
- Parameters:
trange (
listofstr, optional) – Time range of interest [starttime, endtime] with the format [‘YYYY-MM-DD’,’YYYY-MM-DD’] or to specify more or less than a day [‘YYYY-MM-DD/hh:mm:ss’,’YYYY-MM-DD/hh:mm:ss’]. Default is [“1982-12-06”, “1982-12-07”]. Data is available only for years 1981, 1982, 1983.instrument (
str, optional) – Valid options are: ‘mag’, ‘nacs’, ‘rpa’, ‘idm’, ‘wats’, ‘vefi’, ‘lang’. Default is ‘mag’. Each instrument has only one datatype available, so the datatype is not a keyword option.prefix (
str, optional) – The tplot variable names will be given this prefix. Default is no prefix is added.suffix (
str, optional) – The tplot variable names will be given this suffix. Default is no suffix is added.get_support_data (
bool, optional) – Data with an attribute “VAR_TYPE” with a value of “support_data” will be loaded into tplot. Default is only loads in data with a “VAR_TYPE” attribute of “data”.varformat (
str, optional) – The file variable formats to load into tplot. Wildcard character “*” is accepted. Default is all variables are loaded in.varnames (
listofstr, optional) – List of variable names to load. Default is all data variables are loaded.downloadonly (
bool, optional) – Set this flag to download the CDF files, but not load them into tplot variables. Default is False.notplot (
bool, optional) – Return the data in hash tables instead of creating tplot variables. Default is False.no_update (
bool, optional) – If set, only load data from your local cache. Default is False.time_clip (
bool, optional) – Time clip the variables to exactly the range specified in the trange keyword. Default is False.force_download (
bool, optional) – Download file even if local version is more recent than server version. Default is False.
- Returns:
List of tplot variables created. If notplot is set to True, returns a list of dictionaries containing the data. If downloadonly is set to True, returns a list of the downloaded files.
- Return type:
Examples
>>> import pyspedas
>>> vars = pyspedas.projects.de2.load(instrument='mag', trange=['1983-02-10', '1983-02-11'], datatype='62ms', prefix = 'de2_')
>>> print(vars)
['de2_ex', 'de2_ey', 'de2_bx', 'de2_by', 'de2_bz', 'de2_bxm', 'de2_bym', 'de2_bzm',
'de2_glat', 'de2_glon', 'de2_ilat', 'de2_mlt', 'de2_alt']
>>> import pyspedas
>>> vars = pyspedas.projects.de2.lang(trange=['1983-02-10', '1983-02-11'], prefix = 'de2_')
>>> print(vars)
['de2_OrbitNumber', 'de2_electronTemp', 'de2_plasmaDensity', 'de2_satPotential',
'de2_alt', 'de2_glat', 'de2_glon', 'de2_lst', 'de2_lmt', 'de2_L', 'de2_ilat', 'de2_sza']
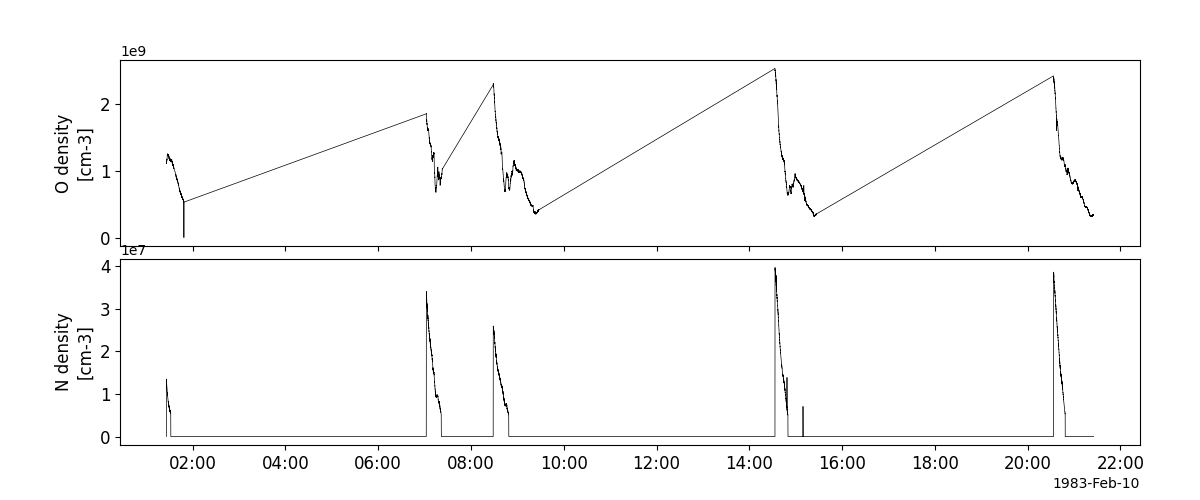
Example
import pyspedas
from pyspedas import tplot
nacs_vars = pyspedas.projects.de2.nacs(trange=['1983-02-10', '1983-02-11'])
tplot(['O_density', 'N_density'])
Retarding Potential Analyzer (RPA)
- pyspedas.projects.de2.rpa(trange=['1982-12-06', '1982-12-07'], instrument='mag', prefix='', suffix='', get_support_data=False, varformat=None, varnames=[], downloadonly=False, notplot=False, no_update=False, time_clip=False, force_download=False)
This function loads data from the DE2 mission.
Data is available for three years: 1981, 1982, and 1983.
- Parameters:
trange (
listofstr, optional) – Time range of interest [starttime, endtime] with the format [‘YYYY-MM-DD’,’YYYY-MM-DD’] or to specify more or less than a day [‘YYYY-MM-DD/hh:mm:ss’,’YYYY-MM-DD/hh:mm:ss’]. Default is [“1982-12-06”, “1982-12-07”]. Data is available only for years 1981, 1982, 1983.instrument (
str, optional) – Valid options are: ‘mag’, ‘nacs’, ‘rpa’, ‘idm’, ‘wats’, ‘vefi’, ‘lang’. Default is ‘mag’. Each instrument has only one datatype available, so the datatype is not a keyword option.prefix (
str, optional) – The tplot variable names will be given this prefix. Default is no prefix is added.suffix (
str, optional) – The tplot variable names will be given this suffix. Default is no suffix is added.get_support_data (
bool, optional) – Data with an attribute “VAR_TYPE” with a value of “support_data” will be loaded into tplot. Default is only loads in data with a “VAR_TYPE” attribute of “data”.varformat (
str, optional) – The file variable formats to load into tplot. Wildcard character “*” is accepted. Default is all variables are loaded in.varnames (
listofstr, optional) – List of variable names to load. Default is all data variables are loaded.downloadonly (
bool, optional) – Set this flag to download the CDF files, but not load them into tplot variables. Default is False.notplot (
bool, optional) – Return the data in hash tables instead of creating tplot variables. Default is False.no_update (
bool, optional) – If set, only load data from your local cache. Default is False.time_clip (
bool, optional) – Time clip the variables to exactly the range specified in the trange keyword. Default is False.force_download (
bool, optional) – Download file even if local version is more recent than server version. Default is False.
- Returns:
List of tplot variables created. If notplot is set to True, returns a list of dictionaries containing the data. If downloadonly is set to True, returns a list of the downloaded files.
- Return type:
Examples
>>> import pyspedas
>>> vars = pyspedas.projects.de2.load(instrument='mag', trange=['1983-02-10', '1983-02-11'], datatype='62ms', prefix = 'de2_')
>>> print(vars)
['de2_ex', 'de2_ey', 'de2_bx', 'de2_by', 'de2_bz', 'de2_bxm', 'de2_bym', 'de2_bzm',
'de2_glat', 'de2_glon', 'de2_ilat', 'de2_mlt', 'de2_alt']
>>> import pyspedas
>>> vars = pyspedas.projects.de2.lang(trange=['1983-02-10', '1983-02-11'], prefix = 'de2_')
>>> print(vars)
['de2_OrbitNumber', 'de2_electronTemp', 'de2_plasmaDensity', 'de2_satPotential',
'de2_alt', 'de2_glat', 'de2_glon', 'de2_lst', 'de2_lmt', 'de2_L', 'de2_ilat', 'de2_sza']
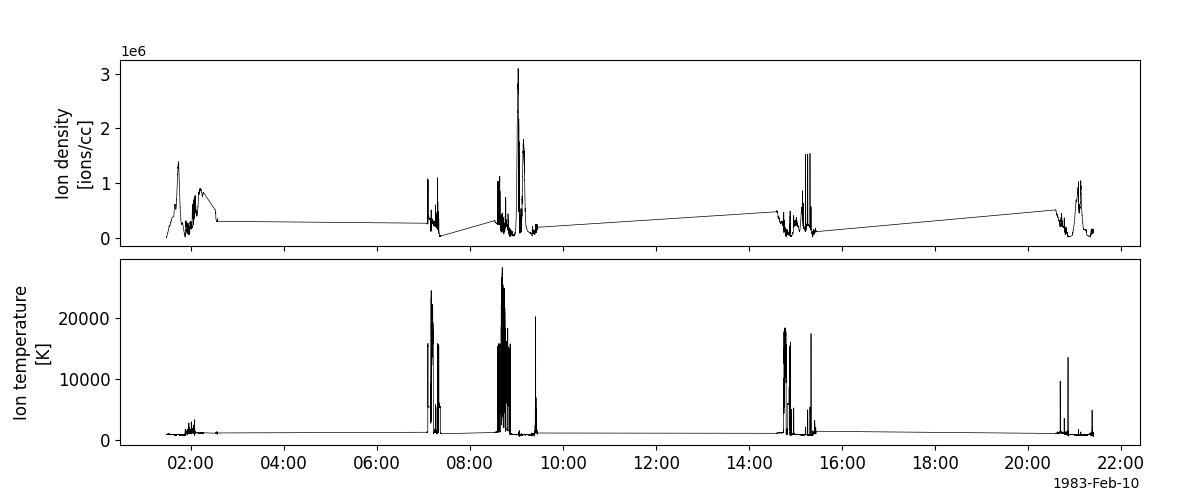
Example
import pyspedas
from pyspedas import tplot
rpa_vars = pyspedas.projects.de2.rpa(trange=['1983-02-10', '1983-02-11'])
tplot(['ionDensity', 'ionTemperature'])
Fabry-Pérot Interferometer (FPI)
- pyspedas.projects.de2.fpi(trange=['1982-12-06', '1982-12-07'], instrument='mag', prefix='', suffix='', get_support_data=False, varformat=None, varnames=[], downloadonly=False, notplot=False, no_update=False, time_clip=False, force_download=False)
This function loads data from the DE2 mission.
Data is available for three years: 1981, 1982, and 1983.
- Parameters:
trange (
listofstr, optional) – Time range of interest [starttime, endtime] with the format [‘YYYY-MM-DD’,’YYYY-MM-DD’] or to specify more or less than a day [‘YYYY-MM-DD/hh:mm:ss’,’YYYY-MM-DD/hh:mm:ss’]. Default is [“1982-12-06”, “1982-12-07”]. Data is available only for years 1981, 1982, 1983.instrument (
str, optional) – Valid options are: ‘mag’, ‘nacs’, ‘rpa’, ‘idm’, ‘wats’, ‘vefi’, ‘lang’. Default is ‘mag’. Each instrument has only one datatype available, so the datatype is not a keyword option.prefix (
str, optional) – The tplot variable names will be given this prefix. Default is no prefix is added.suffix (
str, optional) – The tplot variable names will be given this suffix. Default is no suffix is added.get_support_data (
bool, optional) – Data with an attribute “VAR_TYPE” with a value of “support_data” will be loaded into tplot. Default is only loads in data with a “VAR_TYPE” attribute of “data”.varformat (
str, optional) – The file variable formats to load into tplot. Wildcard character “*” is accepted. Default is all variables are loaded in.varnames (
listofstr, optional) – List of variable names to load. Default is all data variables are loaded.downloadonly (
bool, optional) – Set this flag to download the CDF files, but not load them into tplot variables. Default is False.notplot (
bool, optional) – Return the data in hash tables instead of creating tplot variables. Default is False.no_update (
bool, optional) – If set, only load data from your local cache. Default is False.time_clip (
bool, optional) – Time clip the variables to exactly the range specified in the trange keyword. Default is False.force_download (
bool, optional) – Download file even if local version is more recent than server version. Default is False.
- Returns:
List of tplot variables created. If notplot is set to True, returns a list of dictionaries containing the data. If downloadonly is set to True, returns a list of the downloaded files.
- Return type:
Examples
>>> import pyspedas
>>> vars = pyspedas.projects.de2.load(instrument='mag', trange=['1983-02-10', '1983-02-11'], datatype='62ms', prefix = 'de2_')
>>> print(vars)
['de2_ex', 'de2_ey', 'de2_bx', 'de2_by', 'de2_bz', 'de2_bxm', 'de2_bym', 'de2_bzm',
'de2_glat', 'de2_glon', 'de2_ilat', 'de2_mlt', 'de2_alt']
>>> import pyspedas
>>> vars = pyspedas.projects.de2.lang(trange=['1983-02-10', '1983-02-11'], prefix = 'de2_')
>>> print(vars)
['de2_OrbitNumber', 'de2_electronTemp', 'de2_plasmaDensity', 'de2_satPotential',
'de2_alt', 'de2_glat', 'de2_glon', 'de2_lst', 'de2_lmt', 'de2_L', 'de2_ilat', 'de2_sza']
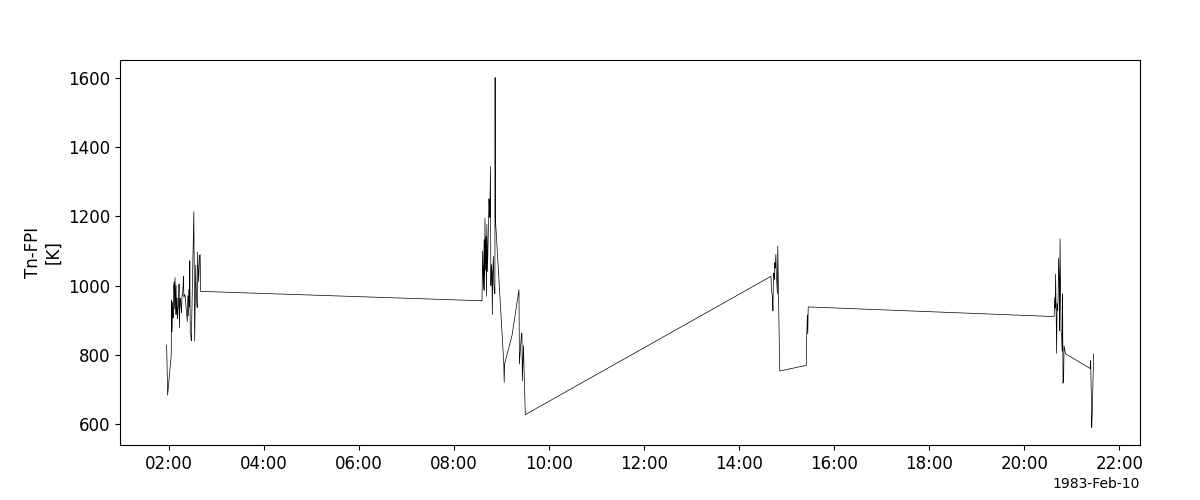
Example
import pyspedas
from pyspedas import tplot
fpi_vars = pyspedas.projects.de2.fpi(trange=['1983-02-10', '1983-02-11'])
tplot('TnF')
Ion Drift Meter (IDM)
- pyspedas.projects.de2.idm(trange=['1982-12-06', '1982-12-07'], instrument='mag', prefix='', suffix='', get_support_data=False, varformat=None, varnames=[], downloadonly=False, notplot=False, no_update=False, time_clip=False, force_download=False)
This function loads data from the DE2 mission.
Data is available for three years: 1981, 1982, and 1983.
- Parameters:
trange (
listofstr, optional) – Time range of interest [starttime, endtime] with the format [‘YYYY-MM-DD’,’YYYY-MM-DD’] or to specify more or less than a day [‘YYYY-MM-DD/hh:mm:ss’,’YYYY-MM-DD/hh:mm:ss’]. Default is [“1982-12-06”, “1982-12-07”]. Data is available only for years 1981, 1982, 1983.instrument (
str, optional) – Valid options are: ‘mag’, ‘nacs’, ‘rpa’, ‘idm’, ‘wats’, ‘vefi’, ‘lang’. Default is ‘mag’. Each instrument has only one datatype available, so the datatype is not a keyword option.prefix (
str, optional) – The tplot variable names will be given this prefix. Default is no prefix is added.suffix (
str, optional) – The tplot variable names will be given this suffix. Default is no suffix is added.get_support_data (
bool, optional) – Data with an attribute “VAR_TYPE” with a value of “support_data” will be loaded into tplot. Default is only loads in data with a “VAR_TYPE” attribute of “data”.varformat (
str, optional) – The file variable formats to load into tplot. Wildcard character “*” is accepted. Default is all variables are loaded in.varnames (
listofstr, optional) – List of variable names to load. Default is all data variables are loaded.downloadonly (
bool, optional) – Set this flag to download the CDF files, but not load them into tplot variables. Default is False.notplot (
bool, optional) – Return the data in hash tables instead of creating tplot variables. Default is False.no_update (
bool, optional) – If set, only load data from your local cache. Default is False.time_clip (
bool, optional) – Time clip the variables to exactly the range specified in the trange keyword. Default is False.force_download (
bool, optional) – Download file even if local version is more recent than server version. Default is False.
- Returns:
List of tplot variables created. If notplot is set to True, returns a list of dictionaries containing the data. If downloadonly is set to True, returns a list of the downloaded files.
- Return type:
Examples
>>> import pyspedas
>>> vars = pyspedas.projects.de2.load(instrument='mag', trange=['1983-02-10', '1983-02-11'], datatype='62ms', prefix = 'de2_')
>>> print(vars)
['de2_ex', 'de2_ey', 'de2_bx', 'de2_by', 'de2_bz', 'de2_bxm', 'de2_bym', 'de2_bzm',
'de2_glat', 'de2_glon', 'de2_ilat', 'de2_mlt', 'de2_alt']
>>> import pyspedas
>>> vars = pyspedas.projects.de2.lang(trange=['1983-02-10', '1983-02-11'], prefix = 'de2_')
>>> print(vars)
['de2_OrbitNumber', 'de2_electronTemp', 'de2_plasmaDensity', 'de2_satPotential',
'de2_alt', 'de2_glat', 'de2_glon', 'de2_lst', 'de2_lmt', 'de2_L', 'de2_ilat', 'de2_sza']
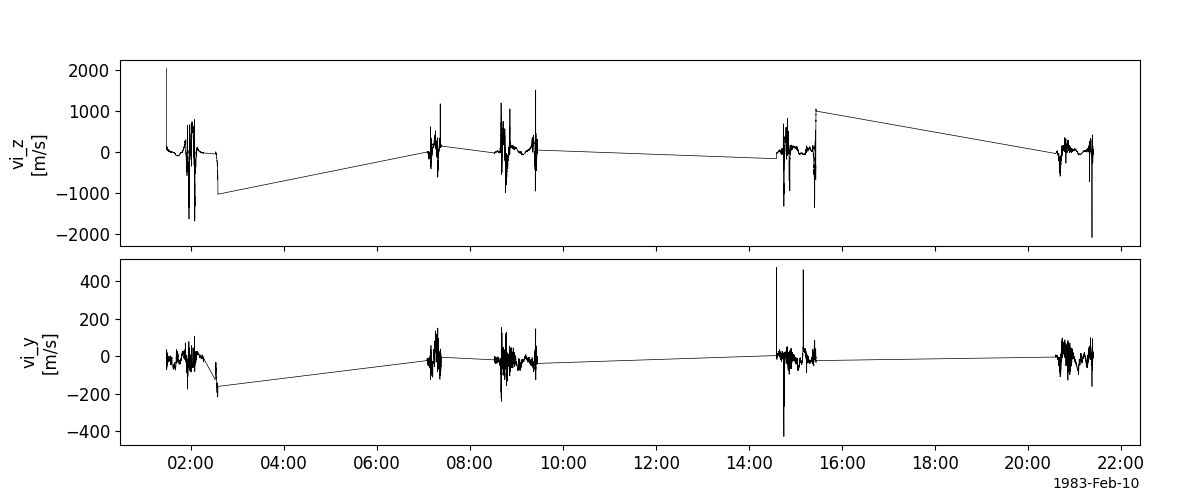
Example
import pyspedas
from pyspedas import tplot
idm_vars = pyspedas.projects.de2.idm(trange=['1983-02-10', '1983-02-11'])
tplot(['ionVelocityZ', 'ionVelocityY'])
Wind and Temperature Spectrometer (WATS)
- pyspedas.projects.de2.wats(trange=['1982-12-06', '1982-12-07'], instrument='mag', prefix='', suffix='', get_support_data=False, varformat=None, varnames=[], downloadonly=False, notplot=False, no_update=False, time_clip=False, force_download=False)
This function loads data from the DE2 mission.
Data is available for three years: 1981, 1982, and 1983.
- Parameters:
trange (
listofstr, optional) – Time range of interest [starttime, endtime] with the format [‘YYYY-MM-DD’,’YYYY-MM-DD’] or to specify more or less than a day [‘YYYY-MM-DD/hh:mm:ss’,’YYYY-MM-DD/hh:mm:ss’]. Default is [“1982-12-06”, “1982-12-07”]. Data is available only for years 1981, 1982, 1983.instrument (
str, optional) – Valid options are: ‘mag’, ‘nacs’, ‘rpa’, ‘idm’, ‘wats’, ‘vefi’, ‘lang’. Default is ‘mag’. Each instrument has only one datatype available, so the datatype is not a keyword option.prefix (
str, optional) – The tplot variable names will be given this prefix. Default is no prefix is added.suffix (
str, optional) – The tplot variable names will be given this suffix. Default is no suffix is added.get_support_data (
bool, optional) – Data with an attribute “VAR_TYPE” with a value of “support_data” will be loaded into tplot. Default is only loads in data with a “VAR_TYPE” attribute of “data”.varformat (
str, optional) – The file variable formats to load into tplot. Wildcard character “*” is accepted. Default is all variables are loaded in.varnames (
listofstr, optional) – List of variable names to load. Default is all data variables are loaded.downloadonly (
bool, optional) – Set this flag to download the CDF files, but not load them into tplot variables. Default is False.notplot (
bool, optional) – Return the data in hash tables instead of creating tplot variables. Default is False.no_update (
bool, optional) – If set, only load data from your local cache. Default is False.time_clip (
bool, optional) – Time clip the variables to exactly the range specified in the trange keyword. Default is False.force_download (
bool, optional) – Download file even if local version is more recent than server version. Default is False.
- Returns:
List of tplot variables created. If notplot is set to True, returns a list of dictionaries containing the data. If downloadonly is set to True, returns a list of the downloaded files.
- Return type:
Examples
>>> import pyspedas
>>> vars = pyspedas.projects.de2.load(instrument='mag', trange=['1983-02-10', '1983-02-11'], datatype='62ms', prefix = 'de2_')
>>> print(vars)
['de2_ex', 'de2_ey', 'de2_bx', 'de2_by', 'de2_bz', 'de2_bxm', 'de2_bym', 'de2_bzm',
'de2_glat', 'de2_glon', 'de2_ilat', 'de2_mlt', 'de2_alt']
>>> import pyspedas
>>> vars = pyspedas.projects.de2.lang(trange=['1983-02-10', '1983-02-11'], prefix = 'de2_')
>>> print(vars)
['de2_OrbitNumber', 'de2_electronTemp', 'de2_plasmaDensity', 'de2_satPotential',
'de2_alt', 'de2_glat', 'de2_glon', 'de2_lst', 'de2_lmt', 'de2_L', 'de2_ilat', 'de2_sza']
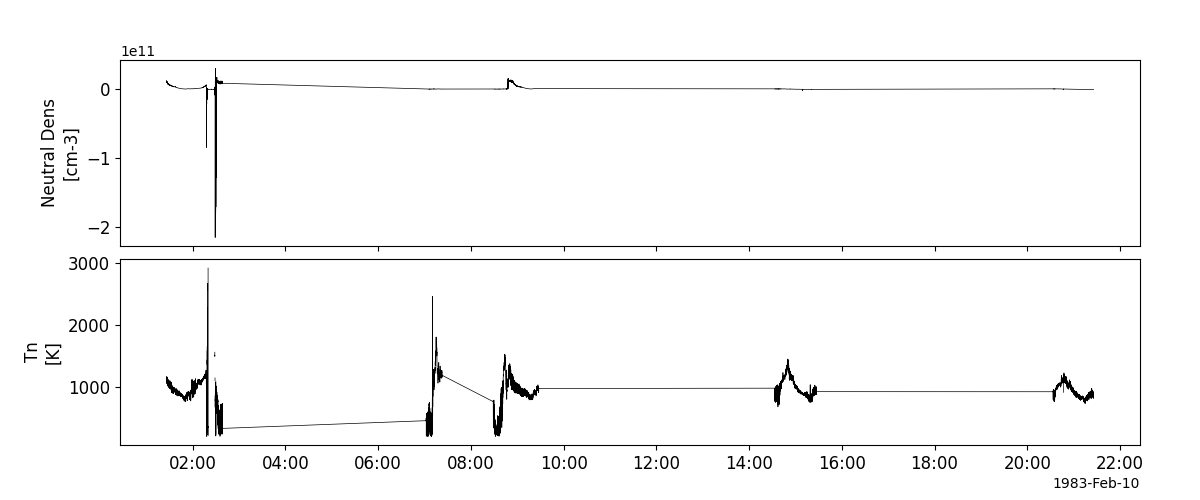
Example
import pyspedas
from pyspedas import tplot
wats_vars = pyspedas.projects.de2.wats(trange=['1983-02-10', '1983-02-11'])
tplot(['density', 'Tn'])
Vector Electric Field Instrument (VEFI)
- pyspedas.projects.de2.vefi(trange=['1982-12-06', '1982-12-07'], instrument='mag', prefix='', suffix='', get_support_data=False, varformat=None, varnames=[], downloadonly=False, notplot=False, no_update=False, time_clip=False, force_download=False)
This function loads data from the DE2 mission.
Data is available for three years: 1981, 1982, and 1983.
- Parameters:
trange (
listofstr, optional) – Time range of interest [starttime, endtime] with the format [‘YYYY-MM-DD’,’YYYY-MM-DD’] or to specify more or less than a day [‘YYYY-MM-DD/hh:mm:ss’,’YYYY-MM-DD/hh:mm:ss’]. Default is [“1982-12-06”, “1982-12-07”]. Data is available only for years 1981, 1982, 1983.instrument (
str, optional) – Valid options are: ‘mag’, ‘nacs’, ‘rpa’, ‘idm’, ‘wats’, ‘vefi’, ‘lang’. Default is ‘mag’. Each instrument has only one datatype available, so the datatype is not a keyword option.prefix (
str, optional) – The tplot variable names will be given this prefix. Default is no prefix is added.suffix (
str, optional) – The tplot variable names will be given this suffix. Default is no suffix is added.get_support_data (
bool, optional) – Data with an attribute “VAR_TYPE” with a value of “support_data” will be loaded into tplot. Default is only loads in data with a “VAR_TYPE” attribute of “data”.varformat (
str, optional) – The file variable formats to load into tplot. Wildcard character “*” is accepted. Default is all variables are loaded in.varnames (
listofstr, optional) – List of variable names to load. Default is all data variables are loaded.downloadonly (
bool, optional) – Set this flag to download the CDF files, but not load them into tplot variables. Default is False.notplot (
bool, optional) – Return the data in hash tables instead of creating tplot variables. Default is False.no_update (
bool, optional) – If set, only load data from your local cache. Default is False.time_clip (
bool, optional) – Time clip the variables to exactly the range specified in the trange keyword. Default is False.force_download (
bool, optional) – Download file even if local version is more recent than server version. Default is False.
- Returns:
List of tplot variables created. If notplot is set to True, returns a list of dictionaries containing the data. If downloadonly is set to True, returns a list of the downloaded files.
- Return type:
Examples
>>> import pyspedas
>>> vars = pyspedas.projects.de2.load(instrument='mag', trange=['1983-02-10', '1983-02-11'], datatype='62ms', prefix = 'de2_')
>>> print(vars)
['de2_ex', 'de2_ey', 'de2_bx', 'de2_by', 'de2_bz', 'de2_bxm', 'de2_bym', 'de2_bzm',
'de2_glat', 'de2_glon', 'de2_ilat', 'de2_mlt', 'de2_alt']
>>> import pyspedas
>>> vars = pyspedas.projects.de2.lang(trange=['1983-02-10', '1983-02-11'], prefix = 'de2_')
>>> print(vars)
['de2_OrbitNumber', 'de2_electronTemp', 'de2_plasmaDensity', 'de2_satPotential',
'de2_alt', 'de2_glat', 'de2_glon', 'de2_lst', 'de2_lmt', 'de2_L', 'de2_ilat', 'de2_sza']
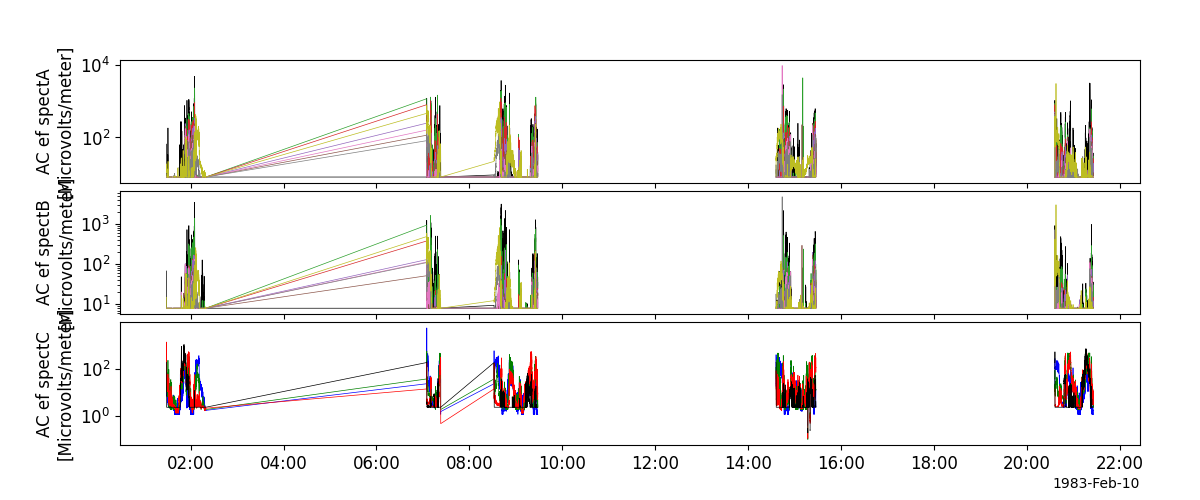
Example
import pyspedas
from pyspedas import tplot
vefi_vars = pyspedas.projects.de2.vefi(trange=['1983-02-10', '1983-02-11'])
tplot(['spectA', 'spectB', 'spectC'])
Langmuir Probe Instrument (LANG)
- pyspedas.projects.de2.lang(trange=['1982-12-06', '1982-12-07'], instrument='mag', prefix='', suffix='', get_support_data=False, varformat=None, varnames=[], downloadonly=False, notplot=False, no_update=False, time_clip=False, force_download=False)
This function loads data from the DE2 mission.
Data is available for three years: 1981, 1982, and 1983.
- Parameters:
trange (
listofstr, optional) – Time range of interest [starttime, endtime] with the format [‘YYYY-MM-DD’,’YYYY-MM-DD’] or to specify more or less than a day [‘YYYY-MM-DD/hh:mm:ss’,’YYYY-MM-DD/hh:mm:ss’]. Default is [“1982-12-06”, “1982-12-07”]. Data is available only for years 1981, 1982, 1983.instrument (
str, optional) – Valid options are: ‘mag’, ‘nacs’, ‘rpa’, ‘idm’, ‘wats’, ‘vefi’, ‘lang’. Default is ‘mag’. Each instrument has only one datatype available, so the datatype is not a keyword option.prefix (
str, optional) – The tplot variable names will be given this prefix. Default is no prefix is added.suffix (
str, optional) – The tplot variable names will be given this suffix. Default is no suffix is added.get_support_data (
bool, optional) – Data with an attribute “VAR_TYPE” with a value of “support_data” will be loaded into tplot. Default is only loads in data with a “VAR_TYPE” attribute of “data”.varformat (
str, optional) – The file variable formats to load into tplot. Wildcard character “*” is accepted. Default is all variables are loaded in.varnames (
listofstr, optional) – List of variable names to load. Default is all data variables are loaded.downloadonly (
bool, optional) – Set this flag to download the CDF files, but not load them into tplot variables. Default is False.notplot (
bool, optional) – Return the data in hash tables instead of creating tplot variables. Default is False.no_update (
bool, optional) – If set, only load data from your local cache. Default is False.time_clip (
bool, optional) – Time clip the variables to exactly the range specified in the trange keyword. Default is False.force_download (
bool, optional) – Download file even if local version is more recent than server version. Default is False.
- Returns:
List of tplot variables created. If notplot is set to True, returns a list of dictionaries containing the data. If downloadonly is set to True, returns a list of the downloaded files.
- Return type:
Examples
>>> import pyspedas
>>> vars = pyspedas.projects.de2.load(instrument='mag', trange=['1983-02-10', '1983-02-11'], datatype='62ms', prefix = 'de2_')
>>> print(vars)
['de2_ex', 'de2_ey', 'de2_bx', 'de2_by', 'de2_bz', 'de2_bxm', 'de2_bym', 'de2_bzm',
'de2_glat', 'de2_glon', 'de2_ilat', 'de2_mlt', 'de2_alt']
>>> import pyspedas
>>> vars = pyspedas.projects.de2.lang(trange=['1983-02-10', '1983-02-11'], prefix = 'de2_')
>>> print(vars)
['de2_OrbitNumber', 'de2_electronTemp', 'de2_plasmaDensity', 'de2_satPotential',
'de2_alt', 'de2_glat', 'de2_glon', 'de2_lst', 'de2_lmt', 'de2_L', 'de2_ilat', 'de2_sza']
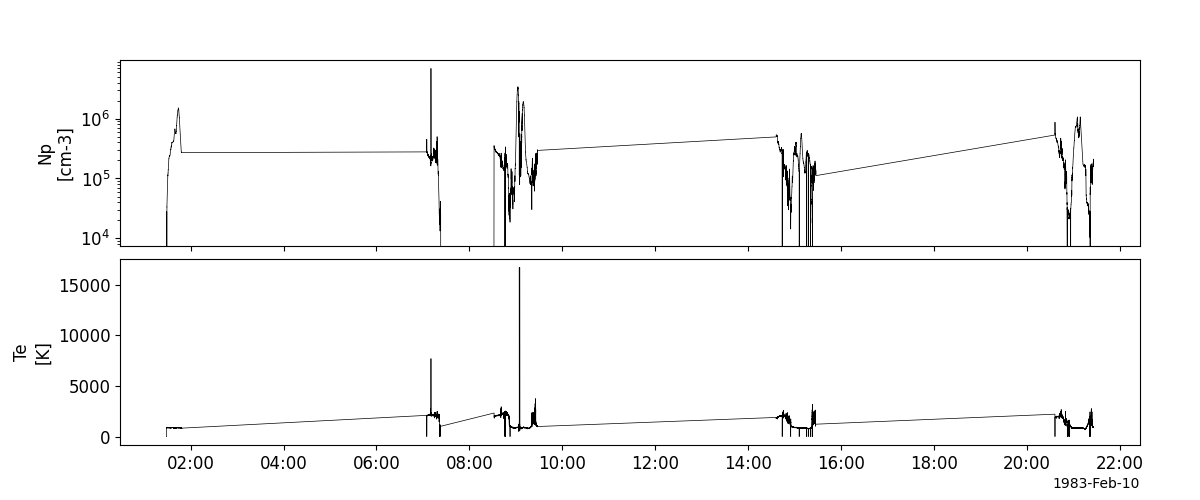
Example
import pyspedas
from pyspedas import tplot
lang_vars = pyspedas.projects.de2.lang(trange=['1983-02-10', '1983-02-11'])
tplot(['plasmaDensity', 'electronTemp'])