Mars Atmosphere and Volatile Evolution (MAVEN)
The routines in this module can be used to load data from the Mars Atmosphere and Volatile Evolution (MAVEN) mission.
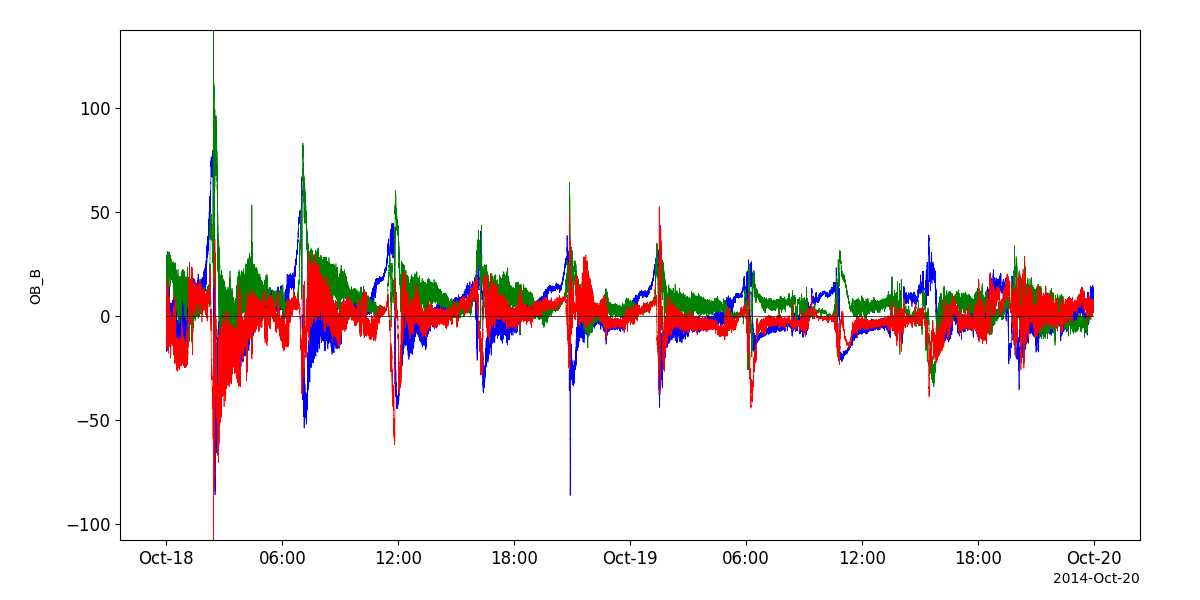
Magnetometer (MAG)
- pyspedas.projects.maven.mag(trange=['2016-01-01', '2016-01-02'], level='l2', datatype=None, suffix='', prefix='', varformat=None, get_support_data=False, auto_yes=True, downloadonly=False, varnames=[], spdf=False, public=True)[source]
Function to retrieve Magnetometer (MAG) data from the MAVEN mission.
- Parameters:
trange (
list, optional) – Time range of the data in the format [“start_date”, “end_date”]. Defaults to [“2016-01-01”, “2016-01-02”].level (
str, optional) – Data level to retrieve. Defaults to “l2”.datatype (
str, optional) – Data type to retrieve. Defaults to None.suffix (
str) – The tplot variable names will be given this suffix. Default: ‘’, no suffix is added.prefix (
str) – The tplot variable names will be given this prefix. Default: ‘’, no prefix is added.varformat (
str, optional) – Variable format. Defaults to None.get_support_data (
bool, optional) – Whether to retrieve support data. Defaults to False.auto_yes (
bool, optional) – Whether to automatically answer “yes” to prompts. Defaults to True.downloadonly (
bool, optional) – Whether to only download the data without loading it. Defaults to False.varnames (
list, optional) – List of variable names to load. Defaults to [].spdf (
bool, optional) – Flag indicating whether to use the SPDF library for loading data. Default is False.public (
bool, optional) – If False, try downloading from the non-public service
- Returns:
Dictionary of loaded data variables.
- Return type:
Example
import pyspedas
from pyspedas import tplot
mag_vars = pyspedas.projects.maven.mag(trange=['2014-10-18', '2014-10-19'])
tplot('OB_B')
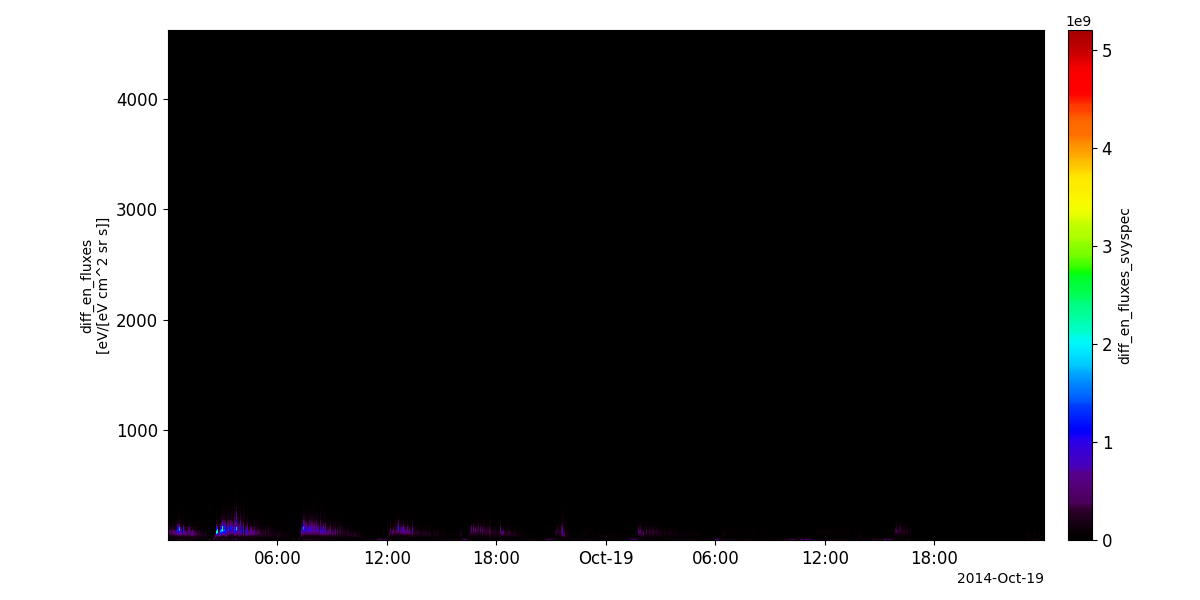
Solar Wind Electron Analyzer (SWEA)
- pyspedas.projects.maven.swea(trange=['2016-01-01', '2016-01-02'], level='l2', datatype='svyspec', suffix='', prefix='', varformat=None, get_support_data=False, auto_yes=True, downloadonly=False, varnames=[], spdf=False)[source]
Load MAVEN Solar Wind Electron Analyzer (SWEA) data.
- Parameters:
trange (
list, optional) – Time range of the data in the format [“start_date”, “end_date”]. Defaults to [“2016-01-01”, “2016-01-02”].level (
str, optional) – Data level. Defaults to “l2”.datatype (
str, optional) – Data type. Defaults to “svyspec”.suffix (
str) – The tplot variable names will be given this suffix. Default: ‘’, no suffix is added.prefix (
str) – The tplot variable names will be given this prefix. Default: ‘’, no prefix is added.varformat (
str, optional) – Variable format. Defaults to None.get_support_data (
bool, optional) – Whether to retrieve support data. Defaults to False.auto_yes (
bool, optional) – Whether to automatically answer “yes” to prompts. Defaults to True.downloadonly (
bool, optional) – Whether to only download the data without loading it. Defaults to False.varnames (
list, optional) – List of variable names to load. Defaults to [].spdf (
bool, optional) – Whether to use the SPDF library for data loading. Defaults to False.
- Returns:
Dictionary of loaded data variables.
- Return type:
Example
import pyspedas
from pyspedas import tplot
swe_vars = pyspedas.projects.maven.swea(trange=['2014-10-18', '2014-10-19'])
tplot('diff_en_fluxes_svyspec')
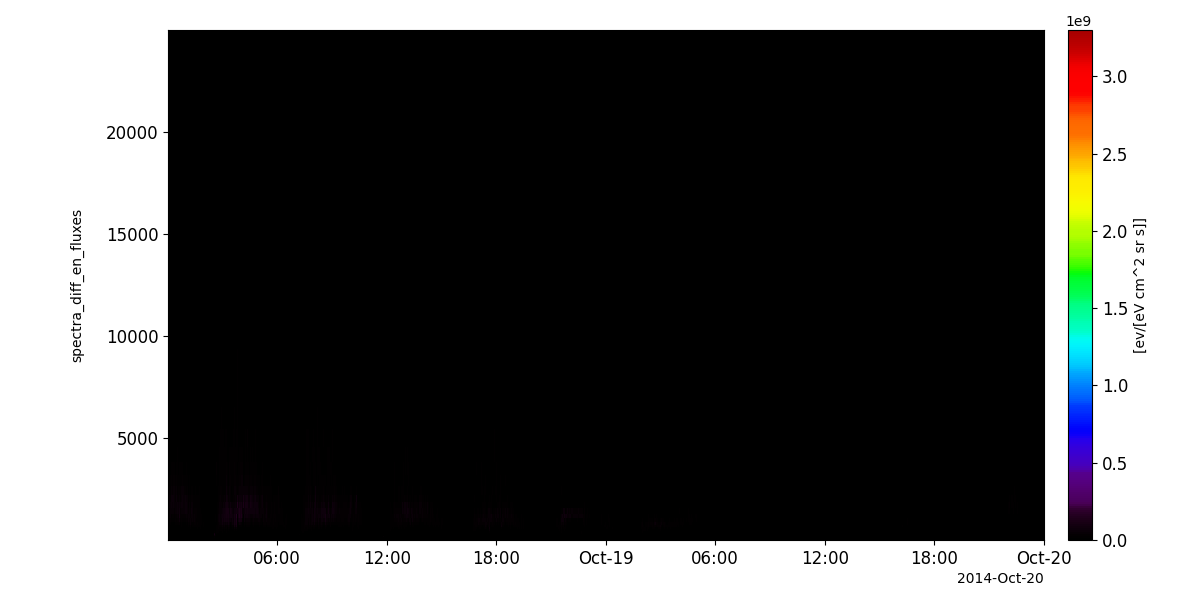
Solar Wind Ion Analyzer (SWIA)
- pyspedas.projects.maven.swia(trange=['2016-01-01', '2016-01-02'], level='l2', datatype='onboardsvyspec', suffix='', prefix='', varformat=None, get_support_data=False, auto_yes=True, downloadonly=False, varnames=[], spdf=False)[source]
Load MAVEN Solar Wind Ion Analyzer (SWIA) data.
- Parameters:
trange (
list, optional) – Time range of the data in the format [“start_date”, “end_date”]. Defaults to [“2016-01-01”, “2016-01-02”].level (
str, optional) – Data level to load. Default is “l2”.datatype (
str, optional) – Data type to load. Default is “onboardsvyspec”.suffix (
str) – The tplot variable names will be given this suffix. Default: ‘’, no suffix is added.prefix (
str) – The tplot variable names will be given this prefix. Default: ‘’, no prefix is added.varformat (
str, optional) – Variable format. Default is None.get_support_data (
bool, optional) – Whether to retrieve support data. Defaults to False.auto_yes (
bool, optional) – Whether to automatically answer “yes” to prompts. Default is True.downloadonly (
bool, optional) – Whether to only download the data without loading it. Defaults to False.varnames (
list, optional) – List of variable names to load. Defaults to [].spdf (
bool, optional) – Whether to use the SPDF library for loading the data. Default is False.
- Returns:
Dictionary of loaded data variables.
- Return type:
Example
import pyspedas
from pyspedas import tplot
swi_vars = pyspedas.projects.maven.swia(trange=['2014-10-18', '2014-10-19'])
tplot('spectra_diff_en_fluxes_onboardsvyspec')
SupraThermal And Thermal Ion Composition (STATIC)
- pyspedas.projects.maven.sta(trange=['2016-01-01', '2016-01-02'], level='l2', datatype=None, suffix='', prefix='', varformat=None, get_support_data=False, auto_yes=True, downloadonly=False, varnames=[], spdf=False)[source]
Function to load MAVEN STA data.
- Parameters:
trange (
list, optional) – Time range of the data in the format [“start_date”, “end_date”]. Defaults to [“2016-01-01”, “2016-01-02”].level (
str, optional) – Data level. Defaults to “l2”.datatype (
str, optional) – Data type. Defaults to “c0-64e2m” (spdf) or None (all data loaded) (MAVEN SDC) Valid options (for MAVEN SDC):2a, c0, c2, c4, c6, c8, ca, cc, cd, ce, cf, d0, d1, d4, d6, d7, d8, d9, da, db
varformat (
str, optional) – Variable format. Defaults to None.suffix (
str) – The tplot variable names will be given this suffix. Default: ‘’, no suffix is added.prefix (
str) – The tplot variable names will be given this prefix. Default: ‘’, no prefix is added.get_support_data (
bool, optional) – Whether to retrieve support data. Defaults to False.auto_yes (
bool, optional) – Whether to automatically answer “yes” to prompts. Defaults to True.downloadonly (
bool, optional) – Whether to only download the data without loading it. Defaults to False.varnames (
list, optional) – List of variable names to load. Defaults to [].spdf (
bool, optional) – Whether to use the SPDF library for loading data. Defaults to False.
- Returns:
Dictionary of loaded data variables.
- Return type:
Example
import pyspedas
from pyspedas import tplot
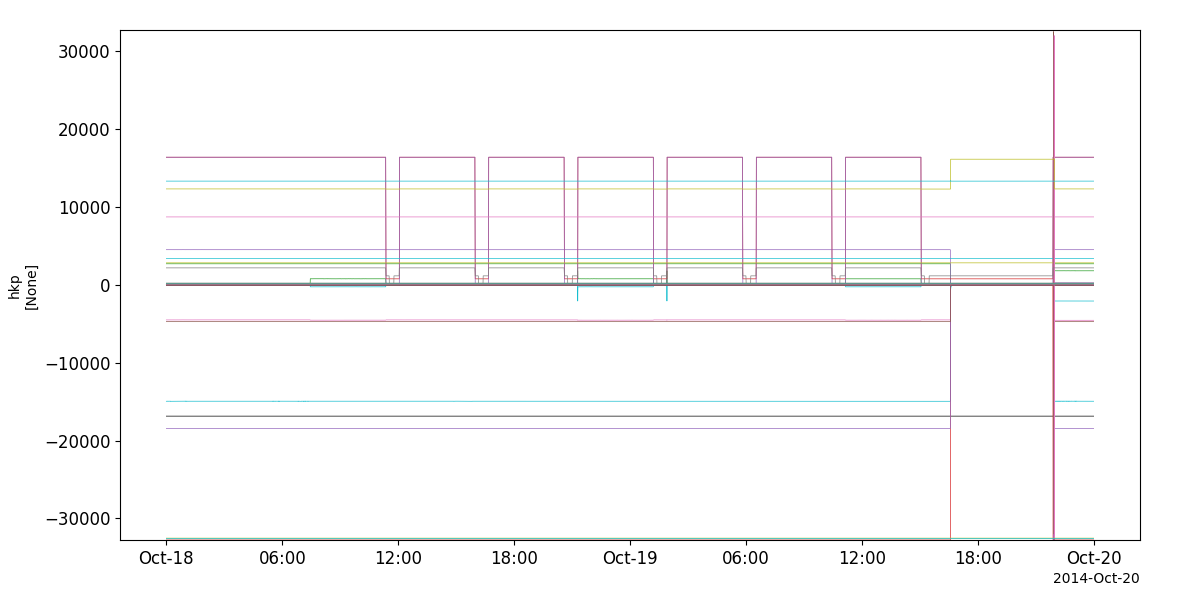
sta_vars = pyspedas.projects.maven.sta(trange=['2014-10-18', '2014-10-19'])
tplot('hkp_2a-hkp')
Solar Energetic Particle (SEP)
- pyspedas.projects.maven.sep(trange=['2016-01-01', '2016-01-02'], level='l2', datatype='s2-cal-svy-full', suffix='', prefix='', varformat=None, get_support_data=False, auto_yes=True, downloadonly=False, varnames=[], spdf=False)[source]
Loads MAVEN Solar Energetic Particle (SEP) data.
- Parameters:
trange (
list, optional) – Time range of the data in the format [“start_date”, “end_date”]. Defaults to [“2016-01-01”, “2016-01-02”].level (
str, optional) – Data level. Defaults to “l2”.datatype (
str, optional) – Data type. Defaults to “s2-cal-svy-full”.suffix (
str) – The tplot variable names will be given this suffix. Default: ‘’, no suffix is added.prefix (
str) – The tplot variable names will be given this prefix. Default: ‘’, no prefix is added.varformat (
str, optional) – Variable format. Defaults to None.get_support_data (
bool, optional) – Whether to download support data. Defaults to False.auto_yes (
bool, optional) – Whether to automatically answer ‘yes’ to all prompts. Defaults to True.downloadonly (
bool, optional) – Whether to only download the data without loading it. Defaults to False.varnames (
list, optional) – List of variable names to load. Defaults to [].spdf (
bool, optional) – Whether to use the SPDF library for loading the data. Defaults to False.
- Returns:
Dictionary of loaded data variables.
- Return type:
Example
import pyspedas
from pyspedas import tplot
sep_vars = pyspedas.projects.maven.sep(trange=['2014-10-18', '2014-10-19'])
tplot('f_ion_flux_tot_s2-cal-svy-full')

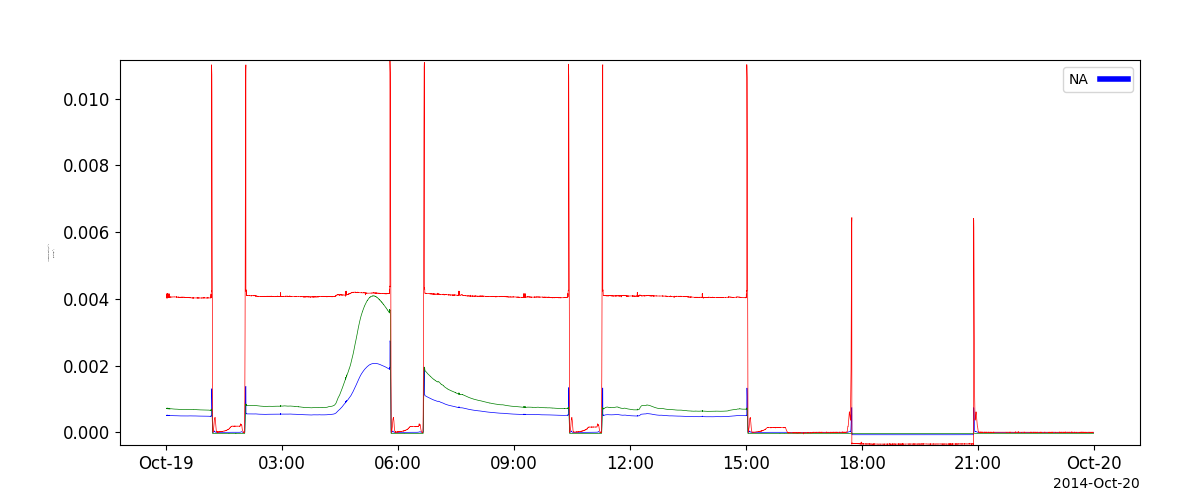
Langmuir Probe and Waves (LPW)
- pyspedas.projects.maven.lpw(trange=['2016-01-01', '2016-01-02'], level='l2', datatype='lpiv', suffix='', prefix='', varformat=None, get_support_data=False, auto_yes=True, downloadonly=False, varnames=[])[source]
Load LPW (Langmuir Probe and Waves) data from the MAVEN mission.
- Parameters:
trange (
list, optional) – Time range of the data in the format [“start_date”, “end_date”]. Defaults to [“2016-01-01”, “2016-01-02”].level (
str) – Data level to retrieve (e.g., “l1”, “l2”, “l3”).datatype (
str) – Type of data to retrieve (e.g., “lpiv”, “lpwt”).suffix (
str) – The tplot variable names will be given this suffix. Default: ‘’, no suffix is added.prefix (
str) – The tplot variable names will be given this prefix. Default: ‘’, no prefix is added.varformat (
str) – Format of the variable names.get_support_data (
bool, optional) – Whether to retrieve support data. Defaults to False.auto_yes (
bool, optional) – Whether to automatically answer “yes” to prompts. Defaults to True.downloadonly (
bool, optional) – Whether to only download the data without loading it. Defaults to False.varnames (
list, optional) – List of variable names to load. Defaults to [].
- Returns:
Dictionary of loaded data variables.
- Return type:
Example
import pyspedas
from pyspedas import tplot
lpw_vars = pyspedas.projects.maven.lpw(trange=['2014-10-18', '2014-10-19'])
tplot('mvn_lpw_lp_iv_l2_lpiv')
Extreme Ultraviolet Monitor (EUV)
- pyspedas.projects.maven.euv(trange=['2016-01-01', '2016-01-02'], level='l2', datatype='bands', suffix='', prefix='', varformat=None, get_support_data=False, auto_yes=True, downloadonly=False, varnames=[])[source]
Load EUV data from the MAVEN mission.
- Parameters:
trange (
list, optional) – Time range of the data in the format [“start_date”, “end_date”]. Defaults to [“2016-01-01”, “2016-01-02”].level (
str, optional) – Data level. Defaults to “l2”.datatype (
str, optional) – Data type. Defaults to “bands”.suffix (
str) – The tplot variable names will be given this suffix. Default: ‘’, no suffix is added.prefix (
str) – The tplot variable names will be given this prefix. Default: ‘’, no prefix is added.varformat (
str, optional) – Variable format. Defaults to None.get_support_data (
bool, optional) – Whether to retrieve support data. Defaults to False.auto_yes (
bool, optional) – Whether to automatically answer yes to prompts. Defaults to True.downloadonly (
bool, optional) – Whether to only download the data without loading it. Defaults to False.varnames (
list, optional) – List of variable names to load. Defaults to [].
- Returns:
Dictionary of loaded data variables.
- Return type:
Example
import pyspedas
from pyspedas import tplot, options
euv_vars = pyspedas.projects.maven.euv(trange=['2014-10-18', '2014-10-19'])
options('mvn_euv_calib_bands_bands','ylog',0)
tplot('mvn_euv_calib_bands_bands')