Solar & Heliospheric Observatory (SOHO)
The routines in this module can be used to load data from the Solar & Heliospheric Observatory (SOHO) mission.
Charge, Element, and Isotope Analysis System (CELIAS)
- pyspedas.projects.soho.celias(trange=['2006-06-01', '2006-06-02'], datatype='pm_5min', suffix='', prefix='', get_support_data=False, varformat=None, varnames=[], downloadonly=False, notplot=False, no_update=False, time_clip=False)[source]
This function loads data from the Charge, Element, and Isotope Analysis System (CELIAS)
- Parameters:
trange (
listofstr) – time range of interest [starttime, endtime] with the format ‘YYYY-MM-DD’,’YYYY-MM-DD’] or to specify more or less than a day [‘YYYY-MM-DD/hh:mm:ss’,’YYYY-MM-DD/hh:mm:ss’]datatype (
str) –- Data type; Valid options:
‘pm_5min’ for L1 data ‘pm_30s’ for L1 data ‘sem_1day’ for L2 data ‘sem_15s’ for L2 data
suffix (
str) – The tplot variable names will be given this suffix. By default, no prefix is added. Default: ‘’prefix (
str) – The tplot variable names will be given this prefix. By default, no prefix is added. Default: ‘’get_support_data (
bool) – Data with an attribute “VAR_TYPE” with a value of “support_data” will be loaded into tplot. By default, only loads in data with a “VAR_TYPE” attribute of “data”.varformat (
str) – The file variable formats to load into tplot. Wildcard character “*” is accepted. By default, all variables are loaded in.varnames (
listofstr) – List of variable names to load (if not specified, all data variables are loaded)downloadonly (
bool) – Set this flag to download the CDF files, but not load them into tplot variablesnotplot (
bool) – Return the data in hash tables instead of creating tplot variablesno_update (
bool) – If set, only load data from your local cachetime_clip (
bool) – Time clip the variables to exactly the range specified in the trange keyword
- Return type:
Listoftplot variables created.
Example
import pyspedas
from pyspedas import tplot
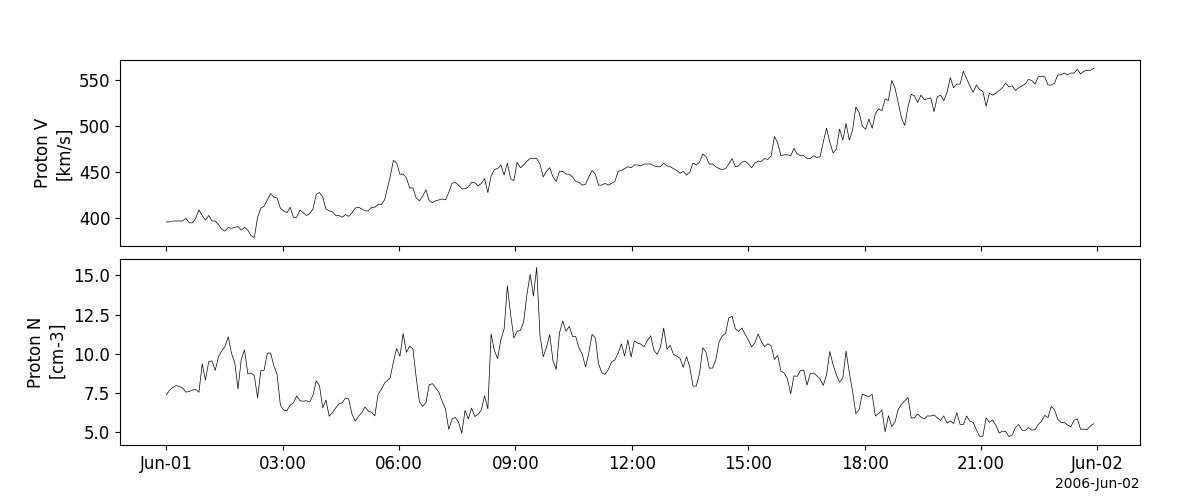
celias_vars = pyspedas.projects.soho.celias(trange=['2006-06-01', '2006-06-02'])
tplot(['V_p', 'N_p'])
Comprehensive Suprathermal and Energetic Particle Analyzer (COSTEP)
- pyspedas.projects.soho.costep(trange=['2006-06-01', '2006-06-02'], datatype='ephin_l3i-1day', suffix='', prefix='', get_support_data=False, varformat=None, varnames=[], downloadonly=False, notplot=False, no_update=False, time_clip=False)[source]
This function loads data from the Comprehensive Suprathermal and Energetic Particle Analyzer (COSTEP)
- Parameters:
trange (
listofstr) – time range of interest [starttime, endtime] with the format ‘YYYY-MM-DD’,’YYYY-MM-DD’] or to specify more or less than a day [‘YYYY-MM-DD/hh:mm:ss’,’YYYY-MM-DD/hh:mm:ss’]datatype (
str) –- Data type; options: (default: ephin_l3i-1day)
ephin_l3i-1day ephin_l3i-1hr ephin_l3i-30min ephin_l3i-10min ephin_l3i-5min ephin_l3i-1min
suffix (
str) – The tplot variable names will be given this suffix. By default, no prefix is added. Default: ‘’prefix (
str) – The tplot variable names will be given this prefix. By default, no prefix is added. Default: ‘’get_support_data (
bool) – Data with an attribute “VAR_TYPE” with a value of “support_data” will be loaded into tplot. By default, only loads in data with a “VAR_TYPE” attribute of “data”.varformat (
str) – The file variable formats to load into tplot. Wildcard character “*” is accepted. By default, all variables are loaded in.varnames (
listofstr) – List of variable names to load (if not specified, all data variables are loaded)downloadonly (
bool) – Set this flag to download the CDF files, but not load them into tplot variablesnotplot (
bool) – Return the data in hash tables instead of creating tplot variablesno_update (
bool) – If set, only load data from your local cachetime_clip (
bool) – Time clip the variables to exactly the range specified in the trange keyword
- Return type:
Listoftplot variables created.
Example
import pyspedas
from pyspedas import tplot
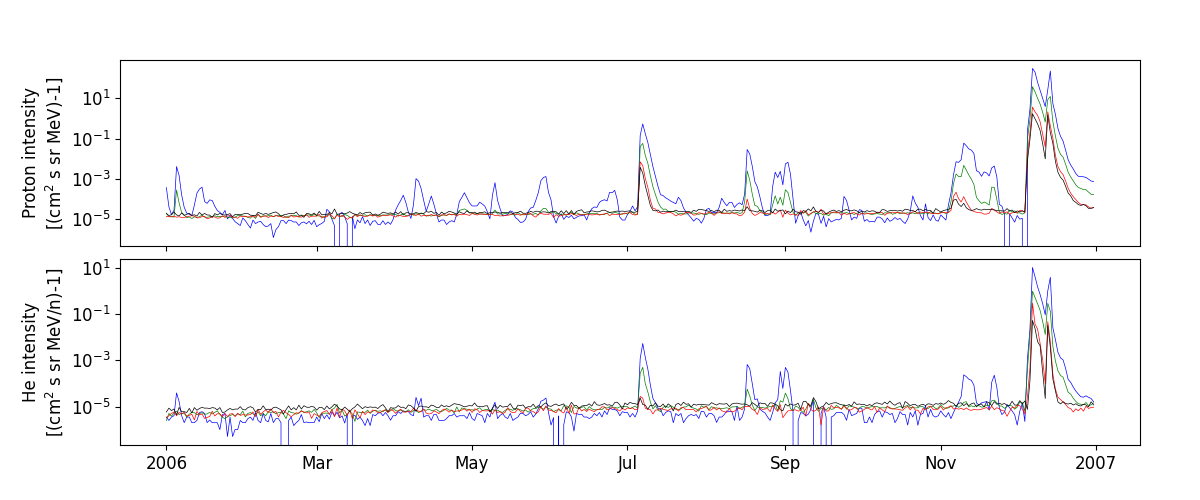
costep_vars = pyspedas.projects.soho.costep(trange=['2006-06-01', '2006-06-02'])
tplot(['P_int', 'He_int'])
Energetic and Relativistic Nuclei and Electron experiment (ERNE)
- pyspedas.projects.soho.erne(trange=['2006-06-01', '2006-06-02'], datatype='hed_l2-1min', suffix='', prefix='', get_support_data=False, varformat=None, varnames=[], downloadonly=False, notplot=False, no_update=False, time_clip=False)[source]
This function loads data from the Energetic and Relativistic Nuclei and Electron experiment (ERNE)
- Parameters:
trange (
listofstr) – time range of interest [starttime, endtime] with the format ‘YYYY-MM-DD’,’YYYY-MM-DD’] or to specify more or less than a day [‘YYYY-MM-DD/hh:mm:ss’,’YYYY-MM-DD/hh:mm:ss’]datatype (
str) –- Data type; Valid options:
‘hed_l2-1min’ for L2 data ‘led_l2-1min’ for L2 data
suffix (
str) – The tplot variable names will be given this suffix. By default, no prefix is added. Default: ‘’prefix (
str) – The tplot variable names will be given this prefix. By default, no prefix is added. Default: ‘’get_support_data (
bool) – Data with an attribute “VAR_TYPE” with a value of “support_data” will be loaded into tplot. By default, only loads in data with a “VAR_TYPE” attribute of “data”.varformat (
str) – The file variable formats to load into tplot. Wildcard character “*” is accepted. By default, all variables are loaded in.varnames (
listofstr) – List of variable names to load (if not specified, all data variables are loaded)downloadonly (
bool) – Set this flag to download the CDF files, but not load them into tplot variablesnotplot (
bool) – Return the data in hash tables instead of creating tplot variablesno_update (
bool) – If set, only load data from your local cachetime_clip (
bool) – Time clip the variables to exactly the range specified in the trange keyword
- Return type:
Listoftplot variables created.
Example
import pyspedas
from pyspedas import tplot
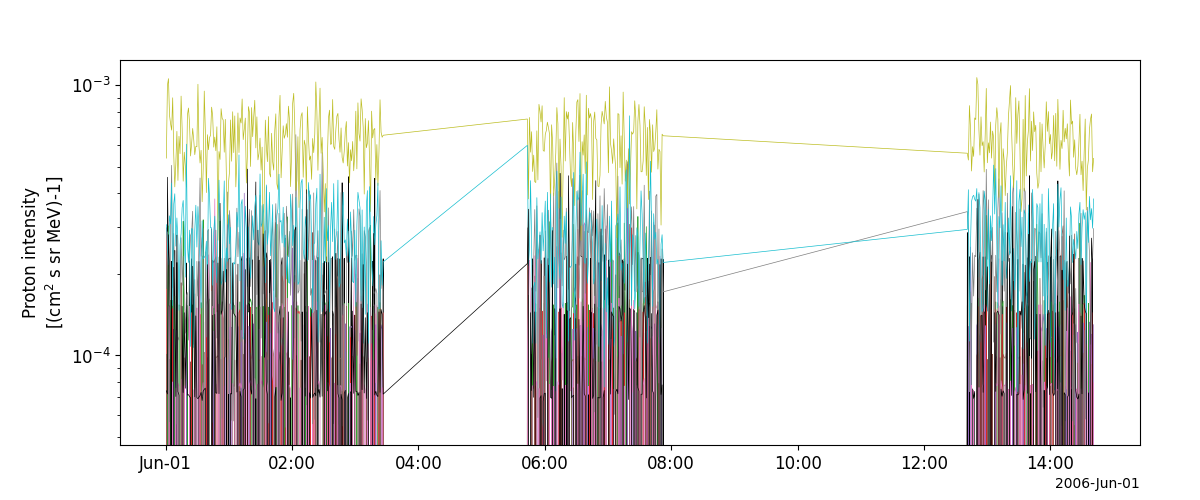
erne_vars = pyspedas.projects.soho.erne(trange=['2006-06-01', '2006-06-02'])
tplot('PH')
Orbit (ephemeris and attitude) data (ORBIT)
- pyspedas.projects.soho.orbit(trange=['2006-06-01', '2006-06-02'], datatype='pre_or', suffix='', prefix='', get_support_data=False, varformat=None, varnames=[], downloadonly=False, notplot=False, no_update=False, time_clip=False)[source]
This function loads data from the Orbit (ephemeris and attitude) data (ORBIT)
- Parameters:
trange (
listofstr) – time range of interest [starttime, endtime] with the format ‘YYYY-MM-DD’,’YYYY-MM-DD’] or to specify more or less than a day [‘YYYY-MM-DD/hh:mm:ss’,’YYYY-MM-DD/hh:mm:ss’]datatype (
str) –- Data type; Valid options:
‘def_at’ for definitive attitude data ‘def_or’ for definitive orbit data ‘pre_or’ for preliminary orbit data (default)
suffix (
str) – The tplot variable names will be given this suffix. By default, no suffix is added.get_support_data (
bool) – Data with an attribute “VAR_TYPE” with a value of “support_data” will be loaded into tplot. By default, only loads in data with a “VAR_TYPE” attribute of “data”.varformat (
str) – The file variable formats to load into tplot. Wildcard character “*” is accepted. By default, all variables are loaded in.varnames (
listofstr) – List of variable names to load (if not specified, all data variables are loaded)downloadonly (
bool) – Set this flag to download the CDF files, but not load them into tplot variablesnotplot (
bool) – Return the data in hash tables instead of creating tplot variablesno_update (
bool) – If set, only load data from your local cachetime_clip (
bool) – Time clip the variables to exactly the range specified in the trange keyword
- Return type:
Listoftplot variables created.
Example
import pyspedas
from pyspedas import tplot
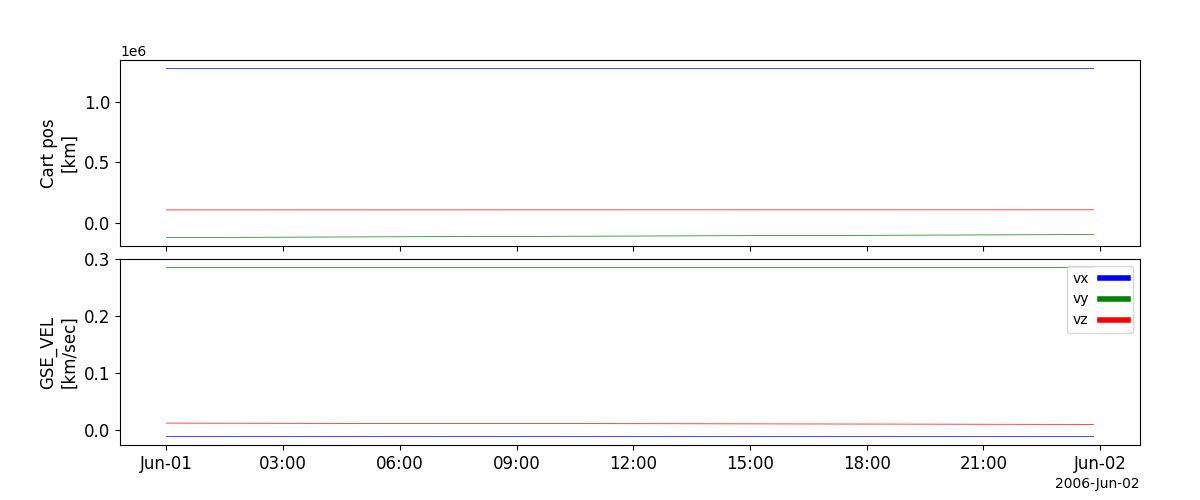
orbit_vars = pyspedas.projects.soho.orbit(trange=['2006-06-01', '2006-06-02'])
tplot(['GSE_POS', 'GSE_VEL'])