Kyoto Dst
The routines in this module can be used to load Kyoto Dst data from the World Data Center for Geomagnetism, Kyoto.
Load the data
- pyspedas.projects.kyoto.dst(trange=None, datatypes=['final', 'provisional', 'realtime'], time_clip=True, remote_data_dir='http://wdc.kugi.kyoto-u.ac.jp/', prefix='', suffix='', no_download=False, local_data_dir='', download_only=False, force_download=False)[source]
Loads Dst index data from the Kyoto servers.
- Parameters:
trange (
listofstr,required) – Time range of interest with the format [‘YYYY-MM-DD’,’YYYY-MM-DD’] or to specify more or less than a day [‘YYYY-MM-DD/hh:mm:ss’,’YYYY-MM-DD/hh:mm:ss’].time_clip (
bool, optional) – Time clip the variables to exactly the range specified in the trange keyword. Defaults to True.remote_data_dir (
str, optional) – The remote directory from where to load the Dst index data. Defaults to “http://wdc.kugi.kyoto-u.ac.jp/”.suffix (
str, optional) – The tplot variable names will be given this suffix. By default, no suffix is added.force_download (
bool) – Download file even if local version is more recent than server version Default: False
- Returns:
List of tplot variables created.
- Return type:
Notes
There are three types of Dst data available: final, provisional, and realtime. Usually, only one type is available for a particular month. is function tries to download final data, if this is not available then it downloads provisional data, and if this is not available then it downloads realtime data.
Examples
>>> from pyspedas.projects.kyoto import dst
>>> dst_data = dst(trange=['2015-01-01', '2015-01-02'])
>>> print(dst_data)
kyoto_dst
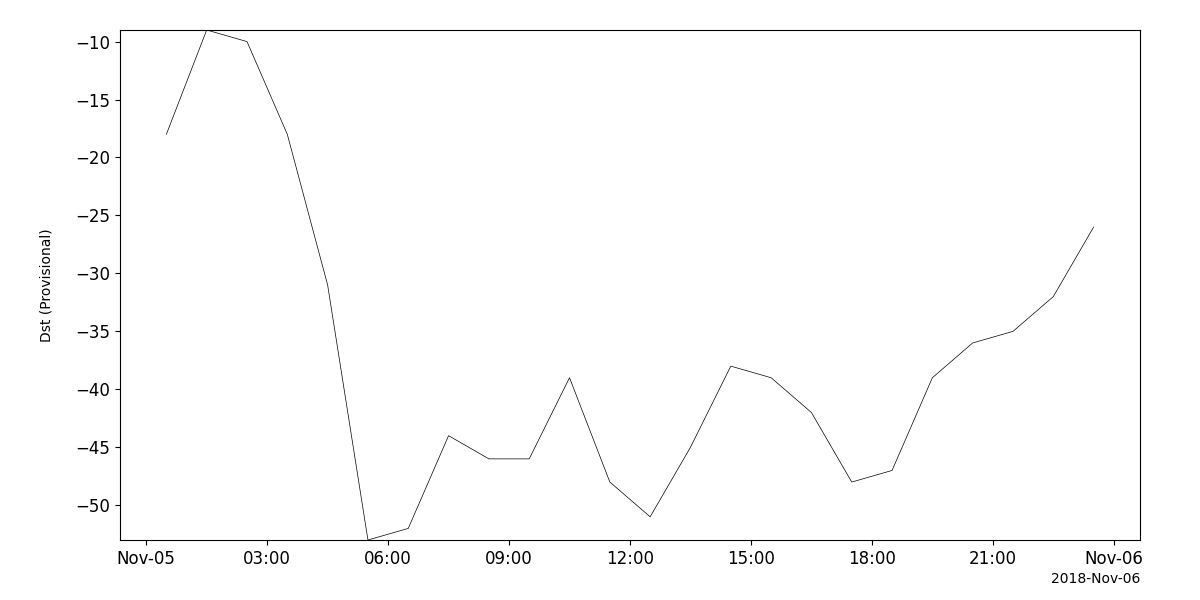
Example
import pyspedas
from pyspedas import tplot
dst_vars = pyspedas.projects.kyoto.dst(trange=['2018-11-5', '2018-11-6'])
tplot('kyoto_dst')