Cluster
The routines in this module can be used to load data from the Cluster mission.
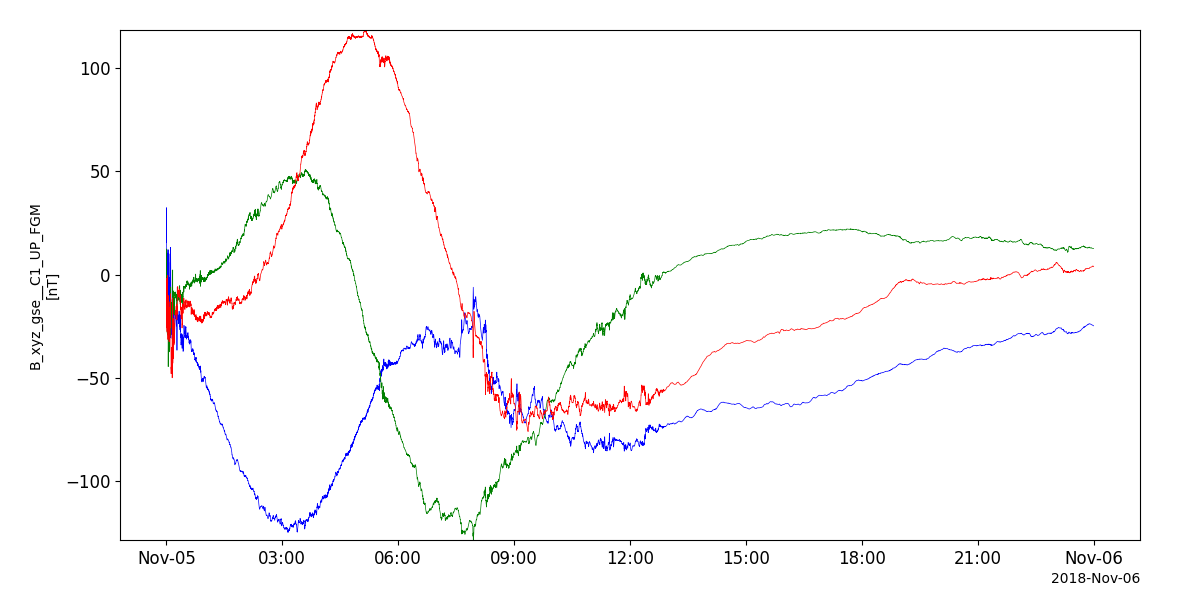
Fluxgate Magnetometer (FGM)
- pyspedas.projects.cluster.fgm(trange: List[str] = ['2018-11-5', '2018-11-6'], probe: str | List[str] = '1', datatype: str = 'up', prefix: str = '', suffix: str = '', get_support_data: bool = False, varformat: str = None, varnames: List[str] = [], downloadonly: bool = False, notplot: bool = False, no_update: bool = False, time_clip: bool = False, force_download=False) List[str][source]
Load data from the Cluster Fluxgate Magnetometer
- Parameters:
trange (
listofstr) – time range of interest [starttime, endtime] with the format [‘YYYY-MM-DD’,’YYYY-MM-DD’] or to specify more or less than a day [‘YYYY-MM-DD/hh:mm:ss’,’YYYY-MM-DD/hh:mm:ss’] Default: [‘2018-11-5’, ‘2018-11-6’]probe (
strorlistofstr) – List of probes to load. Valid options: ‘1’,’2’,’3’,’4’ Default: ‘1’datatype (
str) – Data type; Valid options: Default: ‘up’prefix (
str) – The tplot variable names will be given this prefix. Default: ‘’suffix (
str) – The tplot variable names will be given this suffix. Default: ‘’get_support_data (
bool) – If True, Data with an attribute “VAR_TYPE” with a value of “support_data” will be loaded into tplot.varformat (
str) – The file variable formats to load into tplot. Wildcard character “*” is accepted. If empty or None, all variables will be loaded. Default: None (all variables loaded)varnames (
listofstr) – List of CDF variable names to load (if empty or not specified, all data variables are loaded) Default: [] (all variables loaded)downloadonly (
bool) – Set this flag to download the CDF files, but not load them into tplot variables Default: Falsenotplot (
bool) – Return the data in hash tables instead of creating tplot variables Default: Falseno_update (
bool) – If set, only load data from your local cache Default: Falsetime_clip (
bool) – Time clip the variables to exactly the range specified in the trange keyword Default: Falseforce_download (
bool) – Download file even if local version is more recent than server version Default: False
- Returns:
List of tplot variables created.
- Return type:
Examples
>>> import pyspedas
>>> from pyspedas import tplot
>>> fgm_vars = pyspedas.projects.cluster.fgm(trange=['2018-11-5', '2018-11-6'],probe=['1','2'])
Example
import pyspedas
from pyspedas import tplot
fgm_vars = pyspedas.projects.cluster.fgm(trange=['2018-11-5', '2018-11-6'])
tplot('B_xyz_gse__C1_UP_FGM')
Active Spacecraft Potential Control experiment (ASPOC)
- pyspedas.projects.cluster.aspoc(trange: List[str] = ['2003-11-5', '2003-11-6'], probe: str | List[str] = '1', datatype: str = 'pp', prefix: str = '', suffix: str = '', get_support_data: bool = False, varformat: str = None, varnames: List[str] = [], downloadonly: bool = False, notplot: bool = False, no_update: bool = False, time_clip: bool = False, force_download=False) List[str][source]
Load data from the Cluster Active Spacecraft Potential Control experiment
- Parameters:
trange (
listofstr) – time range of interest [starttime, endtime] with the format [‘YYYY-MM-DD’,’YYYY-MM-DD’] or to specify more or less than a day [‘YYYY-MM-DD/hh:mm:ss’,’YYYY-MM-DD/hh:mm:ss’] Default: [‘2003-11-5’, ‘2003-11-6’]probe (
listofstr) – List of probes to load. Valid options: ‘1’,’2’,’3’,’4’ Default: ‘1’datatype (
str) – Data type; Valid options: Default: ‘pp’prefix (
str) – The tplot variable names will be given this prefix. Default: ‘’suffix (
str) – The tplot variable names will be given this suffix. Default: ‘’get_support_data (
bool) – If True, Data with an attribute “VAR_TYPE” with a value of “support_data” will be loaded into tplot.varformat (
str) – The file variable formats to load into tplot. Wildcard character “*” is accepted. If empty or None, all variables will be loaded. Default: None (all variables loaded)varnames (
listofstr) – List of CDF variable names to load (if empty or not specified, all data variables are loaded) Default: [] (all variables loaded)downloadonly (
bool) – Set this flag to download the CDF files, but not load them into tplot variables Default: Falsenotplot (
bool) – Return the data in hash tables instead of creating tplot variables Default: Falseno_update (
bool) – If set, only load data from your local cache Default: Falsetime_clip (
bool) – Time clip the variables to exactly the range specified in the trange keyword Default: Falseforce_download (
bool) – Download file even if local version is more recent than server version Default: False
- Returns:
List of tplot variables created.
- Return type:
Examples
>>> import pyspedas
>>> from pyspedas import tplot
>>> aspoc_vars=pyspedas.projects.cluster.aspoc(trange=['2003-11-05','2003-11-06'],probe=['1','2'])
>>> tplot(['I_ion__C1_PP_ASP','I_ion__C2_PP_ASP'])
Example
import pyspedas
from pyspedas import tplot
asp_vars = pyspedas.projects.cluster.aspoc(trange=['2004-10-01', '2004-10-2'])
tplot('I_ion__C1_PP_ASP')
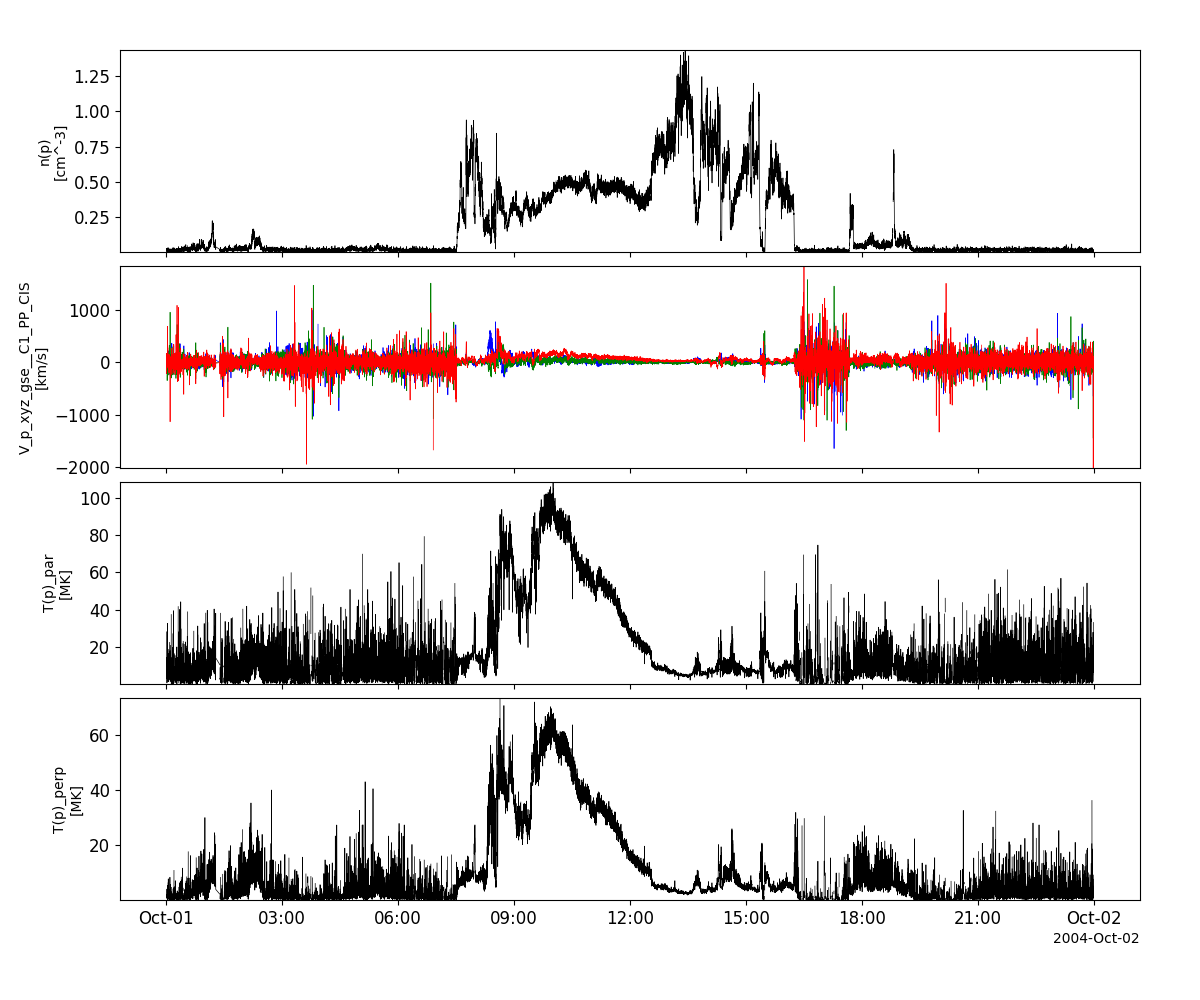
Cluster Ion Spectroscopy experiment (CIS)
- pyspedas.projects.cluster.cis(trange: List[str] = ['2018-11-5', '2018-11-6'], probe: str | List[str] = '1', option: str = 'mom', datatype: str = 'pp', prefix: str = '', suffix: str = '', get_support_data: bool = False, varformat: str = None, varnames: List[str] = [], downloadonly: bool = False, notplot: bool = False, no_update: bool = False, time_clip: bool = False, force_download=False) List[str][source]
Load data from the Cluster Ion Spectroscopy experiment
- Parameters:
trange (
listofstr) – time range of interest [starttime, endtime] with the format [‘YYYY-MM-DD’,’YYYY-MM-DD’] or to specify more or less than a day [‘YYYY-MM-DD/hh:mm:ss’,’YYYY-MM-DD/hh:mm:ss’] Default: [‘2018-11-5’, ‘2018-11-6’]probe (
listofstr) – List of probes to load. Valid options: ‘1’,’2’,’3’,’4’ Default: ‘1’option (
str) – The data option to load. Valid options: ‘mom’ (moments),‘psd_h1’ (H+ codif PSD), ‘psd_he1’ (He+ codif PSD), ‘psd_o1’ (O+ codif PSD), ‘psd_ions’ (ion hia PSD) ‘def_h1’ (H+ codif differential energy flux), ‘def_he1’ (He+ codif differential energy flux), ‘def_o1’ (O+ codif differential energy flux)
Default: ‘mom’
datatype (
str) – Data type; Valid options: Default: ‘pp’prefix (
str) – The tplot variable names will be given this prefix. Default: ‘’suffix (
str) – The tplot variable names will be given this suffix. Default: ‘’get_support_data (
bool) – If True, Data with an attribute “VAR_TYPE” with a value of “support_data” will be loaded into tplot.varformat (
str) – The file variable formats to load into tplot. Wildcard character “*” is accepted. If empty or None, all variables will be loaded. Default: None (all variables loaded)varnames (
listofstr) – List of CDF variable names to load (if empty or not specified, all data variables are loaded) Default: [] (all variables loaded)downloadonly (
bool) – Set this flag to download the CDF files, but not load them into tplot variables Default: Falsenotplot (
bool) – Return the data in hash tables instead of creating tplot variables Default: Falseno_update (
bool) – If set, only load data from your local cache Default: Falsetime_clip (
bool) – Time clip the variables to exactly the range specified in the trange keyword Default: Falseforce_download (
bool) – Download file even if local version is more recent than server version Default: False
- Returns:
List of tplot variables created.
- Return type:
Examples
>>> import pyspedas
>>> from pyspedas import tplot
>>> cis_vars = pyspedas.projects.cluster.cis(trange=['2003-11-01','2003-11-02'],probe=['1'])
>>> tplot(['N_p__C1_PP_CIS','N_O1__C1_PP_CIS','N_He1__C1_PP_CIS','N_He2__C1_PP_CIS','N_HIA__C1_PP_CIS'])
Example
import pyspedas
from pyspedas import tplot
cis_vars = pyspedas.projects.cluster.cis(trange=['2004-10-01', '2004-10-2'])
tplot(['N_p__C1_PP_CIS', 'V_p_xyz_gse__C1_PP_CIS', 'T_p_par__C1_PP_CIS', 'T_p_perp__C1_PP_CIS'])
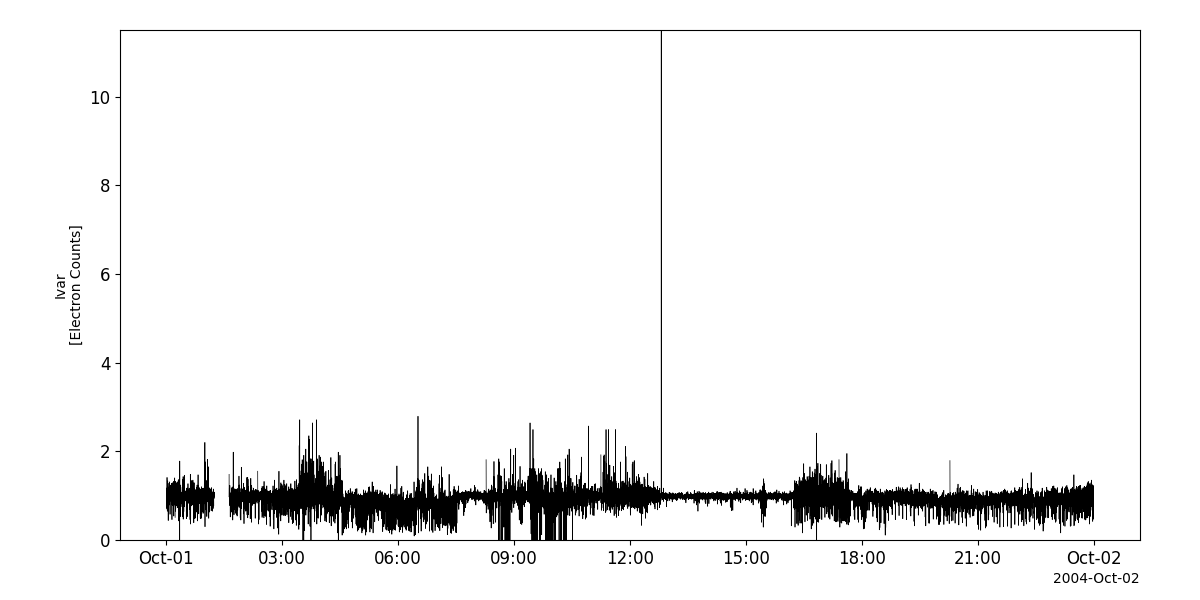
Digital Wave Processing instrument (DWP)
- pyspedas.projects.cluster.dwp(trange: List[str] = ['2018-11-5', '2018-11-6'], probe: str | List[str] = '1', datatype: str = 'pp', prefix: str = '', suffix: str = '', get_support_data: bool = False, varformat: str = None, varnames: List[str] = [], downloadonly: bool = False, notplot: bool = False, no_update: bool = False, time_clip: bool = False, force_download=False) List[str][source]
Load data from the Cluster Digital Wave Processing instrument
- Parameters:
trange (
listofstr) – time range of interest [starttime, endtime] with the format [‘YYYY-MM-DD’,’YYYY-MM-DD’] or to specify more or less than a day [‘YYYY-MM-DD/hh:mm:ss’,’YYYY-MM-DD/hh:mm:ss’] Default: [‘2018-11-5’, ‘2018-11-6’]probe (
listofstr) – List of probes to load. Valid options: ‘1’,’2’,’3’,’4’ Default: ‘1’datatype (
str) – Data type; Valid options: Default: ‘pp’prefix (
str) – The tplot variable names will be given this prefix. Default: ‘’suffix (
str) – The tplot variable names will be given this suffix. Default: ‘’get_support_data (
bool) – If True, Data with an attribute “VAR_TYPE” with a value of “support_data” will be loaded into tplot.varformat (
str) – The file variable formats to load into tplot. Wildcard character “*” is accepted. If empty or None, all variables will be loaded. Default: None (all variables loaded)varnames (
listofstr) – List of CDF variable names to load (if empty or not specified, all data variables are loaded) Default: [] (all variables loaded)downloadonly (
bool) – Set this flag to download the CDF files, but not load them into tplot variables Default: Falsenotplot (
bool) – Return the data in hash tables instead of creating tplot variables Default: Falseno_update (
bool) – If set, only load data from your local cache Default: Falsetime_clip (
bool) – Time clip the variables to exactly the range specified in the trange keyword Default: Falseforce_download (
bool) – Download file even if local version is more recent than server version Default: False
- Returns:
List of tplot variables created.
- Return type:
Examples
>>> import pyspedas
>>> from pyspedas import tplot
>>> dwp_vars = pyspedas.projects.cluster.dwp(trange=['2003-11-01','2003-11-02'],probe=['1','2'])
>>> tplot(['Correl_freq__C1_PP_DWP','Correl_P__C1_PP_DWP'])
Example
import pyspedas
from pyspedas import tplot
dwp_vars = pyspedas.projects.cluster.dwp(trange=['2004-10-01', '2004-10-2'])
tplot('Correl_Ivar__C1_PP_DWP')
Electron Drift Instrument (EDI)
- pyspedas.projects.cluster.edi(trange: List[str] = ['2018-11-5', '2018-11-6'], probe: str | List[str] = '1', datatype: str = 'pp', prefix: str = '', suffix: str = '', get_support_data: bool = False, varformat: str = None, varnames: List[str] = [], downloadonly: bool = False, notplot: bool = False, no_update: bool = False, time_clip: bool = False, force_download=False) List[str][source]
Load data from the Cluster Electron Drift Instrument
- Parameters:
trange (
listofstr) – time range of interest [starttime, endtime] with the format [‘YYYY-MM-DD’,’YYYY-MM-DD’] or to specify more or less than a day [‘YYYY-MM-DD/hh:mm:ss’,’YYYY-MM-DD/hh:mm:ss’] Default: [‘2018-11-5’, ‘2018-11-6’]probe (
listofstr) – List of probes to load. Valid options: ‘1’,’2’,’3’,’4’ Default: ‘1’datatype (
str) – Data type; Valid options: Default: ‘pp’suffix (
str) – The tplot variable names will be given this suffix. Default: ‘’prefix (
str) – The tplot variable names will be given this prefix. Default: ‘’get_support_data (
bool) – If True, Data with an attribute “VAR_TYPE” with a value of “support_data” will be loaded into tplot.varformat (
str) – The file variable formats to load into tplot. Wildcard character “*” is accepted. If empty or None, all variables will be loaded. Default: None (all variables loaded)varnames (
listofstr) – List of CDF variable names to load (if empty or not specified, all data variables are loaded) Default: [] (all variables loaded)downloadonly (
bool) – Set this flag to download the CDF files, but not load them into tplot variables Default: Falsenotplot (
bool) – Return the data in hash tables instead of creating tplot variables Default: Falseno_update (
bool) – If set, only load data from your local cache Default: Falsetime_clip (
bool) – Time clip the variables to exactly the range specified in the trange keyword Default: Falseforce_download (
bool) – Download file even if local version is more recent than server version Default: False
- Returns:
List of tplot variables created.
- Return type:
Examples
>>> import pyspedas
>>> from pyspedas import tplot
>>> edi_vars = pyspedas.projects.cluster.edi(trange=['2003-11-01','2003-11-02'],probe=['1','2'])
>>> tplot(['V_ed_xyz_gse__C1_PP_EDI','V_ed_xyz_gse__C1_PP_EDI'])
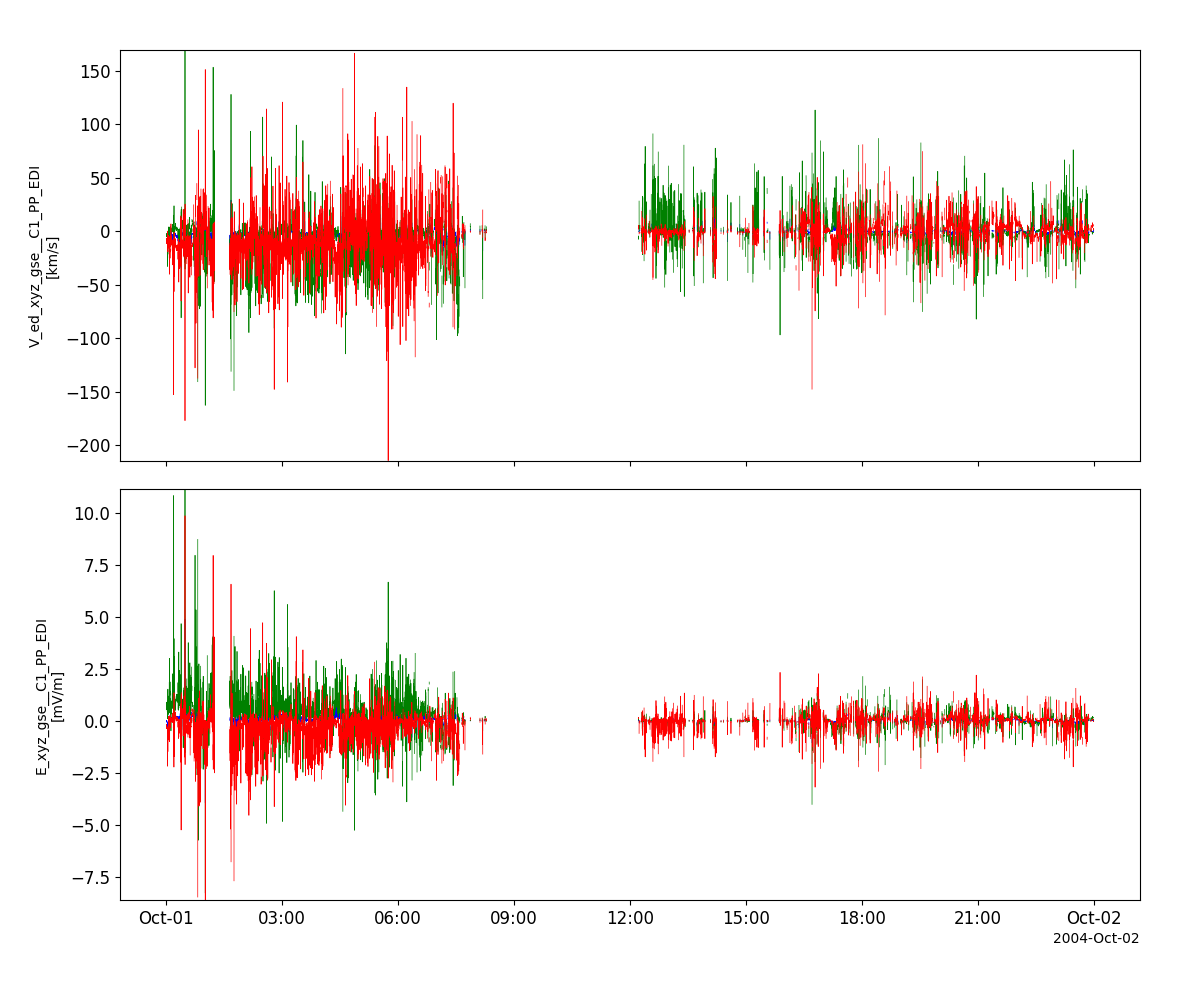
Example
import pyspedas
from pyspedas import tplot
edi_vars = pyspedas.projects.cluster.edi(trange=['2004-10-01', '2004-10-2'])
tplot(['V_ed_xyz_gse__C1_PP_EDI', 'E_xyz_gse__C1_PP_EDI'])
Electric Field and Wave experiment (EFW)
- pyspedas.projects.cluster.efw(trange: List[str] = ['2018-11-5', '2018-11-6'], probe: str | List[str] = '1', datatype: str = 'pp', prefix: str = '', suffix: str = '', get_support_data: bool = False, varformat: str = None, varnames: List[str] = [], downloadonly: bool = False, notplot: bool = False, no_update: bool = False, time_clip: bool = False, force_download=False) List[str][source]
Load data from the Cluster Electric Field and Wave experiment
- Parameters:
trange (
listofstr) – time range of interest [starttime, endtime] with the format [‘YYYY-MM-DD’,’YYYY-MM-DD’] or to specify more or less than a day [‘YYYY-MM-DD/hh:mm:ss’,’YYYY-MM-DD/hh:mm:ss’] Default: [‘2018-11-5’, ‘2018-11-6’]probe (
listofstr) – List of probes to load. Valid options: ‘1’,’2’,’3’,’4’ Default: ‘1’datatype (
str) – Data type; Valid options: Default: ‘up’prefix (
str) – The tplot variable names will be given this prefix. Default: ‘’suffix (
str) – The tplot variable names will be given this suffix. Default: ‘’get_support_data (
bool) – If True, Data with an attribute “VAR_TYPE” with a value of “support_data” will be loaded into tplot.varformat (
str) – The file variable formats to load into tplot. Wildcard character “*” is accepted. If empty or None, all variables will be loaded. Default: None (all variables loaded)varnames (
listofstr) – List of CDF variable names to load (if empty or not specified, all data variables are loaded) Default: [] (all variables loaded)downloadonly (
bool) – Set this flag to download the CDF files, but not load them into tplot variables Default: Falsenotplot (
bool) – Return the data in hash tables instead of creating tplot variables Default: Falseno_update (
bool) – If set, only load data from your local cache Default: Falsetime_clip (
bool) – Time clip the variables to exactly the range specified in the trange keyword Default: Falseforce_download (
bool) – Download file even if local version is more recent than server version Default: False
- Returns:
List of tplot variables created.
- Return type:
Examples
>>> import pyspedas
>>> from pyspedas import tplot
>>> efw_vars = pyspedas.projects.cluster.efw(trange=['2003-11-01','2003-11-02'],probe=['2'])
>>> tplot('E_pow_f1__C2_PP_EFW')
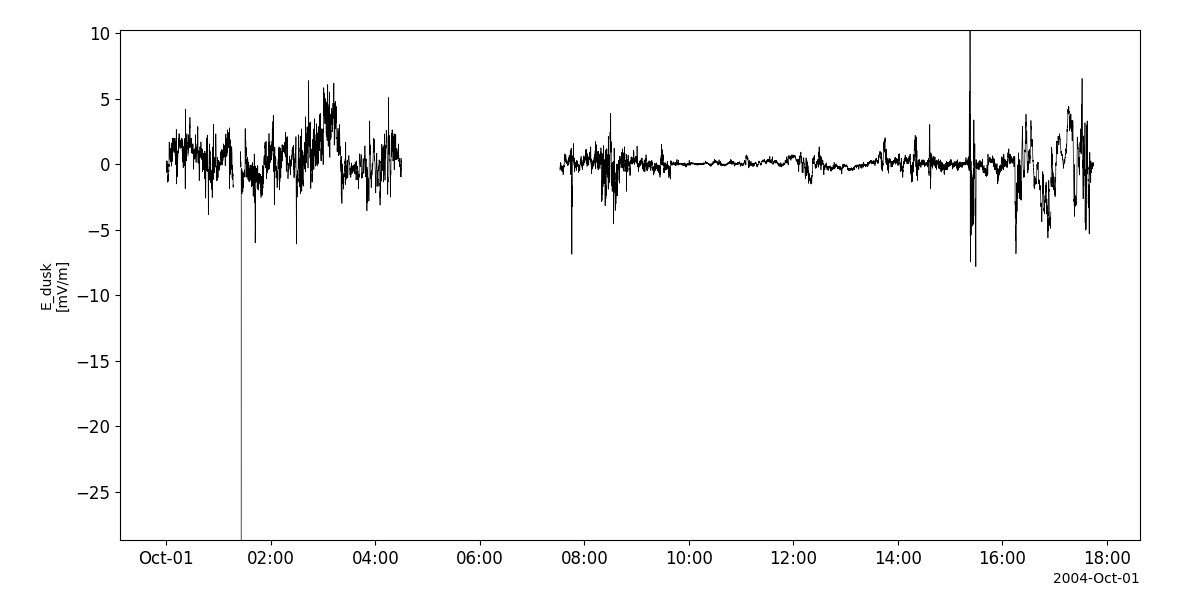
Example
import pyspedas
from pyspedas import tplot
efw_vars = pyspedas.projects.cluster.efw(trange=['2004-10-01', '2004-10-2'])
tplot('E_dusk__C1_PP_EFW')
Plasma Electron and Current Experiment (PEACE)
- pyspedas.projects.cluster.peace(trange: List[str] = ['2016-11-5', '2016-11-6'], probe: str | List[str] = '1', datatype: str = 'pp', prefix: str = '', suffix: str = '', get_support_data: bool = False, varformat: str = None, varnames: List[str] = [], downloadonly: bool = False, notplot: bool = False, no_update: bool = False, time_clip: bool = False, force_download=False) List[str][source]
Load data from the Cluster Plasma Electron and Current Experiment
- Parameters:
trange (
listofstr) – time range of interest [starttime, endtime] with the format [‘YYYY-MM-DD’,’YYYY-MM-DD’] or to specify more or less than a day [‘YYYY-MM-DD/hh:mm:ss’,’YYYY-MM-DD/hh:mm:ss’] Default: [‘2018-11-5’, ‘2018-11-6’]probe (
listofstr) – List of probes to load. Valid options: ‘1’,’2’,’3’,’4’ Default: ‘1’datatype (
str) – Data type; Valid options: Default: ‘up’suffix (
str) – The tplot variable names will be given this suffix. Default: ‘’prefix (
str) – The tplot variable names will be given this prefix. Default: ‘’get_support_data (
bool) – If True, Data with an attribute “VAR_TYPE” with a value of “support_data” will be loaded into tplot.varformat (
str) – The file variable formats to load into tplot. Wildcard character “*” is accepted. If empty or None, all variables will be loaded. Default: None (all variables loaded)varnames (
listofstr) – List of CDF variable names to load (if empty or not specified, all data variables are loaded) Default: [] (all variables loaded)downloadonly (
bool) – Set this flag to download the CDF files, but not load them into tplot variables Default: Falsenotplot (
bool) – Return the data in hash tables instead of creating tplot variables Default: Falseno_update (
bool) – If set, only load data from your local cache Default: Falsetime_clip (
bool) – Time clip the variables to exactly the range specified in the trange keyword Default: Falseforce_download (
bool) – Download file even if local version is more recent than server version Default: False
- Returns:
List of tplot variables created.
- Return type:
Examples
>>> import pyspedas
>>> from pyspedas import tplot
>>> peace_vars = pyspedas.projects.cluster.peace(trange=['2003-11-01','2003-11-02'],probe=['1','2'])
>>> tplot([ 'N_e_den__C1_PP_PEA', 'V_e_xyz_gse__C1_PP_PEA', 'N_e_den__C2_PP_PEA', 'V_e_xyz_gse__C2_PP_PEA'])
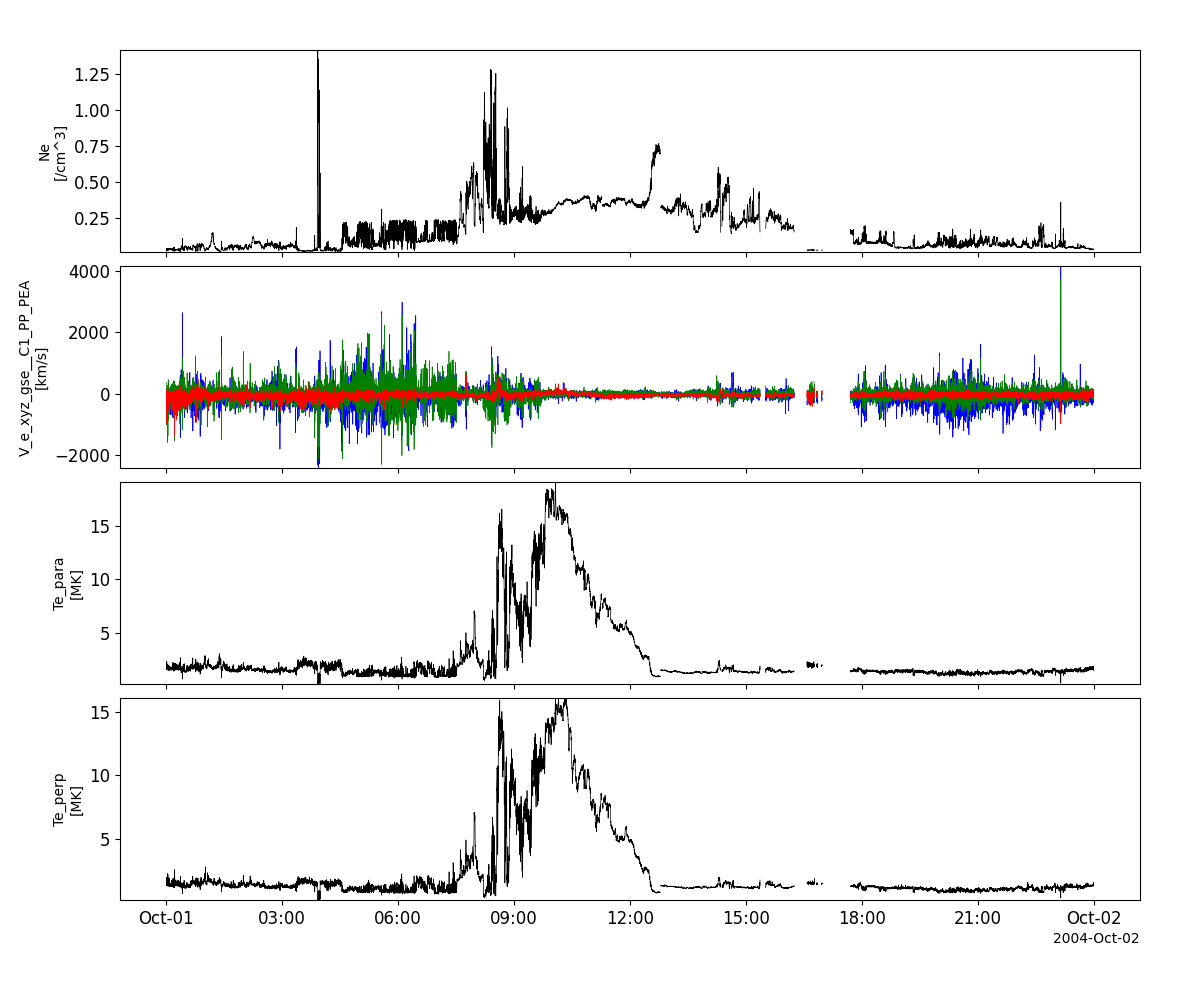
Example
import pyspedas
from pyspedas import tplot
peace_vars = pyspedas.projects.cluster.peace(trange=['2004-10-01', '2004-10-2'])
tplot(['N_e_den__C1_PP_PEA', 'V_e_xyz_gse__C1_PP_PEA', 'T_e_par__C1_PP_PEA', 'T_e_perp__C1_PP_PEA'])
Research with Adaptive Particle Imaging Detectors (RAPID)
- pyspedas.projects.cluster.rapid(trange: List[str] = ['2016-11-5', '2016-11-6'], probe: str | List[str] = '1', datatype: str = 'pp', prefix: str = '', suffix: str = '', get_support_data: bool = False, varformat: str = None, varnames: List[str] = [], downloadonly: bool = False, notplot: bool = False, no_update: bool = False, time_clip: bool = False, force_download=False) List[str][source]
Load data from the Cluster Research with Adaptive Particle Imaging Detectors
- Parameters:
trange (
listofstr) – time range of interest [starttime, endtime] with the format [‘YYYY-MM-DD’,’YYYY-MM-DD’] or to specify more or less than a day [‘YYYY-MM-DD/hh:mm:ss’,’YYYY-MM-DD/hh:mm:ss’] Default: [‘2018-11-5’, ‘2018-11-6’]probe (
listofstr) – List of probes to load. Valid options: ‘1’,’2’,’3’,’4’ Default: ‘1’datatype (
str) – Data type; Valid options: Default: ‘up’prefix (
str) – The tplot variable names will be given this prefix. Default: ‘’suffix (
str) – The tplot variable names will be given this suffix. Default: ‘’get_support_data (
bool) – If True, Data with an attribute “VAR_TYPE” with a value of “support_data” will be loaded into tplot.varformat (
str) – The file variable formats to load into tplot. Wildcard character “*” is accepted. If empty or None, all variables will be loaded. Default: None (all variables loaded)varnames (
listofstr) – List of CDF variable names to load (if empty or not specified, all data variables are loaded) Default: [] (all variables loaded)downloadonly (
bool) – Set this flag to download the CDF files, but not load them into tplot variables Default: Falsenotplot (
bool) – Return the data in hash tables instead of creating tplot variables Default: Falseno_update (
bool) – If set, only load data from your local cache Default: Falsetime_clip (
bool) – Time clip the variables to exactly the range specified in the trange keyword Default: Falseforce_download (
bool) – Download file even if local version is more recent than server version Default: False
- Returns:
List of tplot variables created.
- Return type:
Examples
>>> import pyspedas
>>> from pyspedas import tplot
>>> rapid_vars = pyspedas.projects.cluster.rapid(trange=['2003-11-01','2003-11-02'],probe=['1','2'])
>>> tplot([ 'J_e_lo__C1_PP_RAP', 'J_e_hi__C1_PP_RAP', 'J_e_lo__C2_PP_RAP', 'J_e_hi__C2_PP_RAP'])
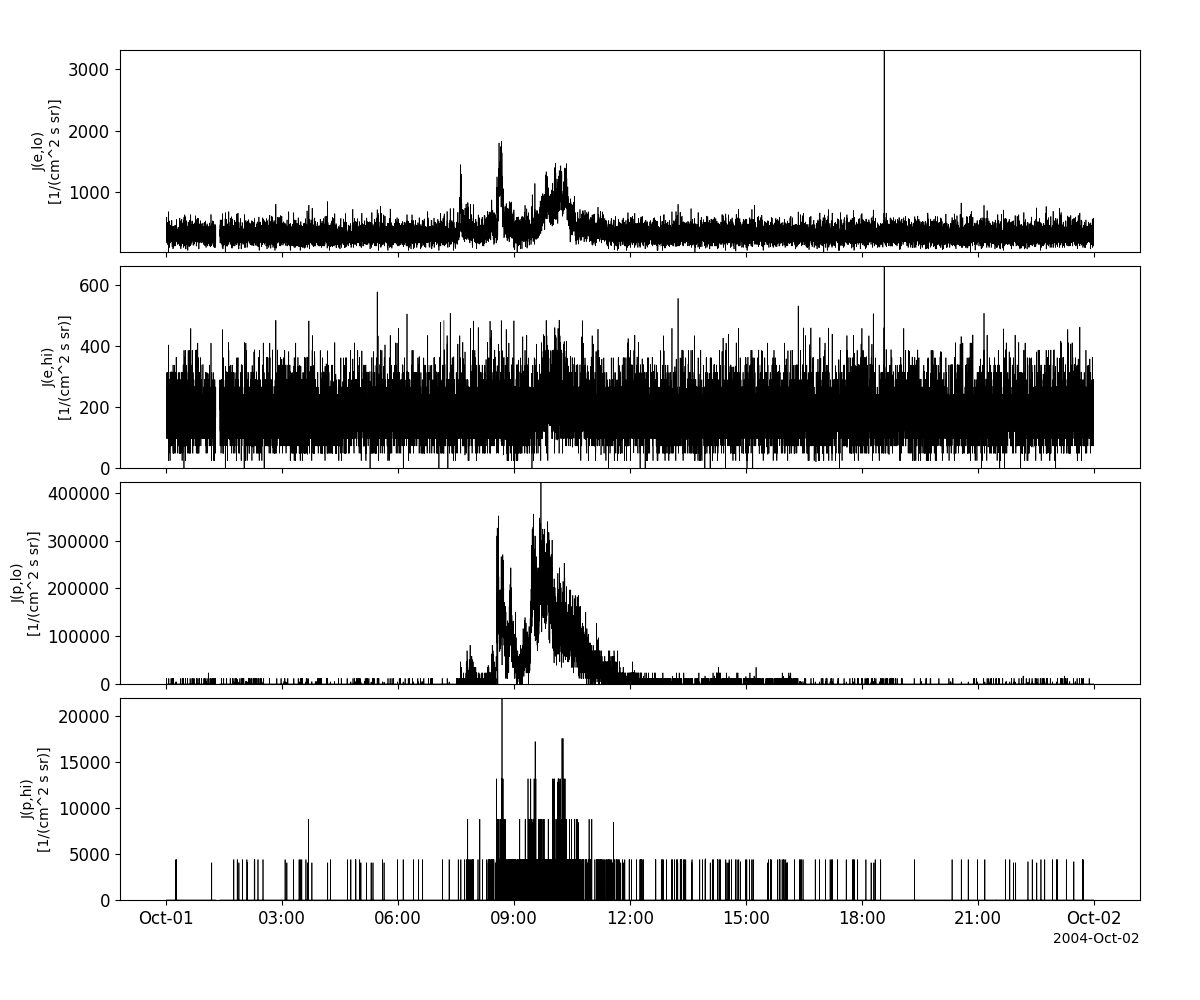
Example
import pyspedas
from pyspedas import tplot
rap_vars = pyspedas.projects.cluster.rapid(trange=['2004-10-01', '2004-10-2'])
tplot(['J_e_lo__C1_PP_RAP', 'J_e_hi__C1_PP_RAP', 'J_p_lo__C1_PP_RAP', 'J_p_hi__C1_PP_RAP'])
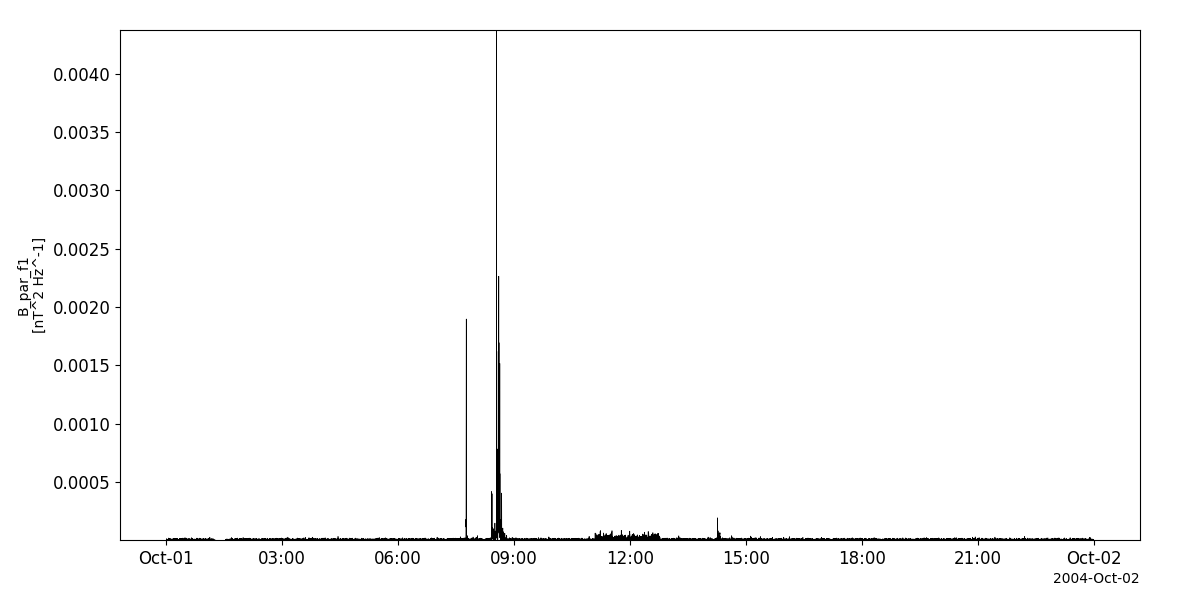
Spatio-Temporal Analysis of Field Fluctuation experiment (STAFF)
- pyspedas.projects.cluster.staff(trange: List[str] = ['2012-11-5', '2012-11-6'], probe: str | List[str] = '1', datatype: str = 'pp', prefix: str = '', suffix: str = '', get_support_data: bool = False, varformat: str = None, varnames: List[str] = [], downloadonly: bool = False, notplot: bool = False, no_update: bool = False, time_clip: bool = False, force_download=False) List[str][source]
Load data from the Cluster Spatio-Temporal Analysis of Field Fluctuation experiment
- Parameters:
trange (
listofstr) – time range of interest [starttime, endtime] with the format [‘YYYY-MM-DD’,’YYYY-MM-DD’] or to specify more or less than a day [‘YYYY-MM-DD/hh:mm:ss’,’YYYY-MM-DD/hh:mm:ss’] Default: [‘2018-11-5’, ‘2018-11-6’]probe (
listofstr) – List of probes to load. Valid options: ‘1’,’2’,’3’,’4’ Default: ‘1’datatype (
str) – Data type; Valid options: Default: ‘pp’prefix (
str) – The tplot variable names will be given this prefix. Default: ‘’suffix (
str) – The tplot variable names will be given this suffix. Default: ‘’get_support_data (
bool) – If True, Data with an attribute “VAR_TYPE” with a value of “support_data” will be loaded into tplot.varformat (
str) – The file variable formats to load into tplot. Wildcard character “*” is accepted. If empty or None, all variables will be loaded. Default: None (all variables loaded)varnames (
listofstr) – List of CDF variable names to load (if empty or not specified, all data variables are loaded) Default: [] (all variables loaded)downloadonly (
bool) – Set this flag to download the CDF files, but not load them into tplot variables Default: Falsenotplot (
bool) – Return the data in hash tables instead of creating tplot variables Default: Falseno_update (
bool) – If set, only load data from your local cache Default: Falsetime_clip (
bool) – Time clip the variables to exactly the range specified in the trange keyword Default: Falseforce_download (
bool) – Download file even if local version is more recent than server version Default: False
- Returns:
List of tplot variables created.
- Return type:
Examples
>>> import pyspedas
>>> from pyspedas import tplot
>>> staff_vars = pyspedas.projects.cluster.staff(trange=['2003-11-01','2003-11-02'],probe=['1','2'])
>>> tplot(['B_par_f1__C1_PP_STA', 'B_perp_f1__C1_PP_STA', 'B_par_f1__C2_PP_STA', 'B_perp_f1__C2_PP_STA'])
Example
import pyspedas
from pyspedas import tplot
sta_vars = pyspedas.projects.cluster.staff(trange=['2004-10-01', '2004-10-02'])
tplot('B_par_f1__C1_PP_STA')
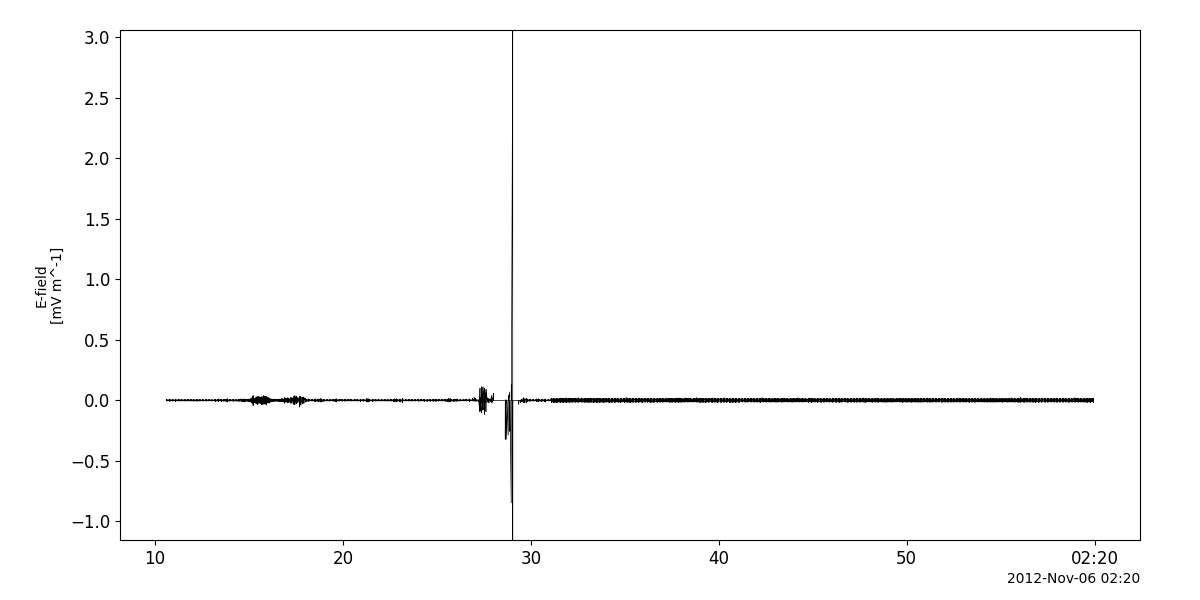
Wide Band Data receiver (WBD)
- pyspedas.projects.cluster.wbd(trange: List[str] = ['2003-11-01/14:00:00', '2003-11-01/14:05:00'], probe: str | List[str] = '1', datatype: str = 'waveform', prefix: str = '', suffix: str = '', get_support_data: bool = False, varformat: str = None, varnames: List[str] = [], downloadonly: bool = False, notplot: bool = False, no_update: bool = False, time_clip: bool = False, force_download=False) List[str][source]
Load data from the Cluster Wide Band Data receiver
- Parameters:
trange (
listofstr) – time range of interest [starttime, endtime] with the format [‘YYYY-MM-DD’,’YYYY-MM-DD’] or to specify more or less than a day [‘YYYY-MM-DD/hh:mm:ss’,’YYYY-MM-DD/hh:mm:ss’] Default: [‘2003-11-01/14:00:00’,’2003-11-01/14:05:00’]probe (
listofstr) – List of probes to load. Valid options: ‘1’,’2’,’3’,’4’ Default: ‘1’datatype (
str) – Data type; Valid options: Default: ‘waveform’prefix (
str) – The tplot variable names will be given this prefix. Default: ‘’suffix (
str) – The tplot variable names will be given this suffix. Default: ‘’get_support_data (
bool) – If True, Data with an attribute “VAR_TYPE” with a value of “support_data” will be loaded into tplot.varformat (
str) – The file variable formats to load into tplot. Wildcard character “*” is accepted. If empty or None, all variables will be loaded. Default: None (all variables loaded)varnames (
listofstr) – List of CDF variable names to load (if empty or not specified, all data variables are loaded) Default: [] (all variables loaded)downloadonly (
bool) – Set this flag to download the CDF files, but not load them into tplot variables Default: Falsenotplot (
bool) – Return the data in hash tables instead of creating tplot variables Default: Falseno_update (
bool) – If set, only load data from your local cache Default: Falsetime_clip (
bool) – Time clip the variables to exactly the range specified in the trange keyword Default: Falseforce_download (
bool) – Download file even if local version is more recent than server version Default: False
- Returns:
List of tplot variables created.
- Return type:
Examples
>>> import pyspedas
>>> from pyspedas import tplot
>>> wbd_vars = pyspedas.projects.cluster.wbd(trange=['2003-11-01/14:00:00','2003-11-01/14:05:00'],probe=['1'])
>>> # Note lack of probe IDs in the variables loaded -- only load one probe at a time
>>> tplot('WBD_Elec')
Example
import pyspedas
from pyspedas import tplot
wbd_vars = pyspedas.projects.cluster.wbd(trange=['2012-11-06/02:10', '2012-11-06/02:20'])
tplot('WBD_Elec')
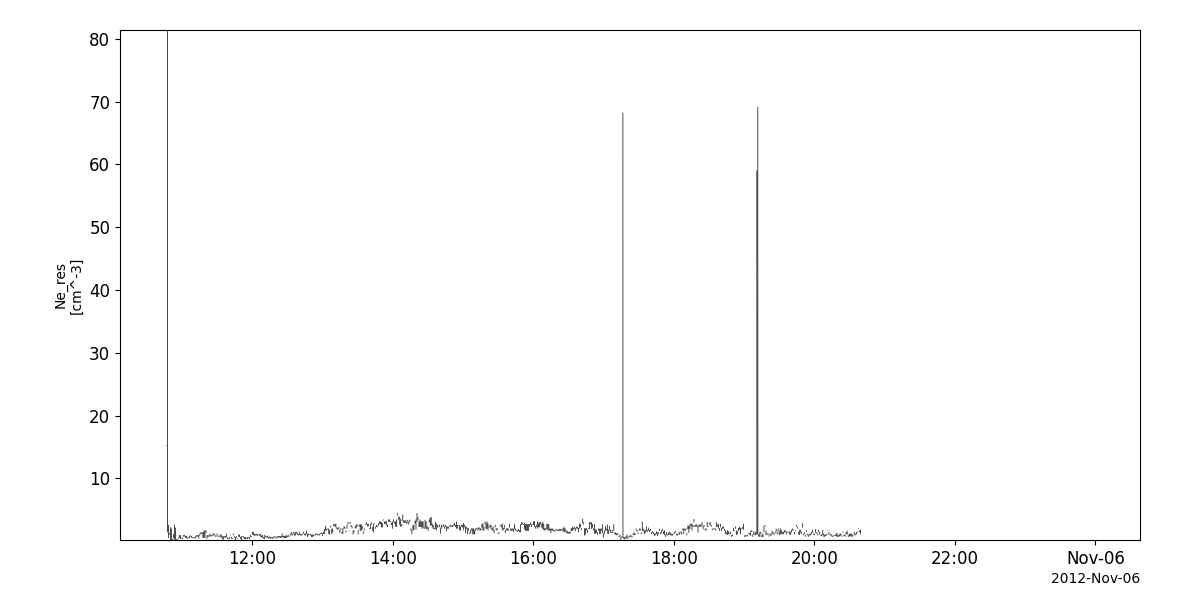
Waves of High Frequency and Sounder for Probing of Density by Relaxation (WHISPER)
- pyspedas.projects.cluster.whi(trange: List[str] = ['2012-11-5', '2012-11-6'], probe: str | List[str] = '1', datatype: str = 'pp', prefix: str = '', suffix: str = '', get_support_data: bool = False, varformat: str = None, varnames: List[str] = [], downloadonly: bool = False, notplot: bool = False, no_update: bool = False, time_clip: bool = False, force_download=False) List[str][source]
Load data from the Cluster Waves of High Frequency and Sounder for Probing of Density by Relaxation instrument
- Parameters:
trange (
listofstr) – time range of interest [starttime, endtime] with the format [‘YYYY-MM-DD’,’YYYY-MM-DD’] or to specify more or less than a day [‘YYYY-MM-DD/hh:mm:ss’,’YYYY-MM-DD/hh:mm:ss’] Default: [‘2018-11-5’, ‘2018-11-6’]probe (
listofstr) – List of probes to load. Valid options: ‘1’,’2’,’3’,’4’ Default: ‘1’datatype (
str) – Data type; Valid options: Default: ‘pp’prefix (
str) – The tplot variable names will be given this prefix. Default: ‘’suffix (
str) – The tplot variable names will be given this suffix. Default: ‘’get_support_data (
bool) – If True, Data with an attribute “VAR_TYPE” with a value of “support_data” will be loaded into tplot.varformat (
str) – The file variable formats to load into tplot. Wildcard character “*” is accepted. If empty or None, all variables will be loaded. Default: None (all variables loaded)varnames (
listofstr) – List of CDF variable names to load (if empty or not specified, all data variables are loaded) Default: [] (all variables loaded)downloadonly (
bool) – Set this flag to download the CDF files, but not load them into tplot variables Default: Falsenotplot (
bool) – Return the data in hash tables instead of creating tplot variables Default: Falseno_update (
bool) – If set, only load data from your local cache Default: Falsetime_clip (
bool) – Time clip the variables to exactly the range specified in the trange keyword Default: Falseforce_download (
bool) – Download file even if local version is more recent than server version Default: False
- Returns:
List of tplot variables created.
- Return type:
Examples
>>> import pyspedas
>>> from pyspedas import tplot
>>> whi_vars = pyspedas.projects.cluster.whi(trange=['2003-11-01','2003-11-02'],probe=['1','2'])
>>> tplot(['N_e_res__C1_PP_WHI','E_pow_f4__C1_PP_WHI','N_e_res__C2_PP_WHI','E_pow_f4__C2_PP_WHI'])
Example
import pyspedas
from pyspedas import tplot
whi_vars = pyspedas.projects.cluster.whi()
tplot('N_e_res__C1_PP_WHI')
Load Data from Cluster Science Archive
The above routines load data from NASA’s SPDF archive. There is also a way to download Cluster data products directly from ESA’s Cluster Science Archive.
- pyspedas.projects.cluster.load_csa(trange: List[str] = ['2001-02-01', '2001-02-03'], probes: List[str] = ['C1'], datatypes: List[str] = ['CP_CIS-CODIF_HS_H1_MOMENTS'], downloadonly: bool = False, time_clip: bool = True, prefix: str = '', suffix: str = '', get_support_data: bool = False, varformat: str = None, varnames: List[str] = [], notplot: bool = False) List[str][source]
Load data using the Cluster Science Data archive.
- Parameters:
trange (
listofstr) – Time range [start, end]. Default: [‘2001-02-01’, ‘2001-02-03’]probes (
listofstr) – List of Cluster probes. Valid options: ‘C1’,’C2’,’C3’,’C4’, ‘*’ to load all probes Default: [‘C1’]-
- List of Cluster data types. Valid options::
‘CE_WBD_WAVEFORM_CDF’, ‘CP_AUX_POSGSE_1M’, ‘CP_CIS-CODIF_HS_H1_MOMENTS’, ‘CP_CIS-CODIF_HS_He1_MOMENTS’, ‘CP_CIS-CODIF_HS_O1_MOMENTS’, ‘CP_CIS-CODIF_PAD_HS_H1_PF’, ‘CP_CIS-CODIF_PAD_HS_He1_PF’, ‘CP_CIS-CODIF_PAD_HS_O1_PF’, ‘CP_CIS-HIA_ONBOARD_MOMENTS’, ‘CP_CIS-HIA_PAD_HS_MAG_IONS_PF’, ‘CP_EDI_AEDC’, ‘CP_EDI_MP’, ‘CP_EDI_SPIN’, ‘CP_EFW_L2_E3D_INERT’, ‘CP_EFW_L2_P’, ‘CP_EFW_L2_V3D_INERT’, ‘CP_EFW_L3_E3D_INERT’, ‘CP_EFW_L3_P’, ‘CP_EFW_L3_V3D_INERT’, ‘CP_FGM_5VPS’, ‘CP_FGM_FULL’, ‘CP_FGM_SPIN’, ‘CP_PEA_MOMENTS’, ‘CP_PEA_PITCH_SPIN_DEFlux’, ‘CP_PEA_PITCH_SPIN_DPFlux’, ‘CP_PEA_PITCH_SPIN_PSD’, ‘CP_RAP_ESPCT6’, ‘CP_RAP_ESPCT6_R’, ‘CP_RAP_HSPCT’, ‘CP_RAP_HSPCT_R’, ‘CP_RAP_ISPCT_CNO’, ‘CP_RAP_ISPCT_He’, ‘CP_STA_CS_HBR’, ‘CP_STA_CS_NBR’, ‘CP_STA_CWF_GSE’, ‘CP_STA_CWF_HBR_ISR2’, ‘CP_STA_CWF_NBR_ISR2’, ‘CP_STA_PSD’, ‘CP_WBD_WAVEFORM’, ‘CP_WHI_ELECTRON_DENSITY’, ‘CP_WHI_NATURAL’, ‘JP_AUX_PMP’, ‘JP_AUX_PSE’
Default: [‘CP_CIS-CODIF_HS_H1_MOMENTS’]
downloadonly (
bool) – If true, do not use cdf_to_tplot. Default: Falsetime_clip (
bool) – If true, apply time clip to data. Default: Falsesuffix (
str) – The tplot variable names will be given this suffix. Default: ‘’get_support_data (
bool) – If True, data with an attribute “VAR_TYPE” with a value of “support_data” will be loaded into tplot. Default: Falsevarformat (
str) – The file variable formats to load into tplot. Wildcard character “*” is accepted. Default: None (all variables will be loaded)varnames (
strorlistofstr) – Load these variables only. If [] or [‘*’], then load everything. Default: []notplot (
bool) – If True, then data are returned in a hash table instead of being stored in tplot variables (useful for debugging, and access to multi-dimensional data products) Default: False
- Returns:
List of tplot variables created (unless notplot keyword is used).
- Return type:
Examples
>>> import pyspedas
>>> from pyspedas import tplot
>>> fgm_vars = pyspedas.projects.cluster.load_csa(trange=['2008-11-01','2008-11-02'],datatypes=['CP_FGM_FULL'])
>>> tplot(['B_vec_xyz_gse__C1_CP_FGM_FULL','B_mag__C1_CP_FGM_FULL'])