Polar
The routines in this module can be used to load data from the Polar mission.
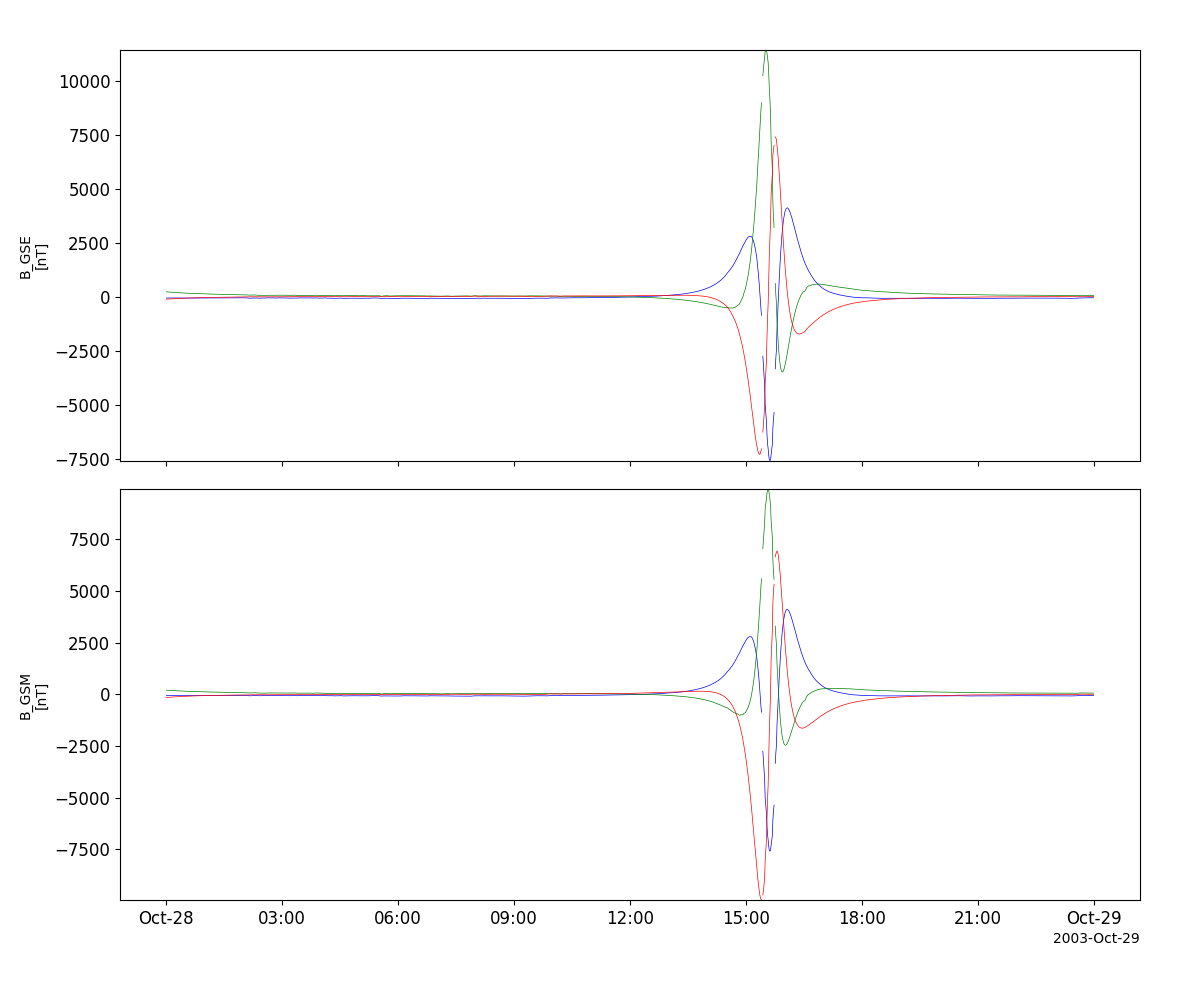
Magnetic Field Experiment (MFE)
- pyspedas.projects.polar.mfe(trange=['2003-10-28', '2003-10-29'], datatype='k0', suffix='', prefix='', get_support_data=False, varformat=None, varnames=[], downloadonly=False, notplot=False, no_update=False, time_clip=False, force_download=False)[source]
This function loads data from the Magnetic Field Experiment
- Parameters:
trange (
listofstr) – time range of interest [starttime, endtime] with the format ‘YYYY-MM-DD’,’YYYY-MM-DD’] or to specify more or less than a day [‘YYYY-MM-DD/hh:mm:ss’,’YYYY-MM-DD/hh:mm:ss’]datatype (
str) – Data type; Valid options:suffix (
str) – The tplot variable names will be given this suffix. By default, no prefix is added. Default: ‘’prefix (
str) – The tplot variable names will be given this prefix. By default, no prefix is added. Default: ‘’get_support_data (
bool) – Data with an attribute “VAR_TYPE” with a value of “support_data” will be loaded into tplot. By default, only loads in data with a “VAR_TYPE” attribute of “data”.varformat (
str) – The file variable formats to load into tplot. Wildcard character “*” is accepted. By default, all variables are loaded in.varnames (
listofstr) – List of variable names to load (if not specified, all data variables are loaded)downloadonly (
bool) – Set this flag to download the CDF files, but not load them into tplot variablesnotplot (
bool) – Return the data in hash tables instead of creating tplot variablesno_update (
bool) – If set, only load data from your local cachetime_clip (
bool) – Time clip the variables to exactly the range specified in the trange keywordforce_download (
bool) – If True, downloads the file even if a newer version exists locally. Default: False.
- Return type:
Listoftplot variables created.
Example
import pyspedas
from pyspedas import tplot
mfe_vars = pyspedas.projects.polar.mfe(trange=['2003-10-28', '2003-10-29'])
tplot(['B_GSE', 'B_GSM'])
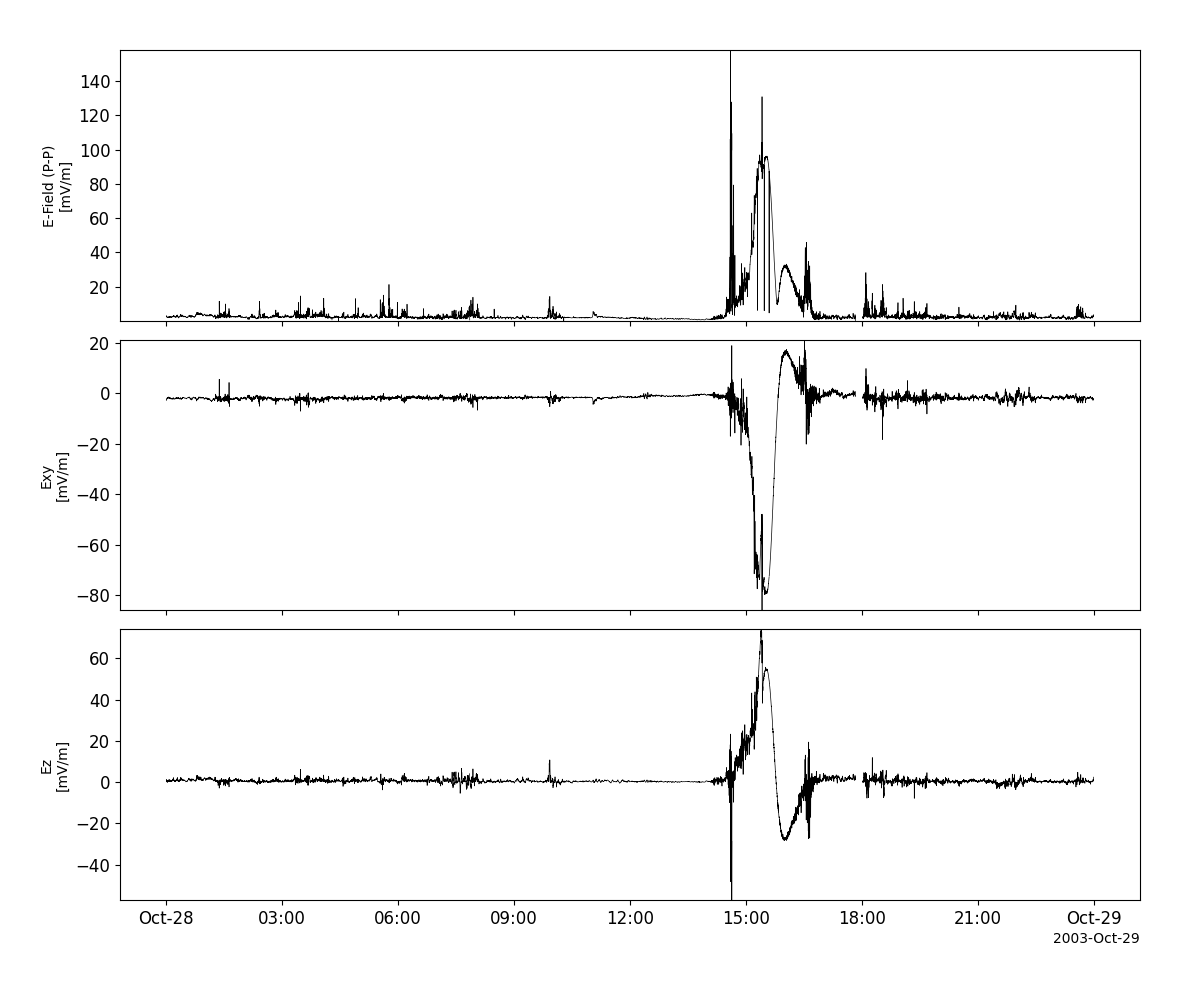
Electric Fields Instrument (EFI)
- pyspedas.projects.polar.efi(trange=['2003-10-28', '2003-10-29'], datatype='k0', suffix='', prefix='', get_support_data=False, varformat=None, varnames=[], downloadonly=False, notplot=False, no_update=False, time_clip=False, force_download=False)[source]
This function loads data from the Electric Fields Instrument
- Parameters:
trange (
listofstr) – time range of interest [starttime, endtime] with the format ‘YYYY-MM-DD’,’YYYY-MM-DD’] or to specify more or less than a day [‘YYYY-MM-DD/hh:mm:ss’,’YYYY-MM-DD/hh:mm:ss’]datatype (
str) – Data type; Valid options:suffix (
str) – The tplot variable names will be given this suffix. By default, no prefix is added. Default: ‘’prefix (
str) – The tplot variable names will be given this prefix. By default, no prefix is added. Default: ‘’get_support_data (
bool) – Data with an attribute “VAR_TYPE” with a value of “support_data” will be loaded into tplot. By default, only loads in data with a “VAR_TYPE” attribute of “data”.varformat (
str) – The file variable formats to load into tplot. Wildcard character “*” is accepted. By default, all variables are loaded in.varnames (
listofstr) – List of variable names to load (if not specified, all data variables are loaded)downloadonly (
bool) – Set this flag to download the CDF files, but not load them into tplot variablesnotplot (
bool) – Return the data in hash tables instead of creating tplot variablesno_update (
bool) – If set, only load data from your local cachetime_clip (
bool) – Time clip the variables to exactly the range specified in the trange keywordforce_download (
bool) – If True, downloads the file even if a newer version exists locally. Default: False.
- Return type:
Listoftplot variables created.
Example
import pyspedas
from pyspedas import tplot
efi_vars = pyspedas.projects.polar.efi(trange=['2003-10-28', '2003-10-29'])
tplot(['ESPIN', 'EXY12G', 'EZ12G'])
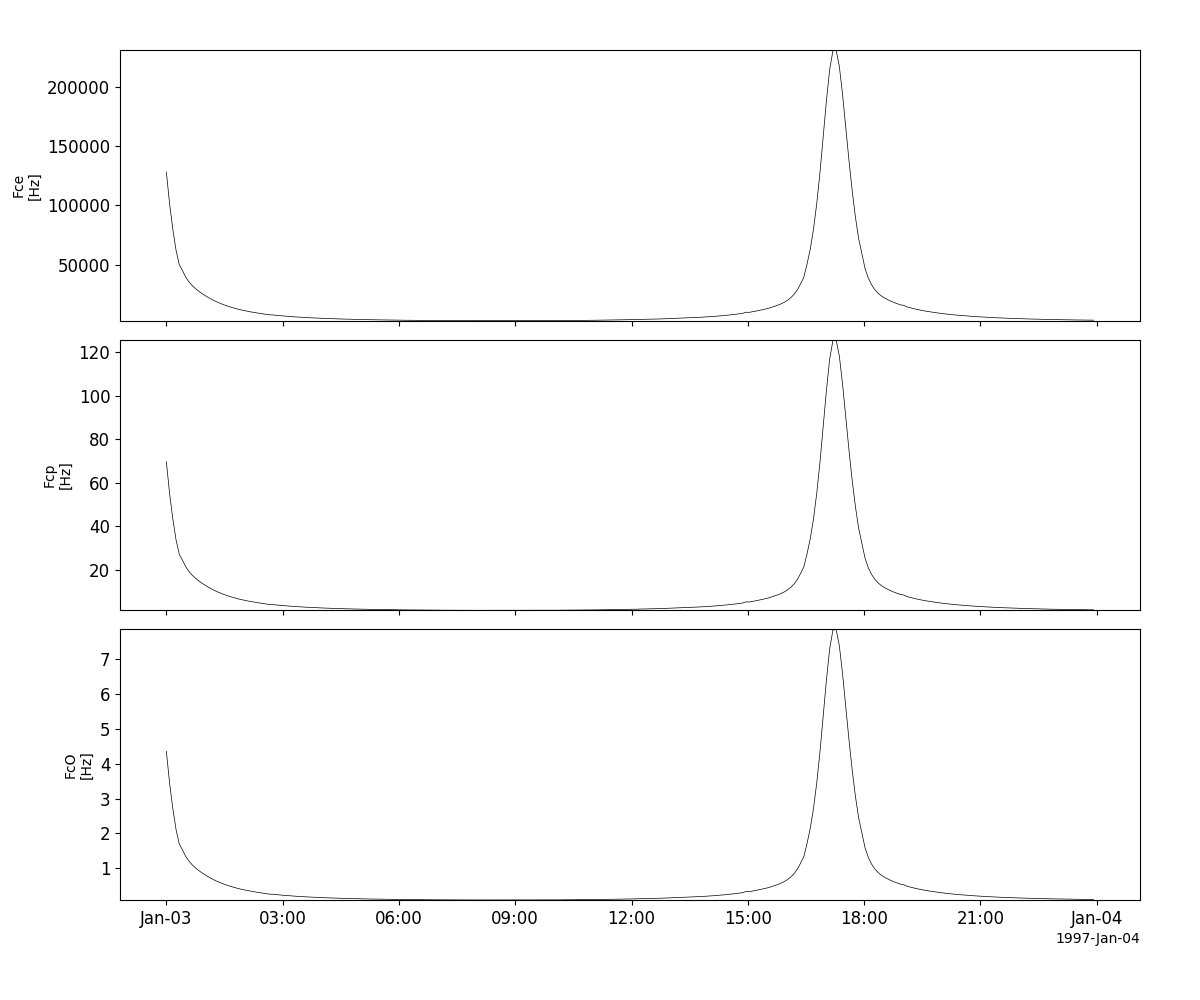
Plasma Wave Instrument (PWI)
- pyspedas.projects.polar.pwi(trange=['1997-01-03', '1997-01-04'], datatype='k0', suffix='', prefix='', get_support_data=False, varformat=None, varnames=[], downloadonly=False, notplot=False, no_update=False, time_clip=False, force_download=False)[source]
This function loads data from the Plasma Wave Instrument
- Parameters:
trange (
listofstr) – time range of interest [starttime, endtime] with the format ‘YYYY-MM-DD’,’YYYY-MM-DD’] or to specify more or less than a day [‘YYYY-MM-DD/hh:mm:ss’,’YYYY-MM-DD/hh:mm:ss’]datatype (
str) – Data type; Valid options:suffix (
str) – The tplot variable names will be given this suffix. By default, no prefix is added. Default: ‘’prefix (
str) – The tplot variable names will be given this prefix. By default, no prefix is added. Default: ‘’get_support_data (
bool) – Data with an attribute “VAR_TYPE” with a value of “support_data” will be loaded into tplot. By default, only loads in data with a “VAR_TYPE” attribute of “data”.varformat (
str) – The file variable formats to load into tplot. Wildcard character “*” is accepted. By default, all variables are loaded in.varnames (
listofstr) – List of variable names to load (if not specified, all data variables are loaded)downloadonly (
bool) – Set this flag to download the CDF files, but not load them into tplot variablesnotplot (
bool) – Return the data in hash tables instead of creating tplot variablesno_update (
bool) – If set, only load data from your local cachetime_clip (
bool) – Time clip the variables to exactly the range specified in the trange keywordforce_download (
bool) – If True, downloads the file even if a newer version exists locally. Default: False.
- Return type:
Listoftplot variables created.
Example
import pyspedas
from pyspedas import tplot
pwi_vars = pyspedas.projects.polar.pwi()
tplot(['Fce', 'Fcp', 'FcO'])
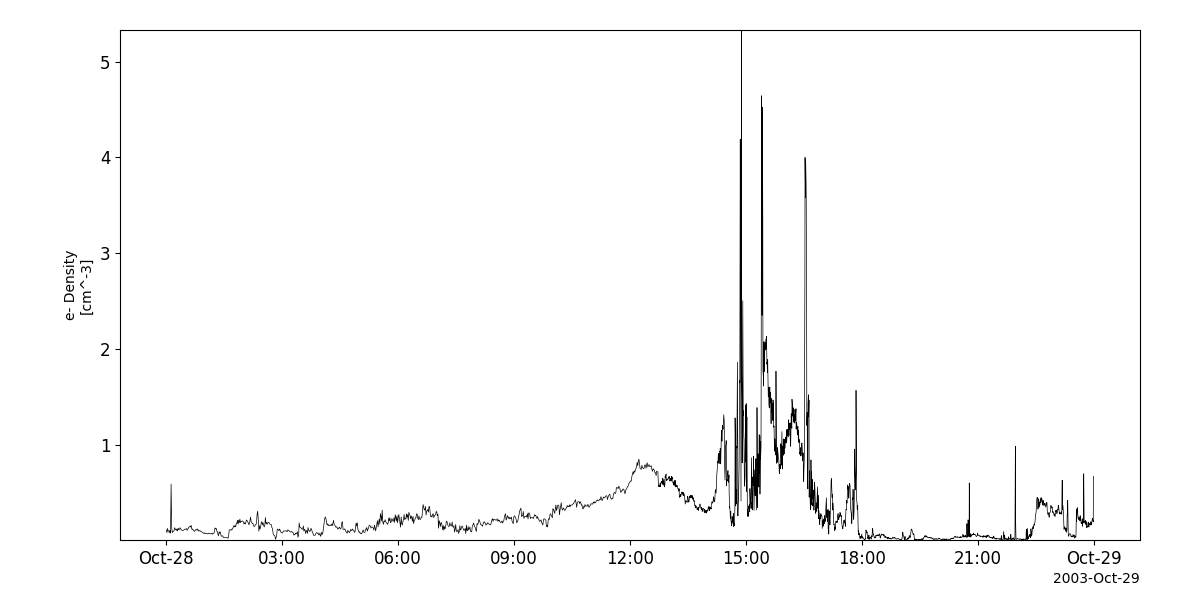
Hot Plasma Analyzer Experiment (HYDRA)
- pyspedas.projects.polar.hydra(trange=['2003-10-28', '2003-10-29'], datatype='k0', suffix='', prefix='', get_support_data=False, varformat=None, varnames=[], downloadonly=False, notplot=False, no_update=False, time_clip=False, force_download=False)[source]
This function loads data from the Hot Plasma Analyzer Experiment
- Parameters:
trange (
listofstr) – time range of interest [starttime, endtime] with the format ‘YYYY-MM-DD’,’YYYY-MM-DD’] or to specify more or less than a day [‘YYYY-MM-DD/hh:mm:ss’,’YYYY-MM-DD/hh:mm:ss’]datatype (
str) – Data type; Valid options:suffix (
str) – The tplot variable names will be given this suffix. By default, no prefix is added. Default: ‘’prefix (
str) – The tplot variable names will be given this prefix. By default, no prefix is added. Default: ‘’get_support_data (
bool) – Data with an attribute “VAR_TYPE” with a value of “support_data” will be loaded into tplot. By default, only loads in data with a “VAR_TYPE” attribute of “data”.varformat (
str) – The file variable formats to load into tplot. Wildcard character “*” is accepted. By default, all variables are loaded in.varnames (
listofstr) – List of variable names to load (if not specified, all data variables are loaded)downloadonly (
bool) – Set this flag to download the CDF files, but not load them into tplot variablesnotplot (
bool) – Return the data in hash tables instead of creating tplot variablesno_update (
bool) – If set, only load data from your local cachetime_clip (
bool) – Time clip the variables to exactly the range specified in the trange keywordforce_download (
bool) – If True, downloads the file even if a newer version exists locally. Default: False.
- Return type:
Listoftplot variables created.
Example
import pyspedas
from pyspedas import tplot
hydra_vars = pyspedas.projects.polar.hydra(trange=['2003-10-28', '2003-10-29'])
tplot('ELE_DENSITY')
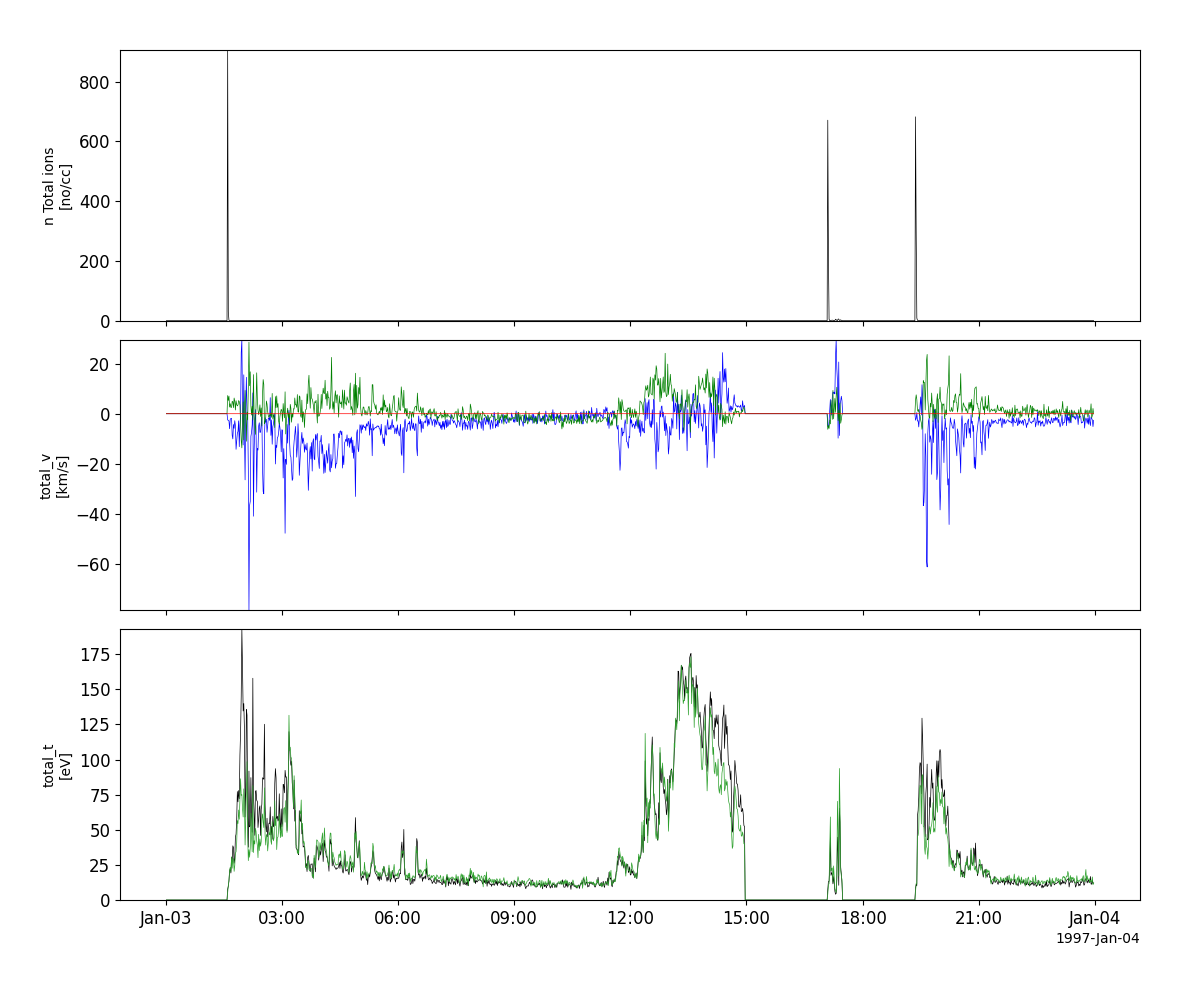
Thermal Ion Dynamics Experiment (TIDE)
- pyspedas.projects.polar.tide(trange=['1997-01-03', '1997-01-04'], datatype='k0', suffix='', prefix='', get_support_data=False, varformat=None, varnames=[], downloadonly=False, notplot=False, no_update=False, time_clip=False, force_download=False)[source]
This function loads data from the Thermal Ion Dynamics Experiment / Plasma Source Investigation
- Parameters:
trange (
listofstr) – time range of interest [starttime, endtime] with the format ‘YYYY-MM-DD’,’YYYY-MM-DD’] or to specify more or less than a day [‘YYYY-MM-DD/hh:mm:ss’,’YYYY-MM-DD/hh:mm:ss’]datatype (
str) – Data type; Valid options:suffix (
str) – The tplot variable names will be given this suffix. By default, no prefix is added. Default: ‘’prefix (
str) – The tplot variable names will be given this prefix. By default, no prefix is added. Default: ‘’get_support_data (
bool) – Data with an attribute “VAR_TYPE” with a value of “support_data” will be loaded into tplot. By default, only loads in data with a “VAR_TYPE” attribute of “data”.varformat (
str) – The file variable formats to load into tplot. Wildcard character “*” is accepted. By default, all variables are loaded in.varnames (
listofstr) – List of variable names to load (if not specified, all data variables are loaded)downloadonly (
bool) – Set this flag to download the CDF files, but not load them into tplot variablesnotplot (
bool) – Return the data in hash tables instead of creating tplot variablesno_update (
bool) – If set, only load data from your local cachetime_clip (
bool) – Time clip the variables to exactly the range specified in the trange keywordforce_download (
bool) – If True, downloads the file even if a newer version exists locally. Default: False.
- Return type:
Listoftplot variables created.
Example
import pyspedas
from pyspedas import tplot
tide_vars = pyspedas.projects.polar.tide()
tplot(['total_den', 'total_v', 'total_t'])
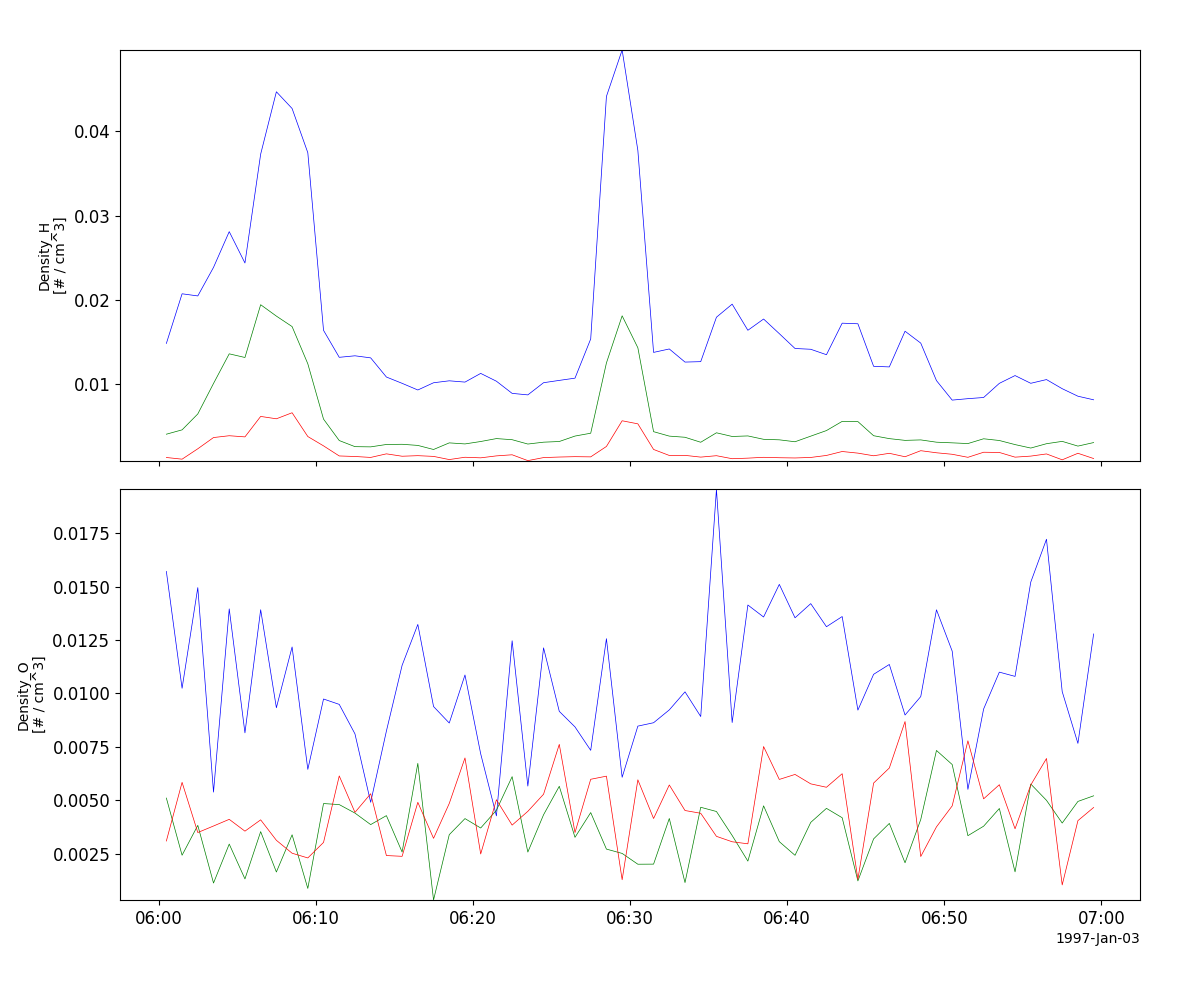
Toroidal Imaging Mass Angle Spectrograph (TIMAS)
- pyspedas.projects.polar.timas(trange=['1997-01-03', '1997-01-04'], datatype='k0', suffix='', prefix='', get_support_data=False, varformat=None, varnames=[], downloadonly=False, notplot=False, no_update=False, time_clip=False, force_download=False)[source]
This function loads data from the Toroidal Imaging Mass Angle Spectrograph
- Parameters:
trange (
listofstr) – time range of interest [starttime, endtime] with the format ‘YYYY-MM-DD’,’YYYY-MM-DD’] or to specify more or less than a day [‘YYYY-MM-DD/hh:mm:ss’,’YYYY-MM-DD/hh:mm:ss’]datatype (
str) – Data type; Valid options:suffix (
str) – The tplot variable names will be given this suffix. By default, no prefix is added. Default: ‘’prefix (
str) – The tplot variable names will be given this prefix. By default, no prefix is added. Default: ‘’get_support_data (
bool) – Data with an attribute “VAR_TYPE” with a value of “support_data” will be loaded into tplot. By default, only loads in data with a “VAR_TYPE” attribute of “data”.varformat (
str) – The file variable formats to load into tplot. Wildcard character “*” is accepted. By default, all variables are loaded in.varnames (
listofstr) – List of variable names to load (if not specified, all data variables are loaded)downloadonly (
bool) – Set this flag to download the CDF files, but not load them into tplot variablesnotplot (
bool) – Return the data in hash tables instead of creating tplot variablesno_update (
bool) – If set, only load data from your local cachetime_clip (
bool) – Time clip the variables to exactly the range specified in the trange keywordforce_download (
bool) – If True, downloads the file even if a newer version exists locally. Default: False.
- Return type:
Listoftplot variables created.
Example
import pyspedas
from pyspedas import tplot
timas_vars = pyspedas.projects.polar.timas(trange=['1997-01-03/6:00', '1997-01-03/7:00'], time_clip=True)
tplot(['Density_H', 'Density_O'])
Charge and Mass Magnetospheric Ion Composition Experiment (CAMMICE)
- pyspedas.projects.polar.cammice(trange=['2003-10-28', '2003-10-29'], datatype='k0', suffix='', prefix='', get_support_data=False, varformat=None, varnames=[], downloadonly=False, notplot=False, no_update=False, time_clip=False, force_download=False)[source]
This function loads data from the Charge and Mass Magnetospheric Ion Composition Experiment
- Parameters:
trange (
listofstr) – time range of interest [starttime, endtime] with the format ‘YYYY-MM-DD’,’YYYY-MM-DD’] or to specify more or less than a day [‘YYYY-MM-DD/hh:mm:ss’,’YYYY-MM-DD/hh:mm:ss’]datatype (
str) – Data type; Valid options:suffix (
str) – The tplot variable names will be given this suffix. By default, no prefix is added. Default: ‘’prefix (
str) – The tplot variable names will be given this prefix. By default, no prefix is added. Default: ‘’get_support_data (
bool) – Data with an attribute “VAR_TYPE” with a value of “support_data” will be loaded into tplot. By default, only loads in data with a “VAR_TYPE” attribute of “data”.varformat (
str) – The file variable formats to load into tplot. Wildcard character “*” is accepted. By default, all variables are loaded in.varnames (
listofstr) – List of variable names to load (if not specified, all data variables are loaded)downloadonly (
bool) – Set this flag to download the CDF files, but not load them into tplot variablesnotplot (
bool) – Return the data in hash tables instead of creating tplot variablesno_update (
bool) – If set, only load data from your local cachetime_clip (
bool) – Time clip the variables to exactly the range specified in the trange keywordforce_download (
bool) – If True, downloads the file even if a newer version exists locally. Default: False.
- Return type:
Listoftplot variables created.
Example
import pyspedas
from pyspedas import tplot
cammice_vars = pyspedas.projects.polar.cammice(trange=['2003-10-28', '2003-10-29'])
tplot('Protons')
Comprehensive Energetic Particle-Pitch Angle Distribution (CEPPAD)
- pyspedas.projects.polar.ceppad(trange=['2003-10-28', '2003-10-29'], datatype='k0', suffix='', prefix='', get_support_data=False, varformat=None, varnames=[], downloadonly=False, notplot=False, no_update=False, time_clip=False, force_download=False)[source]
This function loads data from the Comprehensive Energetic Particle-Pitch Angle Distribution
- Parameters:
trange (
listofstr) – time range of interest [starttime, endtime] with the format ‘YYYY-MM-DD’,’YYYY-MM-DD’] or to specify more or less than a day [‘YYYY-MM-DD/hh:mm:ss’,’YYYY-MM-DD/hh:mm:ss’]datatype (
str) – Data type; Valid options:suffix (
str) – The tplot variable names will be given this suffix. By default, no prefix is added. Default: ‘’prefix (
str) – The tplot variable names will be given this prefix. By default, no prefix is added. Default: ‘’get_support_data (
bool) – Data with an attribute “VAR_TYPE” with a value of “support_data” will be loaded into tplot. By default, only loads in data with a “VAR_TYPE” attribute of “data”.varformat (
str) – The file variable formats to load into tplot. Wildcard character “*” is accepted. By default, all variables are loaded in.varnames (
listofstr) – List of variable names to load (if not specified, all data variables are loaded)downloadonly (
bool) – Set this flag to download the CDF files, but not load them into tplot variablesnotplot (
bool) – Return the data in hash tables instead of creating tplot variablesno_update (
bool) – If set, only load data from your local cachetime_clip (
bool) – Time clip the variables to exactly the range specified in the trange keywordforce_download (
bool) – If True, downloads the file even if a newer version exists locally. Default: False.
- Return type:
Listoftplot variables created.
Example
import pyspedas
from pyspedas import tplot
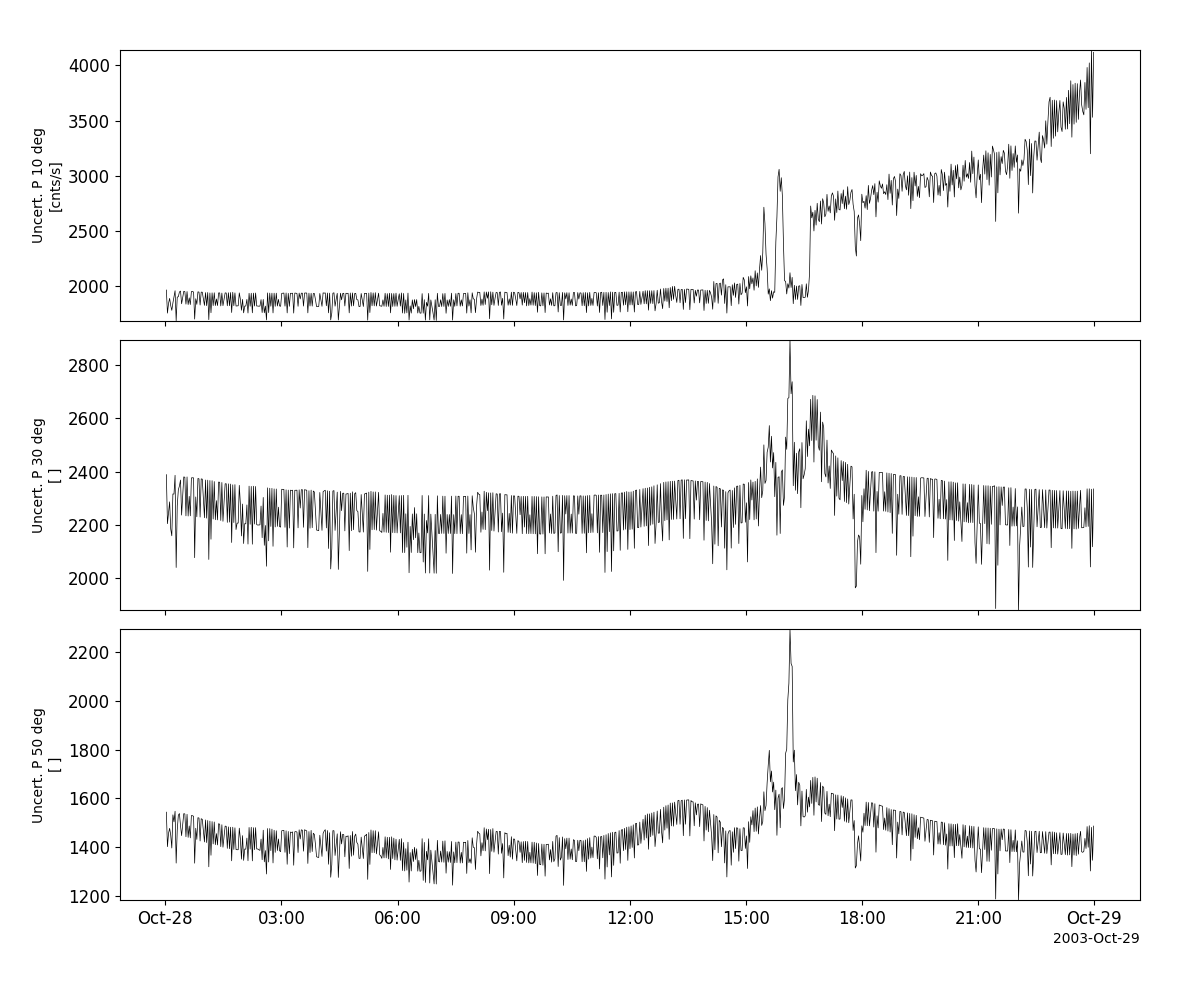
cep_vars = pyspedas.projects.polar.ceppad(trange=['2003-10-28', '2003-10-29'])
tplot(['IPS_10_ERR', 'IPS_30_ERR', 'IPS_50_ERR'])
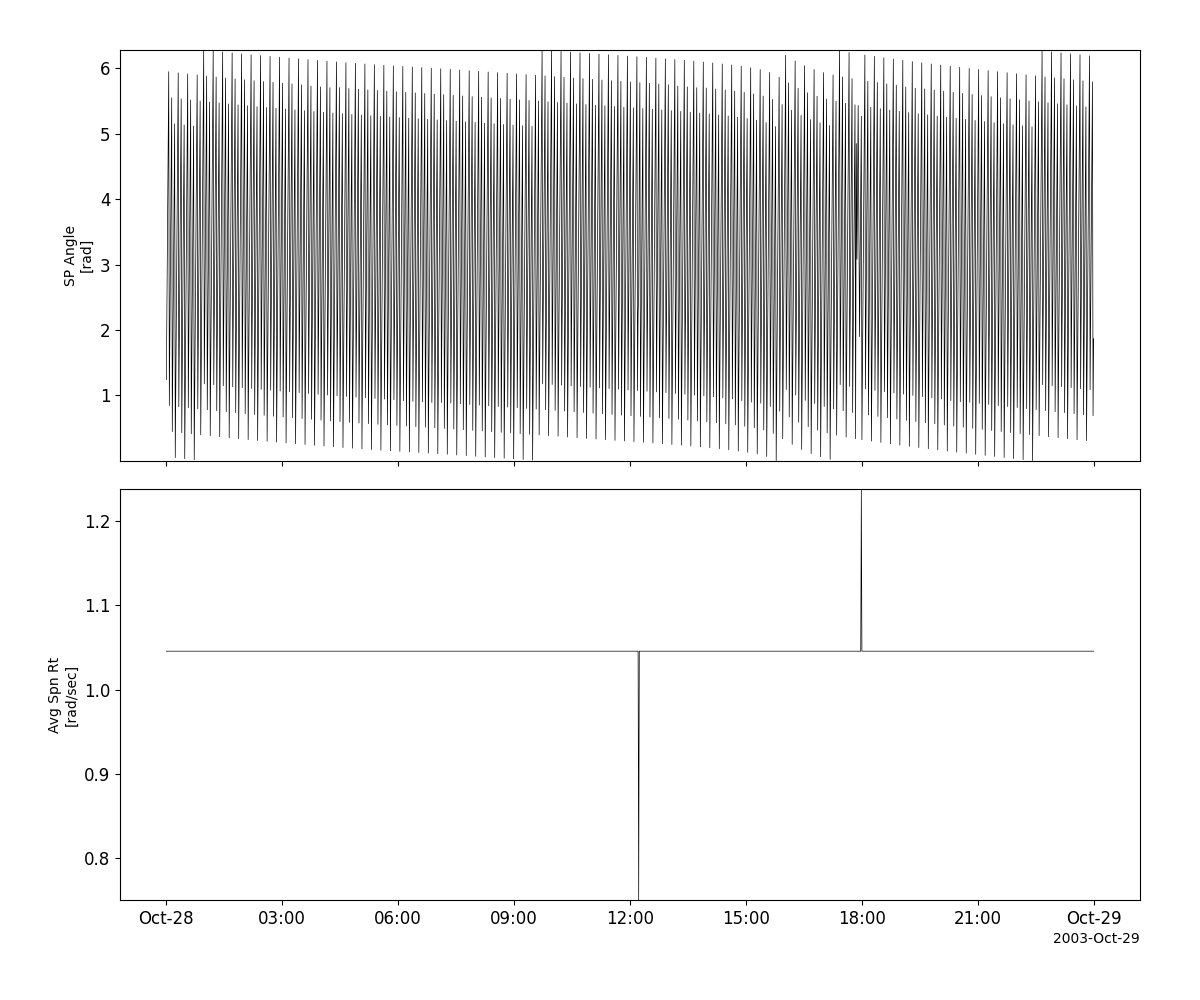
Orbit data
- pyspedas.projects.polar.orbit(trange=['2003-10-28', '2003-10-29'], datatype='k0', suffix='', prefix='', get_support_data=False, varformat=None, varnames=[], downloadonly=False, notplot=False, no_update=False, time_clip=False, force_download=False)[source]
This function loads Polar orbit data
- Parameters:
trange (
listofstr) – time range of interest [starttime, endtime] with the format ‘YYYY-MM-DD’,’YYYY-MM-DD’] or to specify more or less than a day [‘YYYY-MM-DD/hh:mm:ss’,’YYYY-MM-DD/hh:mm:ss’]datatype (
str) – Data type; Valid options:suffix (
str) – The tplot variable names will be given this suffix. By default, no prefix is added. Default: ‘’prefix (
str) – The tplot variable names will be given this prefix. By default, no prefix is added. Default: ‘’get_support_data (
bool) – Data with an attribute “VAR_TYPE” with a value of “support_data” will be loaded into tplot. By default, only loads in data with a “VAR_TYPE” attribute of “data”.varformat (
str) – The file variable formats to load into tplot. Wildcard character “*” is accepted. By default, all variables are loaded in.varnames (
listofstr) – List of variable names to load (if not specified, all data variables are loaded)downloadonly (
bool) – Set this flag to download the CDF files, but not load them into tplot variablesnotplot (
bool) – Return the data in hash tables instead of creating tplot variablesno_update (
bool) – If set, only load data from your local cachetime_clip (
bool) – Time clip the variables to exactly the range specified in the trange keywordforce_download (
bool) – If True, downloads the file even if a newer version exists locally. Default: False.
- Return type:
Listoftplot variables created.
Example
import pyspedas
from pyspedas import tplot
orb_vars = pyspedas.projects.polar.orbit(trange=['2003-10-28', '2003-10-29'])
tplot(['SPIN_PHASE', 'AVG_SPIN_RATE'])