Fast Auroral Snapshot Explorer (FAST)
The routines in this module can be used to load data from the Fast Auroral Snapshot Explorer (FAST) mission.
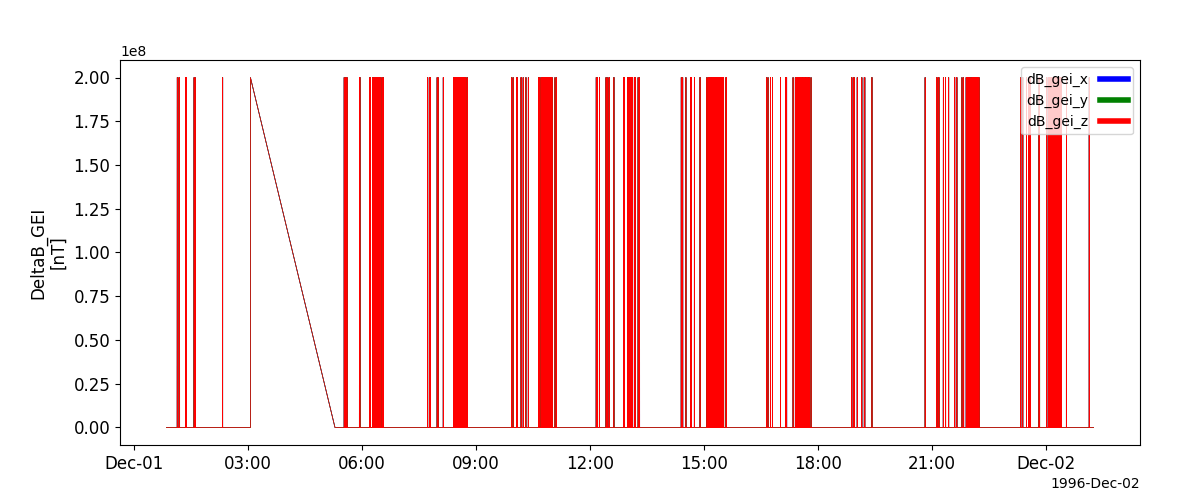
Fluxgate Magnetometer (DCF)
- pyspedas.projects.fast.dcf(trange=['1996-12-01', '1996-12-02'], instrument='dcf', datatype='', level='l2', prefix='', suffix='', get_support_data=False, varformat=None, varnames=[], downloadonly=False, notplot=False, no_update=False, time_clip=False, force_download=False)
Load FAST dcf data into tplot variables.
- Parameters:
trange (
listofstr, optional) – Time range of interest [starttime, endtime] with the format [‘YYYY-MM-DD’,’YYYY-MM-DD’] or to specify more or less than a day [‘YYYY-MM-DD/hh:mm:ss’,’YYYY-MM-DD/hh:mm:ss’]. Default is [“1996-12-01”, “1996-12-02”].instrument (
str, optional) – Type of instrument. Values can be: ‘dcf’, ‘acf’, ‘esa’, ‘teams’.Note
For this function, the instrument parameter is preset to ‘dcf’ and should not be set manually.
datatype (
str, optional) – Data type to load. Depends on the instrument. For ‘esa’ valid options are: ‘eeb’, ‘ees’, ‘ieb’, ‘ies’. For all other insturments, this keyword is ignored. Default is ‘’.level (
str, optional) – Data level to load. Depends on the instrument. For ‘dcf’ and ‘teams’ valid options are: ‘l2’, ‘k0’. For all other instruments, this keyword is ignored. Default is ‘l2’.prefix (
str, optional) – The tplot variable names will be given this prefix. Default is ‘’. In all cases a suitable prefix will be given depending on the instrument.suffix (
str, optional) – The tplot variable names will be given this suffix. Default is no suffix is added.get_support_data (
bool, optional) – Data with an attribute “VAR_TYPE” with a value of “support_data” will be loaded into tplot. Default is False; only loads in data with a “VAR_TYPE” attribute of “data”.varformat (
str, optional) – The file variable formats to load into tplot. Wildcard character “*” is accepted. Default is all variables are loaded in.varnames (
listofstr, optional) – List of variable names to load. Default is all data variables are loaded.downloadonly (
bool, optional) – Set this flag to download the CDF files, but not load them into tplot variables. Default is False.notplot (
bool, optional) – Return the data in hash tables instead of creating tplot variables. Default is False.no_update (
bool, optional) – If set, only load data from your local cache. Default is False.time_clip (
bool, optional) – Time clip the variables to exactly the range specified in the trange keyword. Default is False.force_download (
bool, optional) – Download file even if local version is more recent than server version. Default is False.
- Returns:
List of tplot variables created. If downloadonly is set to True, returns a list of the downloaded files. If notplot is set to True, returns a dictionary of the data loaded.
- Return type:
listofstr/dictionary
Example
import pyspedas
from pyspedas import tplot
dcf_vars = pyspedas.projects.fast.dcf(trange=["1996-12-01", "1996-12-02"])
tplot(['fast_dcf_DeltaB_GEI'])
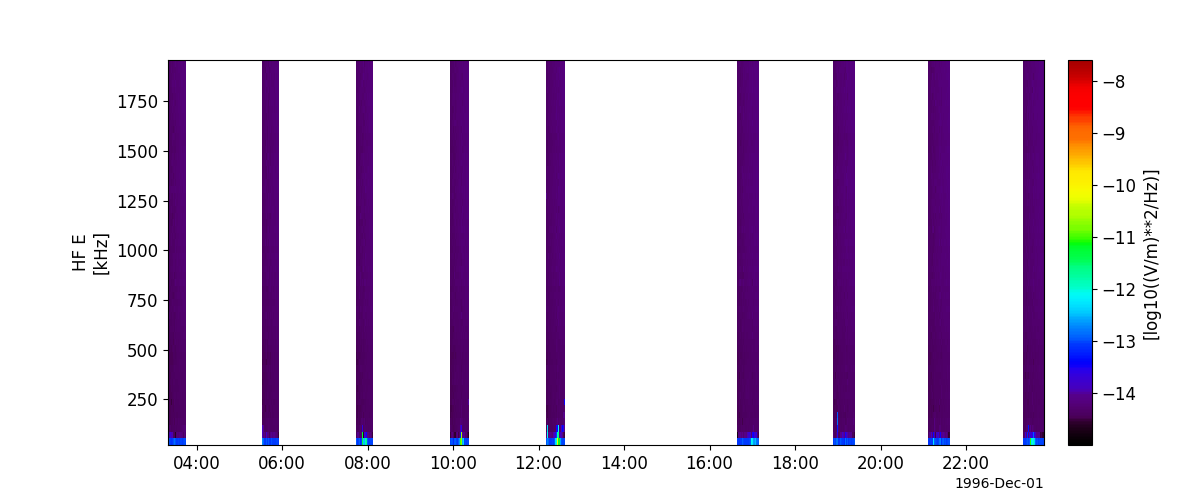
Search-coil Magnetometer (ACF)
- pyspedas.projects.fast.acf(trange=['1996-12-01', '1996-12-02'], instrument='dcf', datatype='', level='l2', prefix='', suffix='', get_support_data=False, varformat=None, varnames=[], downloadonly=False, notplot=False, no_update=False, time_clip=False, force_download=False)
Load FAST acf data into tplot variables.
- Parameters:
trange (
listofstr, optional) – Time range of interest [starttime, endtime] with the format [‘YYYY-MM-DD’,’YYYY-MM-DD’] or to specify more or less than a day [‘YYYY-MM-DD/hh:mm:ss’,’YYYY-MM-DD/hh:mm:ss’]. Default is [“1996-12-01”, “1996-12-02”].instrument (
str, optional) – Type of instrument. Values can be: ‘dcf’, ‘acf’, ‘esa’, ‘teams’.Note
For this function, the instrument parameter is preset to ‘acf’ and should not be set manually.
datatype (
str, optional) – Data type to load. Depends on the instrument. For ‘esa’ valid options are: ‘eeb’, ‘ees’, ‘ieb’, ‘ies’. For all other insturments, this keyword is ignored. Default is ‘’.level (
str, optional) – Data level to load. Depends on the instrument. For ‘dcf’ and ‘teams’ valid options are: ‘l2’, ‘k0’. For all other instruments, this keyword is ignored. Default is ‘l2’.prefix (
str, optional) – The tplot variable names will be given this prefix. Default is ‘’. In all cases a suitable prefix will be given depending on the instrument.suffix (
str, optional) – The tplot variable names will be given this suffix. Default is no suffix is added.get_support_data (
bool, optional) – Data with an attribute “VAR_TYPE” with a value of “support_data” will be loaded into tplot. Default is False; only loads in data with a “VAR_TYPE” attribute of “data”.varformat (
str, optional) – The file variable formats to load into tplot. Wildcard character “*” is accepted. Default is all variables are loaded in.varnames (
listofstr, optional) – List of variable names to load. Default is all data variables are loaded.downloadonly (
bool, optional) – Set this flag to download the CDF files, but not load them into tplot variables. Default is False.notplot (
bool, optional) – Return the data in hash tables instead of creating tplot variables. Default is False.no_update (
bool, optional) – If set, only load data from your local cache. Default is False.time_clip (
bool, optional) – Time clip the variables to exactly the range specified in the trange keyword. Default is False.force_download (
bool, optional) – Download file even if local version is more recent than server version. Default is False.
- Returns:
List of tplot variables created. If downloadonly is set to True, returns a list of the downloaded files. If notplot is set to True, returns a dictionary of the data loaded.
- Return type:
listofstr/dictionary
Example
import pyspedas
from pyspedas import tplot
acf_vars = pyspedas.projects.fast.acf(trange=["1996-12-01", "1996-12-02"])
tplot('fast_acf_HF_E_SPEC')
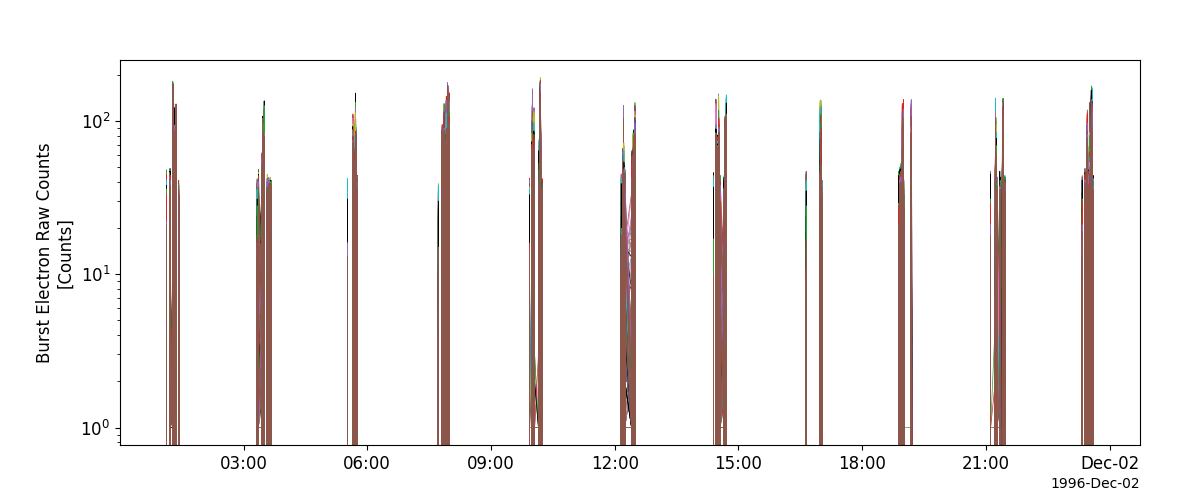
Electrostatic Analyzers (ESA)
- pyspedas.projects.fast.esa(trange=['1996-12-01', '1996-12-02'], instrument='dcf', datatype='', level='l2', prefix='', suffix='', get_support_data=False, varformat=None, varnames=[], downloadonly=False, notplot=False, no_update=False, time_clip=False, force_download=False)
Load FAST esa data into tplot variables.
- Parameters:
trange (
listofstr, optional) – Time range of interest [starttime, endtime] with the format [‘YYYY-MM-DD’,’YYYY-MM-DD’] or to specify more or less than a day [‘YYYY-MM-DD/hh:mm:ss’,’YYYY-MM-DD/hh:mm:ss’]. Default is [“1996-12-01”, “1996-12-02”].instrument (
str, optional) – Type of instrument. Values can be: ‘dcf’, ‘acf’, ‘esa’, ‘teams’.Note
For this function, the instrument parameter is preset to ‘esa’ and should not be set manually.
datatype (
str, optional) – Data type to load. Depends on the instrument. For ‘esa’ valid options are: ‘eeb’, ‘ees’, ‘ieb’, ‘ies’. For all other insturments, this keyword is ignored. Default is ‘’.level (
str, optional) – Data level to load. Depends on the instrument. For ‘dcf’ and ‘teams’ valid options are: ‘l2’, ‘k0’. For all other instruments, this keyword is ignored. Default is ‘l2’.prefix (
str, optional) – The tplot variable names will be given this prefix. Default is ‘’. In all cases a suitable prefix will be given depending on the instrument.suffix (
str, optional) – The tplot variable names will be given this suffix. Default is no suffix is added.get_support_data (
bool, optional) – Data with an attribute “VAR_TYPE” with a value of “support_data” will be loaded into tplot. Default is False; only loads in data with a “VAR_TYPE” attribute of “data”.varformat (
str, optional) – The file variable formats to load into tplot. Wildcard character “*” is accepted. Default is all variables are loaded in.varnames (
listofstr, optional) – List of variable names to load. Default is all data variables are loaded.downloadonly (
bool, optional) – Set this flag to download the CDF files, but not load them into tplot variables. Default is False.notplot (
bool, optional) – Return the data in hash tables instead of creating tplot variables. Default is False.no_update (
bool, optional) – If set, only load data from your local cache. Default is False.time_clip (
bool, optional) – Time clip the variables to exactly the range specified in the trange keyword. Default is False.force_download (
bool, optional) – Download file even if local version is more recent than server version. Default is False.
- Returns:
List of tplot variables created. If downloadonly is set to True, returns a list of the downloaded files. If notplot is set to True, returns a dictionary of the data loaded.
- Return type:
listofstr/dictionary
Example
import pyspedas
from pyspedas import tplot
esa_vars = pyspedas.projects.fast.esa(trange=["1996-12-01", "1996-12-02"])
tplot('fast_esa_eflux')
Time-of-flight Energy Angle Mass Spectrograph (TEAMS)
- pyspedas.projects.fast.teams(trange=['1996-12-01', '1996-12-02'], instrument='dcf', datatype='', level='l2', prefix='', suffix='', get_support_data=False, varformat=None, varnames=[], downloadonly=False, notplot=False, no_update=False, time_clip=False, force_download=False)
Load FAST teams data into tplot variables.
- Parameters:
trange (
listofstr, optional) – Time range of interest [starttime, endtime] with the format [‘YYYY-MM-DD’,’YYYY-MM-DD’] or to specify more or less than a day [‘YYYY-MM-DD/hh:mm:ss’,’YYYY-MM-DD/hh:mm:ss’]. Default is [“1996-12-01”, “1996-12-02”].instrument (
str, optional) – Type of instrument. Values can be: ‘dcf’, ‘acf’, ‘esa’, ‘teams’.Note
For this function, the instrument parameter is preset to ‘teams’ and should not be set manually.
datatype (
str, optional) – Data type to load. Depends on the instrument. For ‘esa’ valid options are: ‘eeb’, ‘ees’, ‘ieb’, ‘ies’. For all other insturments, this keyword is ignored. Default is ‘’.level (
str, optional) – Data level to load. Depends on the instrument. For ‘dcf’ and ‘teams’ valid options are: ‘l2’, ‘k0’. For all other instruments, this keyword is ignored. Default is ‘l2’.prefix (
str, optional) – The tplot variable names will be given this prefix. Default is ‘’. In all cases a suitable prefix will be given depending on the instrument.suffix (
str, optional) – The tplot variable names will be given this suffix. Default is no suffix is added.get_support_data (
bool, optional) – Data with an attribute “VAR_TYPE” with a value of “support_data” will be loaded into tplot. Default is False; only loads in data with a “VAR_TYPE” attribute of “data”.varformat (
str, optional) – The file variable formats to load into tplot. Wildcard character “*” is accepted. Default is all variables are loaded in.varnames (
listofstr, optional) – List of variable names to load. Default is all data variables are loaded.downloadonly (
bool, optional) – Set this flag to download the CDF files, but not load them into tplot variables. Default is False.notplot (
bool, optional) – Return the data in hash tables instead of creating tplot variables. Default is False.no_update (
bool, optional) – If set, only load data from your local cache. Default is False.time_clip (
bool, optional) – Time clip the variables to exactly the range specified in the trange keyword. Default is False.force_download (
bool, optional) – Download file even if local version is more recent than server version. Default is False.
- Returns:
List of tplot variables created. If downloadonly is set to True, returns a list of the downloaded files. If notplot is set to True, returns a dictionary of the data loaded.
- Return type:
listofstr/dictionary
Example
import pyspedas
from pyspedas import tplot
teams_vars = pyspedas.projects.fast.teams(trange=["2005-08-01", "2005-08-02"])
tplot(['fast_teams_helium_omni_flux'])