Ulysses
The routines in this module can be used to load data from the Ulysses mission.
Magnetic field (VHM)
- pyspedas.projects.ulysses.vhm(trange: List[str] = ['2009-01-01', '2009-01-02'], datatype: str = '1min', prefix: str = '', suffix: str = '', get_support_data: bool = False, varformat: str = None, varnames: List[str] = [], downloadonly: bool = False, force_download: bool = False, notplot: bool = False, no_update: bool = False, time_clip: bool = True) List[str][source]
Load data from the VHM/FGM experiment from the Ulysses mission
- Parameters:
trange (
listofstr) – time range of interest [starttime, endtime] with the format [‘YYYY-MM-DD’,’YYYY-MM-DD’] or to specify more or less than a day [‘YYYY-MM-DD/hh:mm:ss’,’YYYY-MM-DD/hh:mm:ss’] Default: [‘2009-01-01’, ‘2009-01-02’]datatype (
str) – Data type; Valid options:’1min’, ‘1sec’, ‘m1’ Default: ‘1min’prefix (
str) – The tplot variable names will be given this prefix. Default: ‘’suffix (
str) – The tplot variable names will be given this suffix. Default: ‘’get_support_data (
bool) – If True, data with an attribute “VAR_TYPE” with a value of “support_data” will be loaded into tplot. Default: Falsevarformat (
str) – The file variable formats to load into tplot. Wildcard character “*” is accepted. Default: ‘’ (all variables loaded)varnames (
listofstr) – List of variable names to load (If empty list or not specified, all data variables are loaded) Default: []downloadonly (
bool) – Set this flag to download the CDF files, but not load them into tplot variables Default: Falseforce_download (
bool) – Set this flag to download the CDF files, even if local file is newer Default: Falsenotplot (
bool) – Return the data in hash tables instead of creating tplot variables Default: Falseno_update (
bool) – If set, only load data from your local cache Default: Falsetime_clip (
bool) – Time clip the variables to exactly the range specified in the trange keyword Default: True
- Returns:
List of tplot variables created.
- Return type:
Examples
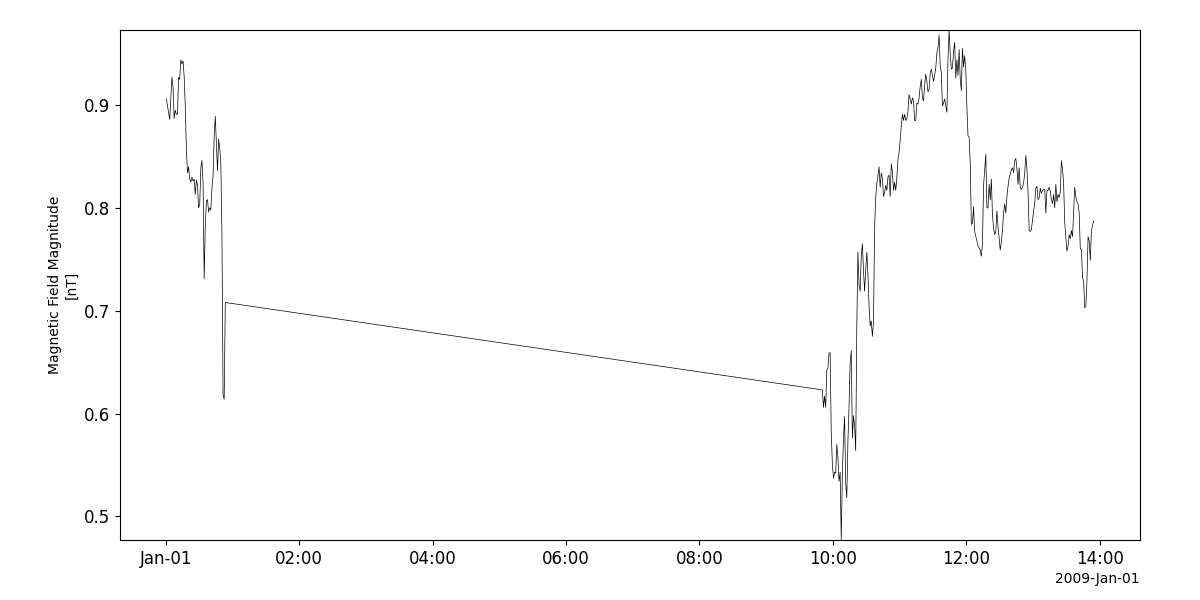
>>> import pyspedas
>>> from pyspedas import tplot
>>> vhm_vars = pyspedas.projects.ulysses.vhm(trange=['2009-01-01', '2009-01-02'])
>>> tplot('B_MAG')
Example
import pyspedas
from pyspedas import tplot
vhm_vars = pyspedas.projects.ulysses.vhm()
tplot('B_MAG')
Solar wind plasma (SWOOPS)
- pyspedas.projects.ulysses.swoops(trange: List[str] = ['2009-01-01', '2009-01-02'], datatype: str = 'bai_m0', prefix: str = '', suffix: str = '', get_support_data: bool = False, varformat: str = None, varnames: List[str] = [], downloadonly: bool = False, force_download: bool = False, notplot: bool = False, no_update: bool = False, time_clip: bool = True) List[str][source]
This function loads data from the SWOOPS experiment from the Ulysses mission
- Parameters:
trange (
listofstr) – time range of interest [starttime, endtime] with the format [‘YYYY-MM-DD’,’YYYY-MM-DD’] or to specify more or less than a day [‘YYYY-MM-DD/hh:mm:ss’,’YYYY-MM-DD/hh:mm:ss’] Default: [‘2009-01-01’, ‘2009-01-02’]datatype (
str) – Data type; Valid options: ‘bai_m0, ‘bai_m1’, ‘bae_m0’ Default: ‘bai_m0’prefix (
str) – The tplot variable names will be given this prefix. Default: ‘’suffix (
str) – The tplot variable names will be given this suffix. Default: ‘’get_support_data (
bool) – If True, data with an attribute “VAR_TYPE” with a value of “support_data” will be loaded into tplot. Default: Falsevarformat (
str) – The file variable formats to load into tplot. Wildcard character “*” is accepted. Default: ‘’ (all variables loaded)varnames (
listofstr) – List of variable names to load (If empty list or not specified, all data variables are loaded) Default: []downloadonly (
bool) – Set this flag to download the CDF files, but not load them into tplot variables Default: Falseforce_download (
bool) – Set this flag to download the CDF files, even if local file is newer Default: Falsenotplot (
bool) – Return the data in hash tables instead of creating tplot variables Default: Falseno_update (
bool) – If set, only load data from your local cache Default: Falsetime_clip (
bool) – Time clip the variables to exactly the range specified in the trange keyword Default: False
- Returns:
List of tplot variables created.
- Return type:
Examples
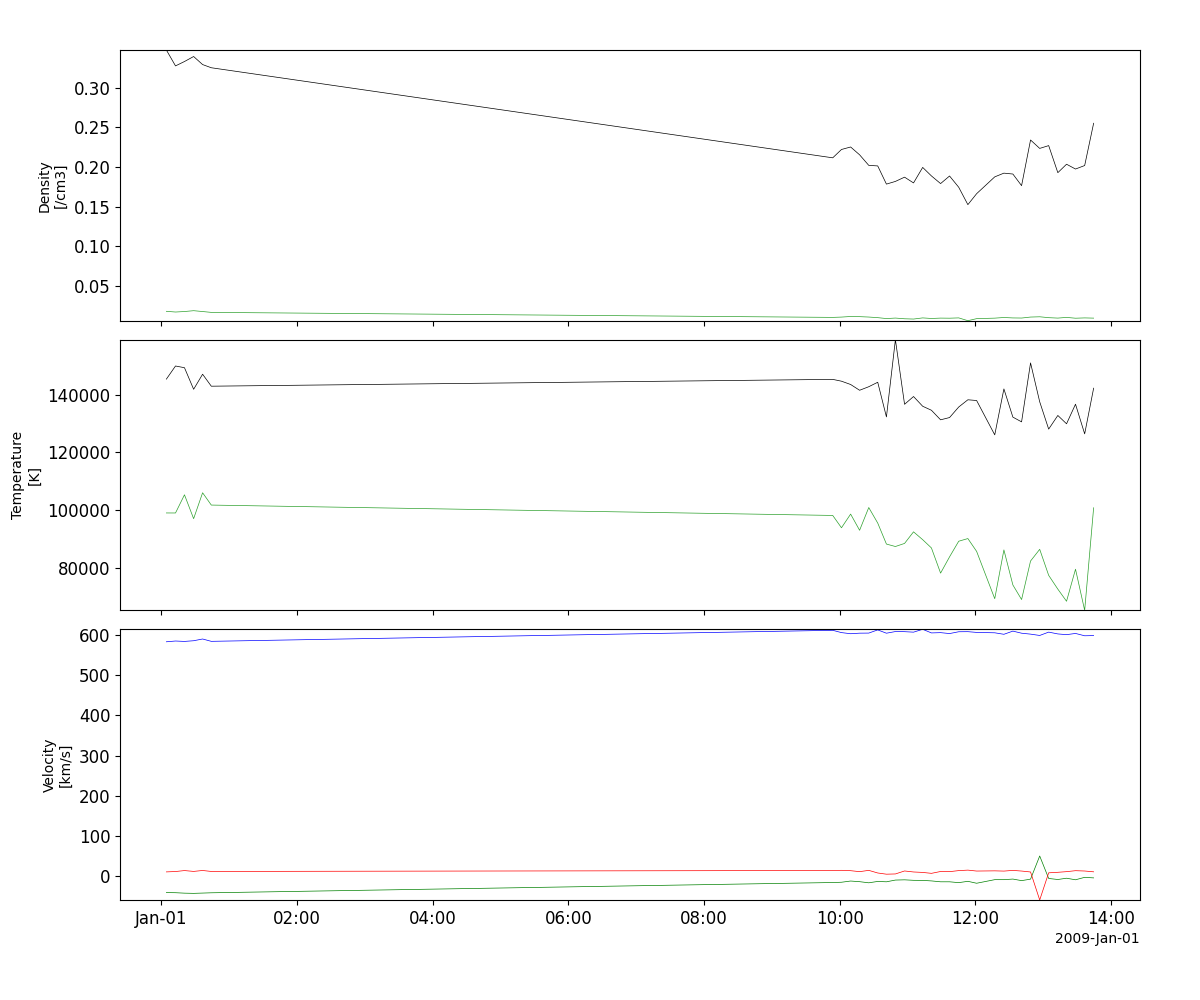
>>> import pyspedas
>>> from pyspedas import tplot
>>> swoops_vars = pyspedas.projects.ulysses.swoops(trange=['2009-01-01', '2009-01-02'])
>>> tplot(['Density', 'Temperature', 'Velocity'])
Example
import pyspedas
from pyspedas import tplot
swoops_vars = pyspedas.projects.ulysses.swoops()
tplot(['Density', 'Temperature', 'Velocity'])
Solar wind ion composition (SWICS)
- pyspedas.projects.ulysses.swics(trange: List[str] = ['2009-01-01', '2009-01-02'], datatype: str = 'scs_m1', prefix: str = '', suffix: str = '', get_support_data: bool = False, varformat: str = None, varnames: List[str] = [], downloadonly: bool = False, force_download: bool = False, notplot: bool = False, no_update: bool = False, time_clip: bool = True) List[str][source]
This function loads data from the SWICS experiment from the Ulysses mission
- Parameters:
trange (
listofstr) – time range of interest [starttime, endtime] with the format [‘YYYY-MM-DD’,’YYYY-MM-DD’] or to specify more or less than a day [‘YYYY-MM-DD/hh:mm:ss’,’YYYY-MM-DD/hh:mm:ss’] Default: [‘2009-01-01’, ‘2009-01-02’]datatype (
str) – Data type; Valid options: ‘scs_m1’, ‘swi_m1’, ‘glg_h0’ Default: ‘scs_m1’prefix (
str) – The tplot variable names will be given this prefix. Default: ‘’suffix (
str) – The tplot variable names will be given this suffix. Default: ‘’get_support_data (
bool) – If True, data with an attribute “VAR_TYPE” with a value of “support_data” will be loaded into tplot. Default: Falsevarformat (
str) – The file variable formats to load into tplot. Wildcard character “*” is accepted. Default: ‘’ (all variables loaded)varnames (
listofstr) – List of variable names to load (If empty list or not specified, all data variables are loaded) Default: []downloadonly (
bool) – Set this flag to download the CDF files, but not load them into tplot variables Default: Falseforce_downnload (
bool) – Set this flag to download the CDF files, even if local file is newer Default: Falsenotplot (
bool) – Return the data in hash tables instead of creating tplot variables Default: Falseno_update (
bool) – If set, only load data from your local cache Default: Falsetime_clip (
bool) – Time clip the variables to exactly the range specified in the trange keyword Default: False
- Returns:
List of tplot variables created.
- Return type:
Examples
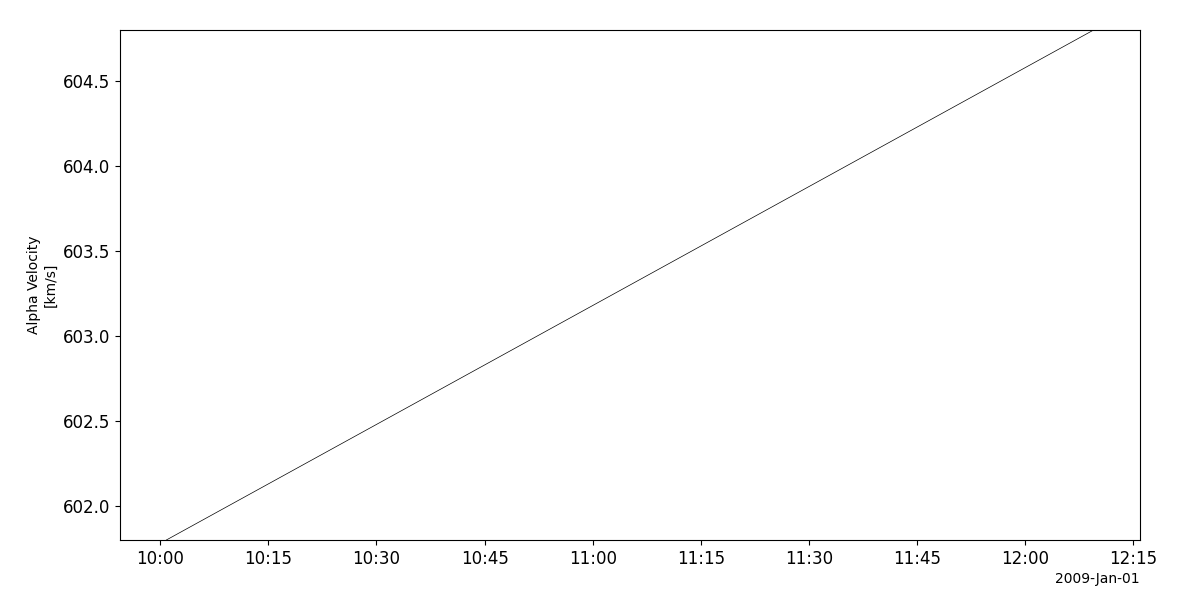
>>> import pyspedas
>>> from pyspedas import tplot
>>> swics_vars = pyspedas.projects.ulysses.swics(trange=['2009-01-01', '2009-01-02'])
>>> tplot('Velocity')
Example
import pyspedas
from pyspedas import tplot
swics_vars = pyspedas.projects.ulysses.swics()
tplot('Velocity')
Energetic particles (EPAC)
- pyspedas.projects.ulysses.epac(trange: List[str] = ['1996-01-01', '1996-01-02'], datatype: str = 'epac_m1', prefix: str = '', suffix: str = '', get_support_data: bool = False, varformat: str = None, varnames: List[str] = [], downloadonly: bool = False, force_download: bool = False, notplot: bool = False, no_update: bool = False, time_clip: bool = True) List[str][source]
This function loads data from the EPAC experiment from the Ulysses mission
- Parameters:
trange (
listofstr) – time range of interest [starttime, endtime] with the format [‘YYYY-MM-DD’,’YYYY-MM-DD’] or to specify more or less than a day [‘YYYY-MM-DD/hh:mm:ss’,’YYYY-MM-DD/hh:mm:ss’] Default: [‘1996-01-01’, ‘1996-01-02’]datatype (
str) – Data type; Valid options: ‘epac_br’, ‘epac_el’, ‘epac_er’, ‘epac_hr’, ‘epac_hs’, ‘epac_m1’, ‘epac_op’, ‘epac_oz’, epac_pr’, ‘epac_ps’, ‘epac_zr’, epac_zs’ Default: ‘epac_m1’prefix (
str) – The tplot variable names will be given this prefix. Default: ‘’suffix (
str) – The tplot variable names will be given this suffix. Default: ‘’get_support_data (
bool) – If True, data with an attribute “VAR_TYPE” with a value of “support_data” will be loaded into tplot. Default: Falsevarformat (
str) – The file variable formats to load into tplot. Wildcard character “*” is accepted. Default: ‘’ (all variables loaded)varnames (
listofstr) – List of variable names to load (If empty list or not specified, all data variables are loaded) Default: []downloadonly (
bool) – Set this flag to download the CDF files, but not load them into tplot variables Default: Falseforce_download (
bool) – Set this flag to download the CDF files, even if the local file is newer Default: Falsenotplot (
bool) – Return the data in hash tables instead of creating tplot variables Default: Falseno_update (
bool) – If set, only load data from your local cache Default: Falsetime_clip (
bool) – Time clip the variables to exactly the range specified in the trange keyword Default: False
- Returns:
List of tplot variables created.
- Return type:
Examples
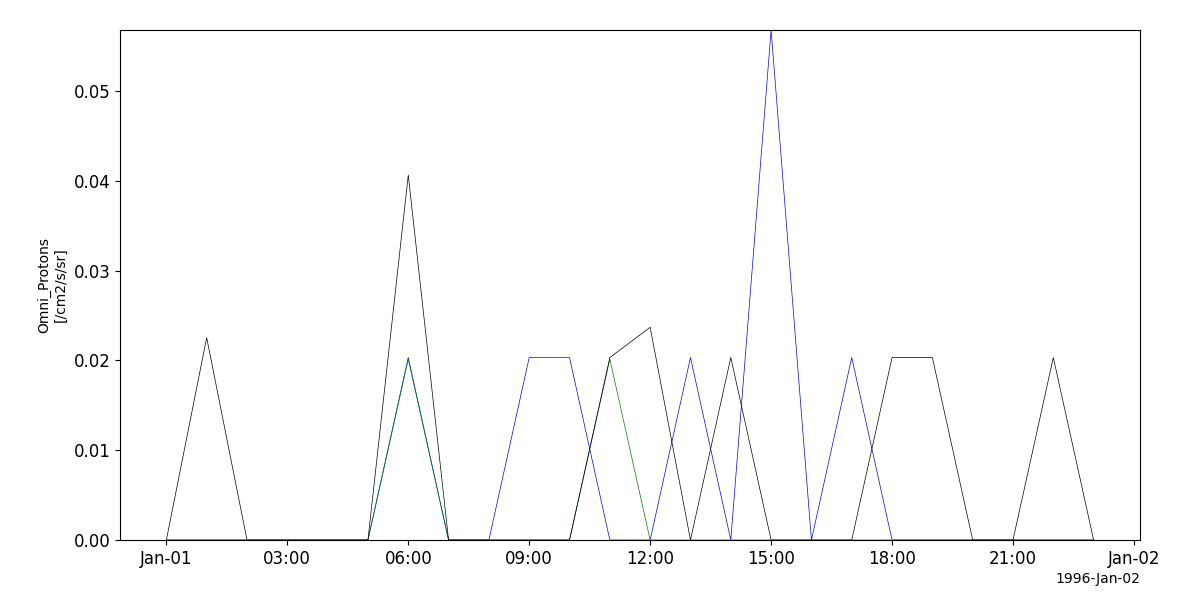
>>> import pyspedas
>>> from pyspedas import tplot
>>> epac_vars = pyspedas.projects.ulysses.epac(trange=['1996-01-01', '1996-01-02'])
>>> tplot('Omni_Protons')
Example
import pyspedas
from pyspedas import tplot
epac_vars = pyspedas.projects.ulysses.epac()
tplot('Omni_Protons')
Low-energy ions and electrons (HI-SCALE)
- pyspedas.projects.ulysses.hiscale(trange: List[str] = ['2003-01-01', '2003-01-02'], datatype: str = 'lmde_m1', prefix: str = '', suffix: str = '', get_support_data: bool = False, varformat: str = None, varnames: List[str] = [], downloadonly: bool = False, force_download: bool = False, notplot: bool = False, no_update: bool = False, time_clip: bool = True) List[str][source]
This function loads data from the HI-SCALE experiment from the Ulysses mission
- Parameters:
trange (
listofstr) – time range of interest [starttime, endtime] with the format [‘YYYY-MM-DD’,’YYYY-MM-DD’] or to specify more or less than a day [‘YYYY-MM-DD/hh:mm:ss’,’YYYY-MM-DD/hh:mm:ss’] Default: [‘2003-01-01’, ‘2003-01-02’]datatype (
str) – Data type; Valid options: ‘lf15_m1’, ‘lf60_m1’, ‘lm12_m1’, ‘lm30_m1’, ‘lmde_m1’, ‘wart_m1’, ‘wrtd_m1’ Default: ‘lmde_m1’prefix (
str) – The tplot variable names will be given this prefix. Default: ‘’suffix (
str) – The tplot variable names will be given this suffix. Default: ‘’get_support_data (
bool) – If True, data with an attribute “VAR_TYPE” with a value of “support_data” will be loaded into tplot. Default: Falsevarformat (
str) – The file variable formats to load into tplot. Wildcard character “*” is accepted. Default: ‘’ (all variables loaded)varnames (
listofstr) – List of variable names to load (If empty list or not specified, all data variables are loaded) Default: []downloadonly (
bool) – Set this flag to download the CDF files, but not load them into tplot variables Default: Falseforce_download (
bool) – Set this flag to download the CDF files, even if local file is newer Default: Falsenotplot (
bool) – Return the data in hash tables instead of creating tplot variables Default: Falseno_update (
bool) – If set, only load data from your local cache Default: Falsetime_clip (
bool) – Time clip the variables to exactly the range specified in the trange keyword Default: False
- Returns:
List of tplot variables created.
- Return type:
Examples
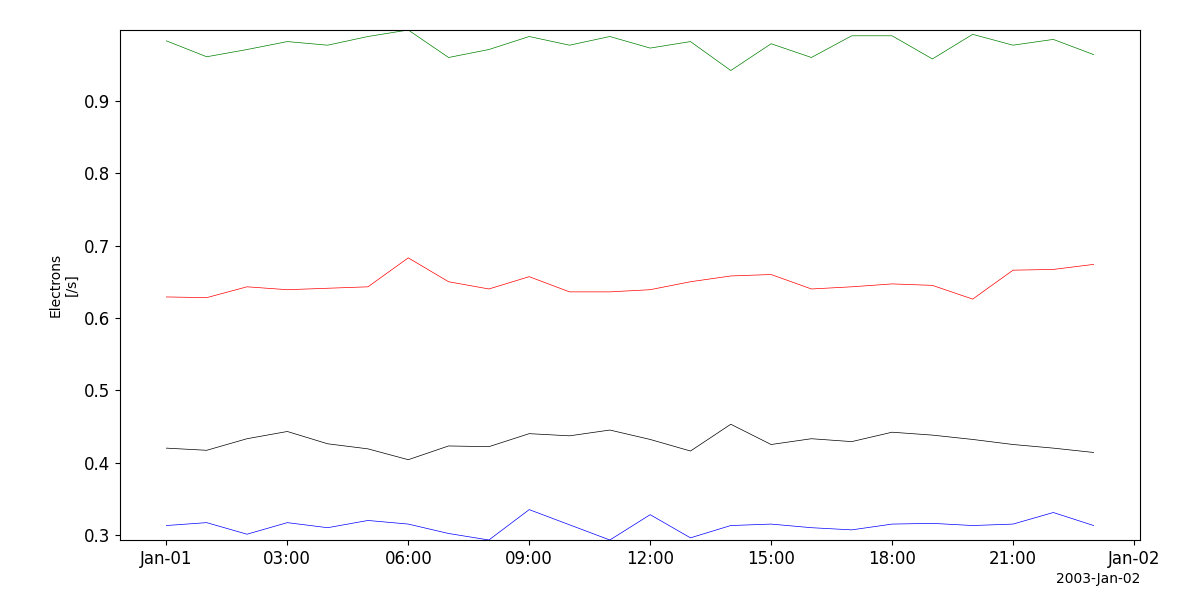
>>> import pyspedas
>>> from pyspedas import tplot
>>> hiscale_vars = pyspedas.projects.ulysses.hiscale()
>>> tplot('Electrons')
Example
import pyspedas
from pyspedas import tplot
hiscale_vars = pyspedas.projects.ulysses.hiscale()
tplot('Electrons')
Solar X-rays and cosmic gamma-ray bursts (GRB)
- pyspedas.projects.ulysses.grb(trange: List[str] = ['2003-01-01', '2003-01-02'], datatype: str = 'grb_m0', prefix: str = '', suffix: str = '', get_support_data: bool = False, varformat: str = None, varnames: List[str] = [], downloadonly: bool = False, force_download: bool = False, notplot: bool = False, no_update: bool = False, time_clip: bool = True) List[str][source]
This function loads data from the GRB experiment from the Ulysses mission
- Parameters:
trange (
listofstr) – time range of interest [starttime, endtime] with the format [‘YYYY-MM-DD’,’YYYY-MM-DD’] or to specify more or less than a day [‘YYYY-MM-DD/hh:mm:ss’,’YYYY-MM-DD/hh:mm:ss’] Default: [‘2003-01-01’, ‘2003-01-02’]datatype (
str) – Data type; Valid options: ‘grb_m0’ Default: ‘grb_m0’prefix (
str) – The tplot variable names will be given this prefix. Default: ‘’suffix (
str) – The tplot variable names will be given this suffix. Default: ‘’get_support_data (
bool) – If True, data with an attribute “VAR_TYPE” with a value of “support_data” will be loaded into tplot. Default: Falsevarformat (
str) – The file variable formats to load into tplot. Wildcard character “*” is accepted. Default: ‘’ (all variables loaded)varnames (
listofstr) – List of variable names to load (If empty list or not specified, all data variables are loaded) Default: []downloadonly (
bool) – Set this flag to download the CDF files, but not load them into tplot variables Default: Falseforce_download (
bool) – Set this flag to download the CDF files, even if local file is newer Default: Falsenotplot (
bool) – Return the data in hash tables instead of creating tplot variables Default: Falseno_update (
bool) – If set, only load data from your local cache Default: Falsetime_clip (
bool) – Time clip the variables to exactly the range specified in the trange keyword Default: False
- Returns:
List of tplot variables created.
- Return type:
Examples
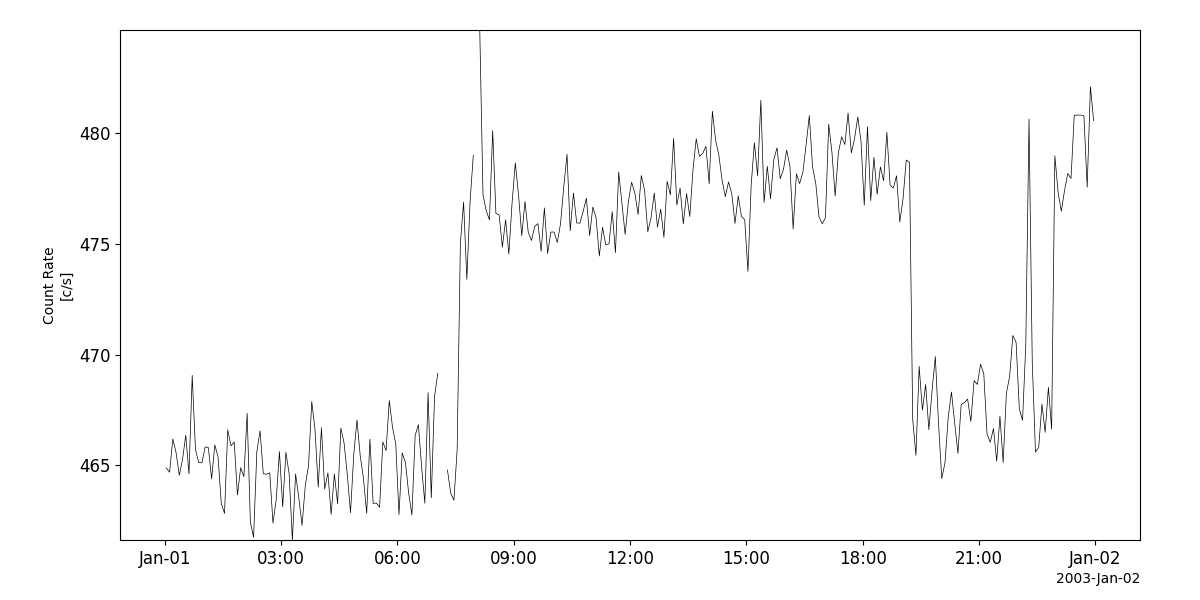
>>> import pyspedas
>>> from pyspedas import tplot
>>> grb_vars = pyspedas.projects.ulysses.grb(trange=['2003-01-01', '2003-01-02'])
>>> tplot('Count_Rate')
Example
import pyspedas
from pyspedas import tplot
grb_vars = pyspedas.projects.ulysses.grb()
tplot('Count_Rate')