Geomagnetic, Solar Wind, and Magnetospheric Indices (Kp, Dst, OMNIweb, etc)
The routines described in this section can be used to load several sets of geomagnetic and space weather indices.
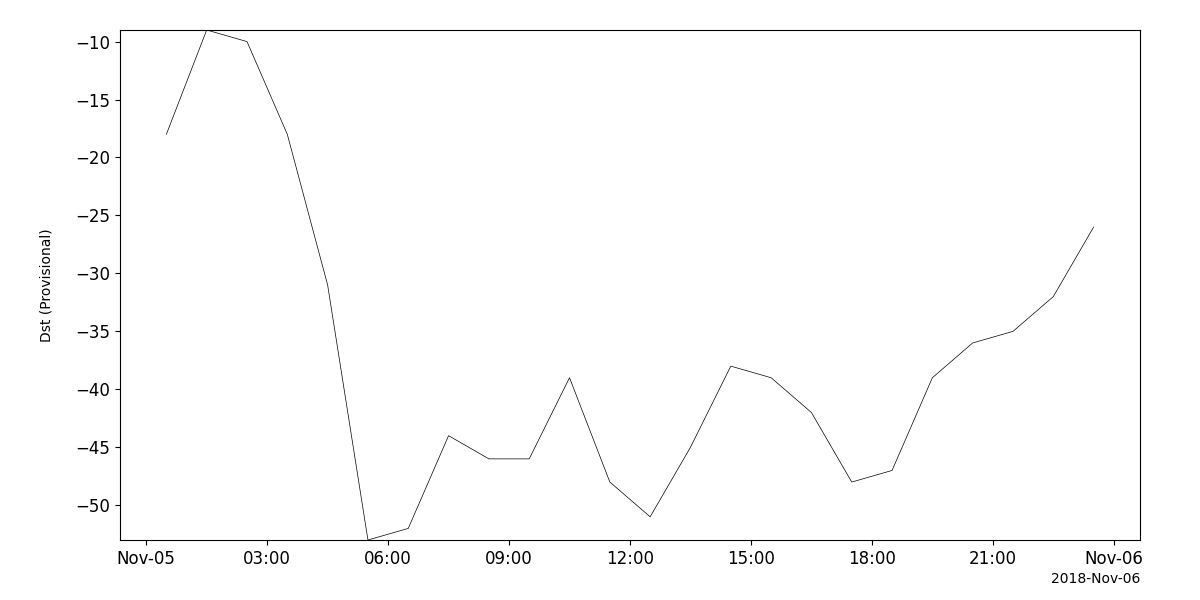
Kyoto Dst
- pyspedas.projects.kyoto.dst(trange=None, datatypes=['final', 'provisional', 'realtime'], time_clip=True, remote_data_dir='http://wdc.kugi.kyoto-u.ac.jp/', prefix='', suffix='', no_download=False, local_data_dir='', download_only=False, force_download=False)[source]
Loads Dst index data from the Kyoto servers.
- Parameters:
trange (
listofstr,required) – Time range of interest with the format [‘YYYY-MM-DD’,’YYYY-MM-DD’] or to specify more or less than a day [‘YYYY-MM-DD/hh:mm:ss’,’YYYY-MM-DD/hh:mm:ss’].time_clip (
bool, optional) – Time clip the variables to exactly the range specified in the trange keyword. Defaults to True.remote_data_dir (
str, optional) – The remote directory from where to load the Dst index data. Defaults to “http://wdc.kugi.kyoto-u.ac.jp/”.suffix (
str, optional) – The tplot variable names will be given this suffix. By default, no suffix is added.force_download (
bool) – Download file even if local version is more recent than server version Default: False
- Returns:
List of tplot variables created.
- Return type:
Notes
There are three types of Dst data available: final, provisional, and realtime. Usually, only one type is available for a particular month. is function tries to download final data, if this is not available then it downloads provisional data, and if this is not available then it downloads realtime data.
Examples
>>> from pyspedas.projects.kyoto import dst
>>> dst_data = dst(trange=['2015-01-01', '2015-01-02'])
>>> print(dst_data)
kyoto_dst
Example
import pyspedas
from pyspedas import tplot
dst_vars = pyspedas.projects.kyoto.dst(trange=['2018-11-5', '2018-11-6'])
tplot('kyoto_dst')
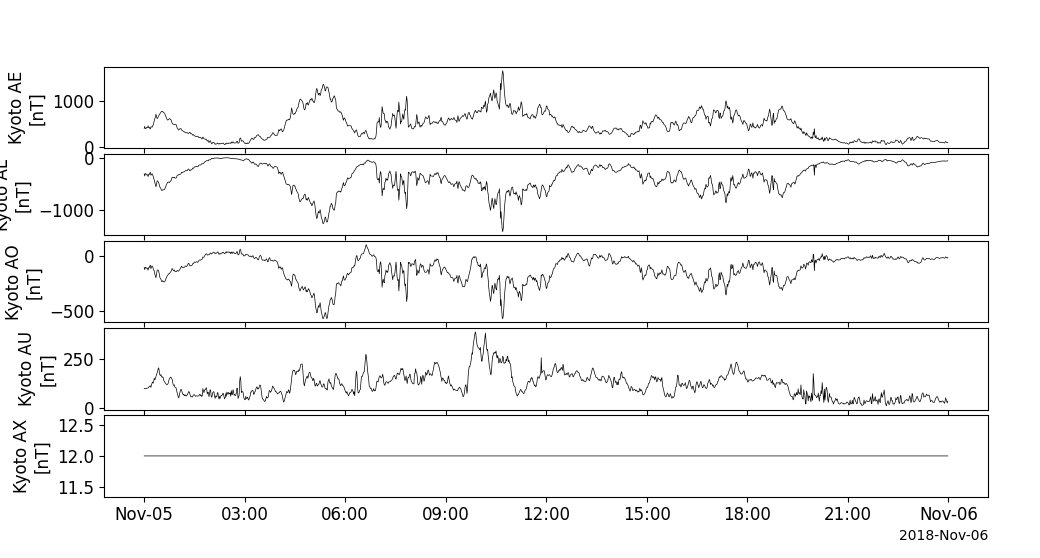
Kyoto AE
- pyspedas.projects.kyoto.load_ae(trange=None, datatypes=['ae', 'al', 'ao', 'au', 'ax'], time_clip=True, remote_data_dir='', prefix='', suffix='', no_download=False, local_data_dir='', download_only=False, force_download=False, realtime=False)[source]
Downloads and loads data from the Kyoto World Data Center for Geomagnetism. The realtime and provisional data sets are organized a little differently, so if necessary, this routine makes two calls to load_ae_worker (one for provisional, one for realtime) and combines the results.
- Parameters:
trange (
list) – The time range of the data to download and load. Format: [start_time, end_time].datatypes (
list, optional) – The types of AE index data to download and load. Default: [“ae”, “al”, “ao”, “au”, “ax”].time_clip (
bool, optional) – Whether to clip the loaded data to the specified time range. Default: True.remote_data_dir (
str, optional) – The remote directory where the data is located. Default: “https://wdc.kugi.kyoto-u.ac.jp/ae_provisional/”.prefix (
str, optional) – A prefix to add to the variable names of the loaded data. Default: “”.suffix (
str, optional) – A suffix to add to the variable names of the loaded data. Default: “”.no_download (
bool, optional) – If True, the data will not be downloaded, the local file will be used. Default: False.local_data_dir (
str, optional) – The local directory where the data will be downloaded. Default: “”.download_only (
bool, optional) – If True, only download the data, do not load it. Default: False.force_download (
bool) – Download file even if local version is more recent than server version Default: False
- Returns:
A list of tplot variable names created.
- Return type:
Examples
>>> from pyspedas.projects.kyoto import load_ae
>>> trange = ['2010-01-01 12:00:00', '2010-01-01 18:00:00']
>>> vars = load_ae(trange=trange)
>>> print(vars)
['kyoto_ae', 'kyoto_al', 'kyoto_ao', 'kyoto_au', 'kyoto_ax']
Example
import pyspedas
from pyspedas import tplot
ae_vars = pyspedas.projects.kyoto.load_ae(trange=['2018-11-5', '2018-11-6'])
tplot(ae_vars)
NOAA/GFZ Kp and other geomagnetic Indices
- pyspedas.projects.noaa.noaa_load_kp(trange=['2017-03-01/00:00:00', '2017-03-31/23:59:59'], local_kp_dir=None, datatype=[], gfz=False, prefix='', suffix='', time_clip=True, force_download=False)[source]
Load geomagnetic index data into appropriate variables.
- Parameters:
trange (
listofstr) – Time range to load data for. Should be a list of two strings.local_kp_dir (
str) – Directory where data is saved locally.datatype (
listofstr, optional) –- Type of index to load. Default is an empty list, which loads all available data. Valid values:
“Kp”, “ap”, “Sol_Rot_Num”, “Sol_Rot_Day”, “Kp_Sum”, “ap_Mean”, “Cp”, “C9”, “Sunspot_Number”, “F10.7”, “Flux_Qualifier”,
gfz (
bool, optional) – Load data from the HTTPS site of the German Research Centre for Geosciences, instead of NOAA. This is the default behavior if the end time is on or after 2018. Default is False (by default, it loads data from the HTTPS server of NOAA). If this source is used, the Sunspot_Number, F10.7, and Flux_Qualifier datatypes will not be available.prefix (
str, optional) – If provided, specifies a string to be prepended to tplot variable names.suffix (
str, optional) – If provided, specifies a string to be appended to tplot variable names.time_clip (
bool, optional) – If True, data will be time clipped to the exact time range requested. Default is True.force_download (
bool) – Download file even if local version is more recent than server version. Default is False.
- Returns:
Returns the names of tplot variables that contain all the data. Data is saved in a tplot variables.
- Return type:
Example
>>> from pyspedas import noaa_load_kp
>>> vars = noaa_load_kp(trange=['2014-03-23/00:00:00', '2014-03-23/23:59:59'])
>>> print(vars)
['Kp', 'ap', 'Sol_Rot_Num', 'Sol_Rot_Day', 'Kp_Sum', 'ap_Mean', 'Cp', 'C9', 'Sunspot_Number', 'F10.7', 'Flux_Qualifier']
Example
import pyspedas
from pyspedas import tplot
geom_ind = pyspedas.projects.noaa.noaa_load_kp(trange=['2018-11-5', '2018-11-6'])
tplot(geom_ind)
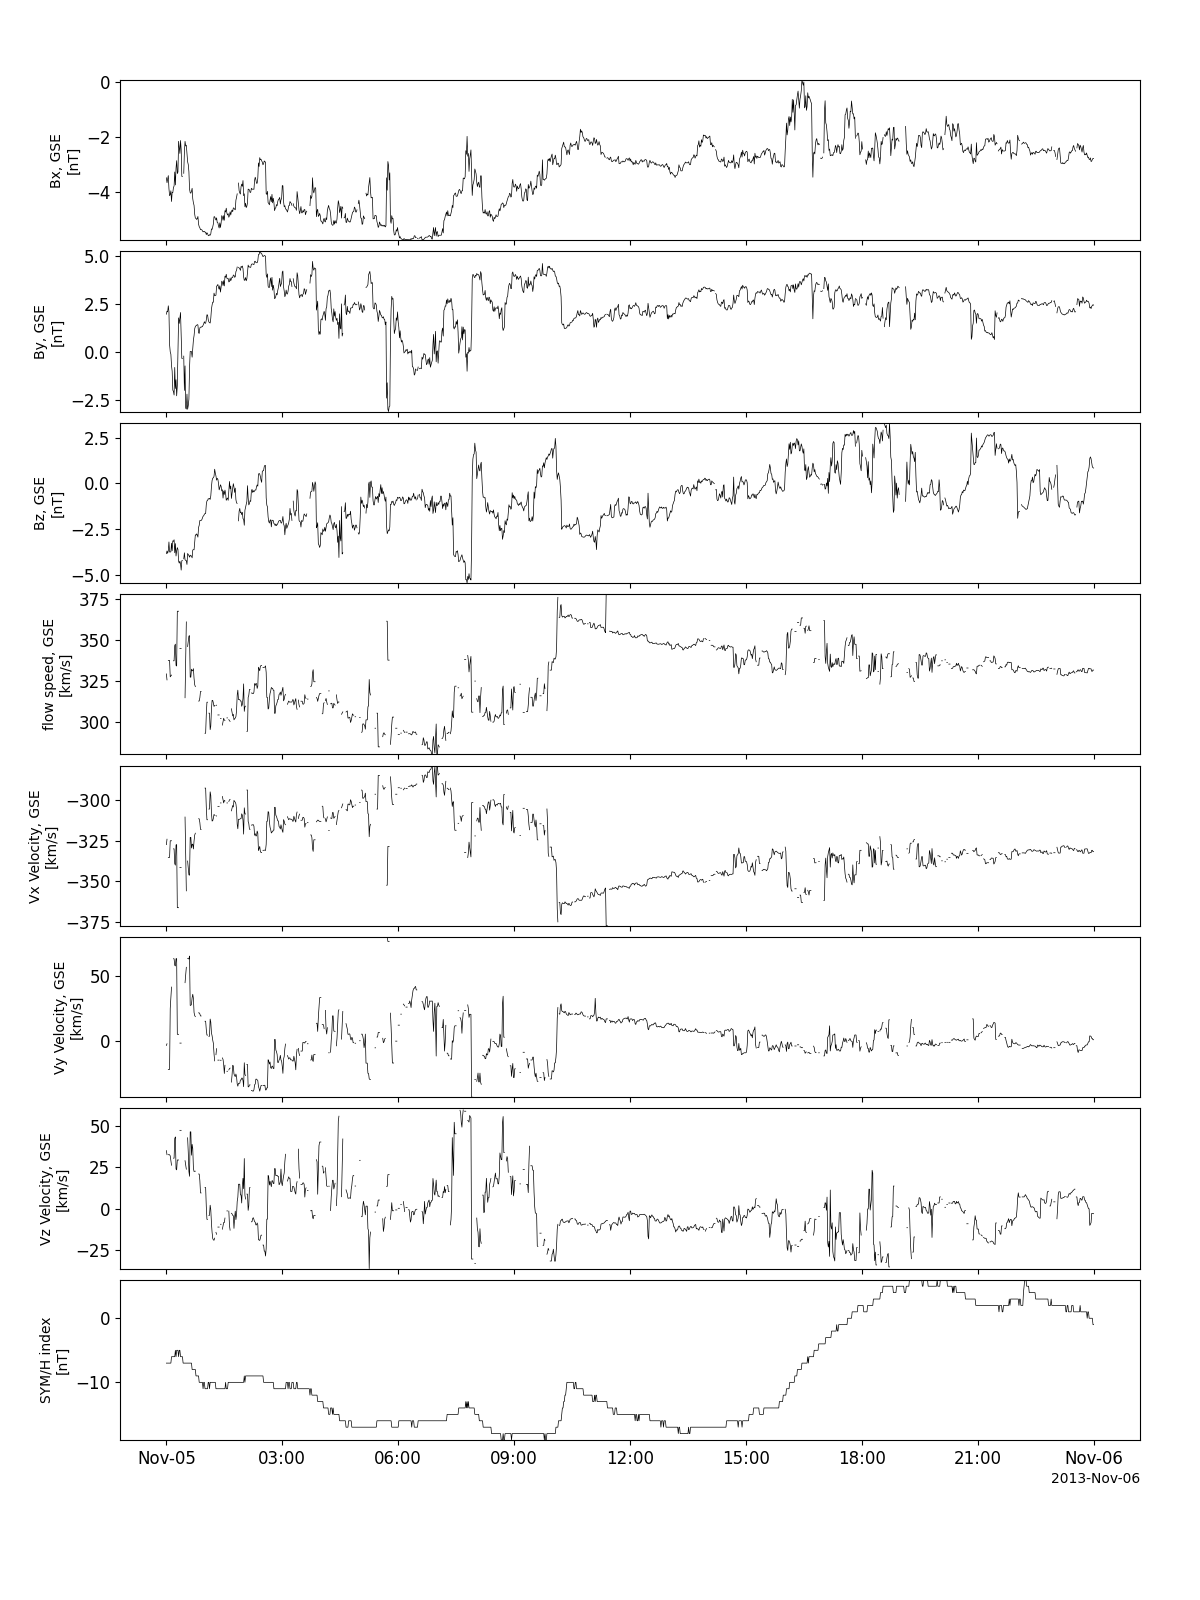
OMNI Solar Wind and magnetospheric indices
The pyspedas.projects.omni.data() routine can be used to load variables from the OMNIweb data set.
- pyspedas.projects.omni.data(trange=['2013-11-5', '2013-11-6'], datatype='1min', level='hro', prefix='', suffix='', get_support_data=False, get_ignore_data=False, varformat=None, varnames=[], downloadonly=False, notplot=False, no_update=False, time_clip=True, force_download=False)
Loads OMNI (Combined 1AU IP Data; Magnetic and Solar Indices) data; intended for internal use.
This function is a core component for data loading but is not meant to be called directly by users. Instead, users should utilize the wrapper function pyspedas.projects.omni.data to access this functionality.
- Parameters:
trange (
listofstr, optional) – Time range of interest specified as [‘starttime’, ‘endtime’] with the format ‘YYYY-MM-DD’ or ‘YYYY-MM-DD/hh:mm:ss’ to specify more or less than a day. default=[‘2013-11-5’, ‘2013-11-6’]datatype (
str, optional) – Data type; valid options: ‘1min’, ‘5min’, ‘hourly’. Default: ‘1min’.level (
str, optional) – Data level; valid options: ‘hro’, ‘hro2’. Default=’hro’prefix (
str, optional) – Prefix for the tplot variable names. By default, no prefix is added.suffix (
str, optional) – Suffix for the tplot variable names. By default, no suffix is added.get_support_data (
bool, optional) – If True, loads data with “VAR_TYPE” attribute value “support_data” into tplot. By default, only loads data with a “VAR_TYPE” attribute of “data”.get_ignore_data (
bool, optional) – If True, specific data types will be ignored during loading. This is especially used for hourly data where ignoring certain data is required.varformat (
str, optional) – The file variable formats to load into tplot. Wildcard character “*” is accepted. By default, all variables are loaded.varnames (
listofstr, optional) – List of variable names to load. If not specified, all data variables are loaded.downloadonly (
bool, optional) – If True, downloads the CDF files but does not load them into tplot variables.notplot (
bool, optional) – If True, returns the data in hash tables instead of creating tplot variables.no_update (
bool, optional) – If True, loads data only from the local cache.time_clip (
bool, optional) – If True, clips the variables to exactly the range specified in the trange parameter.force_download (
bool, optional) – Download file even if local version is more recent than server version Default: False
- Returns:
List of tplot variables created if notplot is False. Otherwise, returns a dictionary with data tables.
- Return type:
Examples
This function is not intended to be called directly.
Example
import pyspedas
from pyspedas import tplot
omni_vars = pyspedas.projects.omni.data(trange=['2013-11-5', '2013-11-6'])
tplot(['BX_GSE', 'BY_GSE', 'BZ_GSE', 'flow_speed', 'Vx', 'Vy', 'Vz', 'SYM_H'])