Magnetic Induction Coil Array (MICA)
The routines in this module can be used to load data from the Magnetic Induction Coil Array (MICA) mission.
Induction data
- pyspedas.projects.mica.induction(trange=['2019-02-01', '2019-02-02'], site=None, suffix='', get_support_data=False, varformat=None, varnames=[], downloadonly=False, notplot=False, no_update=False, time_clip=False)
Loads data from the Magnetic Induction Coil Array (MICA)
- Parameters:
trange (
listofstr, optional) – Time range of interest with the format [‘YYYY-MM-DD’,’YYYY-MM-DD’] or to specify more or less than a day [‘YYYY-MM-DD/hh:mm:ss’,’YYYY-MM-DD/hh:mm:ss’]. Defaults to [‘2019-02-01’, ‘2019-02-02’].site (
str, optional) – The site to load data for.suffix (
str, optional) – The tplot variable names will be given this suffix. Defaults to ‘’.get_support_data (
bool, optional) – Data with an attribute “VAR_TYPE” with a value of “support_data” will be loaded into tplot. By default, only loads in data with a “VAR_TYPE” attribute of “data”. Defaults to False.varformat (
str, optional) – The file variable formats to load into tplot. Wildcard character “*” is accepted. By default, all variables are loaded in. Defaults to None.varnames (
listofstr, optional) – List of variable names to load. If not specified, all data variables are loaded. Defaults to [].downloadonly (
bool, optional) – Set this flag to download the CDF files, but not load them into tplot variables. Defaults to False.notplot (
bool, optional) – Return the data in hash tables instead of creating tplot variables. Defaults to False.no_update (
bool, optional) – If set, only load data from your local cache. Defaults to False.time_clip (
bool, optional) – Time clip the variables to exactly the range specified in the trange keyword. Defaults to False.
- Returns:
List of tplot variables created. If downloadonly is set to True, the list of files downloaded will be returned instead.
- Return type:
Example
import pyspedas
from pyspedas import tplot
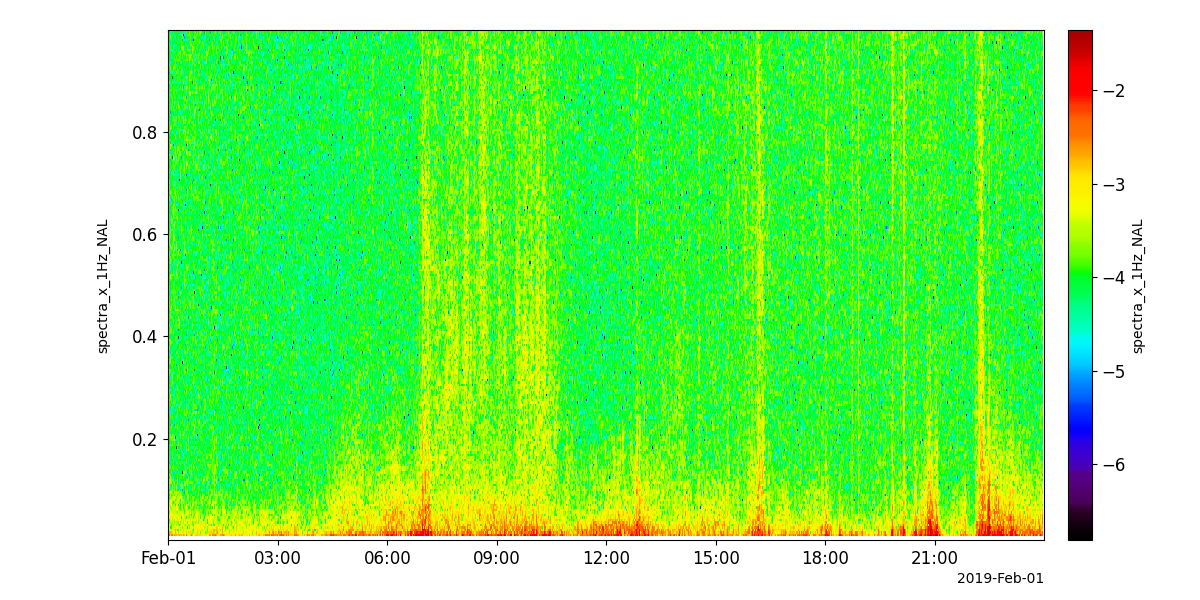
nal_vars = pyspedas.projects.mica.induction(site='NAL', trange=['2019-02-01','2019-02-02'])
tplot('spectra_x_1Hz_NAL')