Balloon Array for Radiation belt Relativistic Electron Losses (BARREL)
The routines in this module can be used to load data from the BARREL mission.
Data Types
Each Payload returns seven datatypes:
- Slow Spectra (sspc) - 256 channel, 32 second accumulation
- Medium Spectra (mspc) - 48 channel, 4 second accumulation
- Fast Spectra (fspc) - 4 channel (or 6 channel), 20Hz data
- Magnetometer (magn)
- Ephemeris (ephm)
- Rate Counters (rcnt)
- Housekeeping (hkpg)
Balloon identifiers
Balloons have a two-digit, alphanumeric identifier. The first digit is a number indicating campaign, the second is a letter indicating the flight. There have been seven BARREL campaigns, each with anywhere between 1 and 20 flights:
- 1a - 2013-01-28 - 2013-02-14
- 1b - 2013-01-02 - 2013-01-09
- 1c - 2013-01-16 - 2013-01-26
- 1d - 2013-01-04 - 2013-01-21
- 1g - 2013-01-14 - 2013-01-27
- 1h - 2013-01-19 - 2013-02-11
- 1i - 2013-01-09 - 2013-02-16
- 1j - 2013-01-01 - 2013-01-14
- 1k - 2013-01-05 - 2013-01-21
- 1m - 2013-01-06 - 2013-01-12
- 1n - 2013-01-08 - 2013-01-16
- 1o - 2013-01-09 - 2013-01-17
- 1q - 2013-01-20 - 2013-02-06
- 1r - 2013-01-21 - 2013-01-23
- 1s - 2013-01-22 - 2013-01-27
- 1t - 2013-01-24 - 2013-02-15
- 1u - 2013-01-26 - 2013-02-09
- 1v - 2013-01-30 - 2013-02-06
- 2a - 2014-01-16 - 2014-02-04
- 2b - 2014-01-17 - 2014-02-07
- 2c - 2014-01-20 - 2014-01-25
- 2d - 2014-01-01 - 2014-01-01
- 2e - 2014-01-27 - 2014-01-29
- 2f - 2014-02-01 - 2014-02-03
- 2i - 2013-12-31 - 2014-01-14
- 2k - 2014-01-04 - 2014-01-12
- 2l - 2014-01-06 - 2014-02-03
- 2m - 2014-01-11 - 2014-01-13
- 2n - 2014-01-18 - 2014-01-19
- 2o - 2014-01-26 - 2014-02-09
- 2p - 2014-01-30 - 2014-02-11
- 2q - 2014-02-02 - 2014-02-04
- 2t - 2013-01-27 - 2014-01-17
- 2w - 2013-12-31 - 2014-01-11
- 2x - 2014-01-04 - 2014-01-22
- 2y - 2014-01-11 - 2014-01-19
- 3a - 2015-08-10 - 2015-08-10
- 3b - 2015-08-13 - 2015-08-13
- 3c - 2015-08-17 - 2015-08-18
- 3d - 2015-08-19 - 2015-08-19
- 3e - 2015-08-21 - 2015-08-22
- 3f - 2015-08-25 - 2015-08-26
- 3g - 2015-08-25 - 2015-08-26
- 4a - 2016-08-13 - 2016-08-14
- 4b - 2016-08-16 - 2016-08-17
- 4c - 2016-08-21 - 2016-08-22
- 4d - 2016-08-21 - 2016-08-22
- 4e - 2016-08-24 - 2016-08-25
- 4f - 2016-08-28 - 2016-08-29
- 4g - 2016-08-29 - 2016-08-30
- 4h - 2016-08-30 - 2016-08-31
- 5a - 2018-06-25 - 2018-06-26
- 6a - 2018-02-09 - 2019-02-21
- 7a - 2019-12-29 - 2020-04-01
Examples
Data can be loaded using the wrapper functions for each data type:
import pyspedas
from pyspedas import tplot
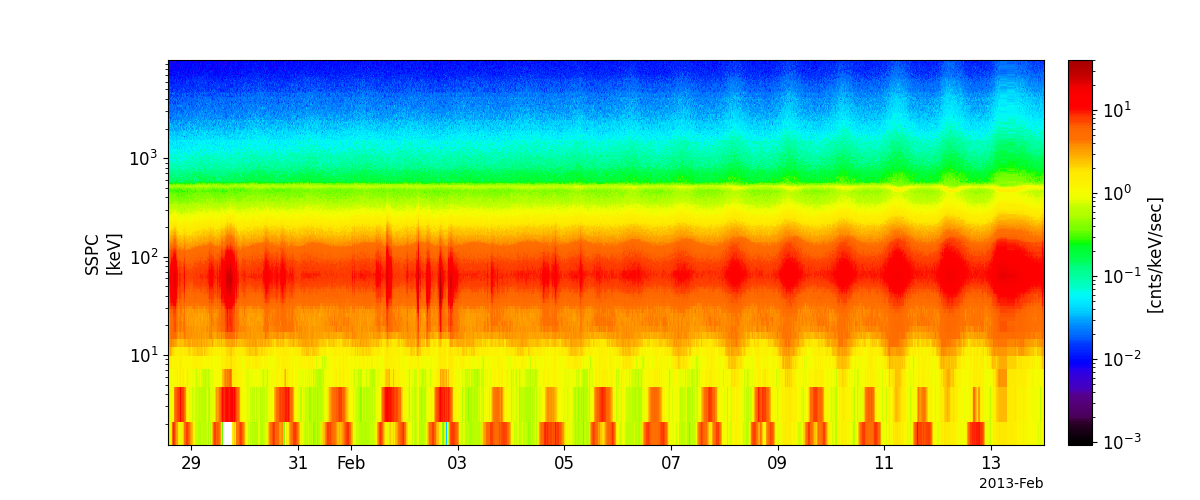
sspc_vars = pyspedas.projects.barrel.sspc(probe='1A', trange= ['2013-01-28', '2013-02-14'])
tplot('brl1A_SSPC')
Full example notebooks available at https://github.com/spedas/pyspedas_examples
Load Routines
- pyspedas.projects.barrel.sspc(trange=['2013-01-28', '2013-01-29'], probe='1A', downloadonly=False, prefix='', suffix='', no_update=False, time_clip=False, force_download=False)[source]
This function load data from BARREL Slow Specta (256 channels accumulated over 32 seconds)
- Parameters:
trange (
listofstr) – time range of interest [starttime, endtime] with the format ‘YYYY-MM-DD’,’YYYY-MM-DD’] or to specify more or less than a day [‘YYYY-MM-DD/hh:mm:ss’,’YYYY-MM-DD/hh:mm:ss’] Default: [‘2013-01-28’, ‘2013-01-29’]probe (
str) –Options:
'1a'...'1v'
'2a'...'2y'
'3a'...'3g'
'4a'...'4f'
'5a'
'6a'
'7a'
Default: ‘1A’
downloadonly (
bool) – Set this flag to download the CDF files, but not load them into tplot variables. Default: Falseprefix (
str) – This string will be prepended to the tplot variable names created. Default: ‘’suffix (
str) – This string will be appended to the tplot variable names created. Default: ‘’no_update (
bool) – If set, only load data from your local cache Default: Falsetime_clip (
bool) – Time clip the variables to exactly the range specified in the trange keyword Default: Falseforce_download (
bool) – Download file even if local version is more recent than server version Default: False
- Return type:
Listoftplot variables created.
Example:
>>> import pyspedas
>>> from pyspedas import tplot
>>> pyspedas.projects.barrel.fspc(trange=['2013-01-17', '2013-01-19'], probe='1D')
>>> tplot('brl1D_FSPC1')
- pyspedas.projects.barrel.mspc(trange=['2013-01-29', '2013-01-30'], probe='1A', downloadonly=False, prefix='', suffix='', no_update=False, time_clip=False, force_download=False)[source]
This function load data from BARREL Medium Spectra (48 channels accumulated over 4 seconds)
- Parameters:
trange (
listofstr) – time range of interest [starttime, endtime] with the format ‘YYYY-MM-DD’,’YYYY-MM-DD’] or to specify more or less than a day [‘YYYY-MM-DD/hh:mm:ss’,’YYYY-MM-DD/hh:mm:ss’] Default: [‘2013-01-29’,’2013-01-30’]probe (
str) –Options:
'1a'...'1v'
'2a'...'2y'
'3a'...'3g'
'4a'...'4f'
'5a'
'6a'
'7a'
Default: ‘1A’
downloadonly (
bool) – Set this flag to download the CDF files, but not load them into tplot variables. Default: Falseprefix (
str) – This string will be prepended to the tplot variable names created. Default: ‘’suffix (
str) – This string will be appended to the tplot variable names created. Default: ‘’no_update (
bool) – If set, only load data from your local cache Default: Falsetime_clip (
bool) – Time clip the variables to exactly the range specified in the trange keyword Default: Falseforce_download (
bool) – Download file even if local version is more recent than server version Default: False
- Return type:
Listoftplot variables created.
Example:
>>> import pyspedas
>>> from pyspedas import tplot
>>> pyspedas.projects.barrel.mspc(trange=['2013-01-29','2013-01-30'], probe='1A')
>>> tplot('brl1A_MSPC')
- pyspedas.projects.barrel.fspc(trange=['2013-01-29', '2013-01-30'], probe='1A', downloadonly=False, prefix='', suffix='', no_update=False, time_clip=False, force_download=False)[source]
This function load data from BARREL Fast Spectra (4 channels record at 20Hz)
- Parameters:
trange (
listofstr) – time range of interest [starttime, endtime] with the format ‘YYYY-MM-DD’,’YYYY-MM-DD’] or to specify more or less than a day [‘YYYY-MM-DD/hh:mm:ss’,’YYYY-MM-DD/hh:mm:ss’] Default: [‘2013-01-29’,’2013-01-30’]probe (
str) –Options:
'1a'...'1v'
'2a'...'2y'
'3a'...'3g'
'4a'...'4f'
'5a'
'6a'
'7a'
Default: ‘1A’
downloadonly (
bool) – Set this flag to download the CDF files, but not load them into tplot variables. Default: Falseprefix (
str) – This string will be prepended to the tplot variable names created. Default: ‘’suffix (
str) – This string will be appended to the tplot variable names created. Default: ‘’no_update (
bool) – If set, only load data from your local cache Default: Falsetime_clip (
bool) – Time clip the variables to exactly the range specified in the trange keyword Default: Falseforce_download (
bool) – Download file even if local version is more recent than server version Default: False
- Return type:
Listoftplot variables created.
Example:
>>> import pyspedas
>>> from pyspedas import tplot
>>> pyspedas.projects.barrel.fspc(trange=['2013-01-17', '2013-01-19'], probe='1D')
>>> tplot('brl1D_FSPC1')
- pyspedas.projects.barrel.magn(trange=['2013-01-29', '2013-01-30'], probe='1A', downloadonly=False, prefix='', suffix='', no_update=False, time_clip=False, force_download=False)[source]
This function load data from BARREL Magnetometer Data
- Parameters:
trange (
listofstr) – time range of interest [starttime, endtime] with the format ‘YYYY-MM-DD’,’YYYY-MM-DD’] or to specify more or less than a day [‘YYYY-MM-DD/hh:mm:ss’,’YYYY-MM-DD/hh:mm:ss’] Default: [‘2013-01-29’,’2013-01-30’]Options:
'1a'...'1v'
'2a'...'2y'
'3a'...'3g'
'4a'...'4f'
'5a'
'6a'
'7a'
Default: ‘1A’
downloadonly (
bool) – Set this flag to download the CDF files, but not load them into tplot variables. Default: Falseprefix (
str) – This string will be prepended to the tplot variable names created. Default: ‘’suffix (
str) – This string will be appended to the tplot variable names created. Default: ‘’no_update (
bool) – If set, only load data from your local cache Default: Falsetime_clip (
bool) – Time clip the variables to exactly the range specified in the trange keyword Default: Falseforce_download (
bool) – Download file even if local version is more recent than server version Default: False
- Return type:
Listoftplot variables created.
Example:
>>> import pyspedas
>>> from pyspedas import tplot
>>> pyspedas.projects.barrel.magn(trange=['2013-01-29','2013-01-30'], probe='1A')
>>> tplot('brl1A_Total')
- pyspedas.projects.barrel.ephm(trange=['2013-01-29', '2013-01-30'], probe='1A', downloadonly=False, prefix='', suffix='', no_update=False, time_clip=False, force_download=False)[source]
This function load data from BARREL Ephemeris (GPS data and magnetic coordinates)
- Parameters:
trange (
listofstr) – time range of interest [starttime, endtime] with the format ‘YYYY-MM-DD’,’YYYY-MM-DD’] or to specify more or less than a day [‘YYYY-MM-DD/hh:mm:ss’,’YYYY-MM-DD/hh:mm:ss’] Default: [‘2013-01-29’,’2013-01-30’]probe (
str) –Options:
'1a'...'1v'
'2a'...'2y'
'3a'...'3g'
'4a'...'4f'
'5a'
'6a'
'7a'
Default: ‘1A’
downloadonly (
bool) – Set this flag to download the CDF files, but not load them into tplot variables. Default: Falseprefix (
str) – This string will be prepended to the tplot variable names created. Default: ‘’suffix (
str) – This string will be appended to the tplot variable names created. Default: ‘’no_update (
bool) – If set, only load data from your local cache Default: Falsetime_clip (
bool) – Time clip the variables to exactly the range specified in the trange keyword Default: Falseforce_download (
bool) – Download file even if local version is more recent than server version Default: False
- Return type:
Listoftplot variables created.
Example:
>>> import pyspedas
>>> from pyspedas import tplot
>>> pyspedas.projects.barrel.ephm(trange=['2013-01-29','2013-01-30'], probe='1A')
>>> tplot('brl1A_GPS_Lat')
- pyspedas.projects.barrel.rcnt(trange=['2013-01-29', '2013-01-30'], probe='1A', downloadonly=False, prefix='', suffix='', no_update=False, time_clip=False, force_download=False)[source]
This function load data from BARREL Rate Counters (Scintillating statistics)
- Parameters:
trange (
listofstr) – time range of interest [starttime, endtime] with the format ‘YYYY-MM-DD’,’YYYY-MM-DD’] or to specify more or less than a day [‘YYYY-MM-DD/hh:mm:ss’,’YYYY-MM-DD/hh:mm:ss’] Default: [‘2013-01-29’,’2013-01-30’]probe (
str) –Options:
'1a'...'1v'
'2a'...'2y'
'3a'...'3g'
'4a'...'4f'
'5a'
'6a'
'7a'
Default: ‘1A’
downloadonly (
bool) – Set this flag to download the CDF files, but not load them into tplot variables. Default: Falseprefix (
str) – This string will be prepended to the tplot variable names created. Default: ‘’suffix (
str) – This string will be appended to the tplot variable names created. Default: ‘’no_update (
bool) – If set, only load data from your local cache Default: Falsetime_clip (
bool) – Time clip the variables to exactly the range specified in the trange keyword Default: Falseforce_download (
bool) – Download file even if local version is more recent than server version Default: False
- Return type:
Listoftplot variables created.
Example:
>>> import pyspedas
>>> from pyspedas import tplot
>>> pyspedas.projects.barrel.rcnt(trange=['2013-01-29','2013-01-30'], probe='1A')
>>> tplot('brl1A_LowLevel')
- pyspedas.projects.barrel.hkpg(trange=['2013-01-29', '2013-01-30'], probe='1A', downloadonly=False, prefix='', suffix='', no_update=False, time_clip=False, force_download=False)[source]
This function load data from BARREL Housekeeping (Voltages, currents, temperatures)
- Parameters:
trange (
listofstr) – time range of interest [starttime, endtime] with the format ‘YYYY-MM-DD’,’YYYY-MM-DD’] or to specify more or less than a day [‘YYYY-MM-DD/hh:mm:ss’,’YYYY-MM-DD/hh:mm:ss’] Default: [‘2013-01-29’,’2013-01-30’]probe (
str) –Options:
'1a'...'1v'
'2a'...'2y'
'3a'...'3g'
'4a'...'4f'
'5a'
'6a'
'7a'
Default: ‘1A’
downloadonly (
bool) – Set this flag to download the CDF files, but not load them into tplot variables. Default: Falseprefix (
str) – This string will be prepended to the tplot variable names created. Default: ‘’suffix (
str) – This string will be appended to the tplot variable names created. Default: ‘’no_update (
bool) – If set, only load data from your local cache Default: Falsetime_clip (
bool) – Time clip the variables to exactly the range specified in the trange keyword Default: Falseforce_download (
bool) – Download file even if local version is more recent than server version Default: False
- Return type:
Listoftplot variables created.
Example:
>>> import pyspedas
>>> from pyspedas import tplot
>>> pyspedas.projects.barrel.hkpg(trange=['2013-01-29','2013-01-30'], probe='1A')
>>> tplot('brl1A_V1_Battery')