Geostationary Operational Environmental Satellite (GOES)
The routines in this module can be used to load data from the Geostationary Operational Environmental Satellite (GOES) mission.
Magnetometer (FGM)
- pyspedas.projects.goes.fgm(trange=['2013-11-05', '2013-11-06 12:00:00'], probe='15', instrument='fgm', datatype='1min', prefix='', suffix='', downloadonly=False, no_update=False, time_clip=True, force_download=False, goes_r=False)
Load GOES L2 data.
- Parameters:
trange (
listofstr) – Time range of interest [‘YYYY-MM-DD’, ‘YYYY-MM-DD’] or to specify more or less than a day [‘YYYY-MM-DD/hh:mm:ss’, ‘YYYY-MM-DD/hh:mm:ss’].probe (
str,int, orlistofstr/int) – GOES spacecraft number(s), e.g., probe=15.instrument (
strorlistofstr) – Name of the instrument. For GOES 8-15: ‘fgm’, ‘eps’, ‘epead’, ‘maged’, ‘magpd’, ‘hepad’, ‘xrs’. For GOES-R 16-18: ‘euvs’, ‘xrs’, ‘mag’, ‘mpsh’, ‘sgps’.datatype (
str) – Data type; usually instrument resolution, depends on the instrument (default ‘1min’). Valid for GOES 8-15: ‘hi’, ‘low’, ‘full’, ‘avg’, ‘1min’, ‘5min’. Valid for GOES-R 16-18: ‘hi’, ‘low’, ‘full’, ‘avg’, and other options.prefix (
str, optional) – Prefix to add to the tplot variable names. By default, no prefix is added. If prefix is ‘probename’, then the name will be used, for example, ‘g16’.suffix (
str, optional) – Suffix to add to the tplot variable names. By default, no suffix is added.downloadonly (
bool, optional) – If True, downloads the CDF files without loading them into tplot variables. Default is False.no_update (
bool, optional) – If True, only loads data from the local cache. Default is False.time_clip (
bool, optional) – If True (the default), clips the variables to exactly the range specified in the trange keyword.force_download (
bool, optional) – If True, downloads the file even if a newer version exists locally. Default is False.goes_r (
bool, optional) – If True, loads reprocessed data in GOES-R file format, for probes 8-15. Default is False, loads original data for probes 8-15.
- Returns:
List of tplot variables created or list of filenames downloaded.
- Return type:
Notes
This function can be used to load data from three sets of GOES data:
1. GOES 1-15, original netcdf format: https://www.ncei.noaa.gov/data/goes-space-environment-monitor/access/avg/
2. GOES-R 16-19, revised netcdf format: https://data.ngdc.noaa.gov/platforms/solar-space-observing-satellites/goes/
3. GOES 8-15, reprocessed data, GOES-R (revised) netcdf format (hires mag, and xrs only): for this, use the goes_r=True option https://www.ncei.noaa.gov/data/goes-space-environment-monitor/access/science/
Examples
>>> from pyspedas.projects.goes import load
>>> trange = ['2019-01-01', '2019-01-02']
>>> vars = load(trange=trange, probe='15', instrument='fgm', datatype='1min', time_clip=True)
>>> print(vars)
['g15_fgm_BX_1_QUAL_FLAG', 'g15_fgm_BX_1_NUM_PTS', 'g15_fgm_BX_1', ...]
(the result is a list of 66 variables)
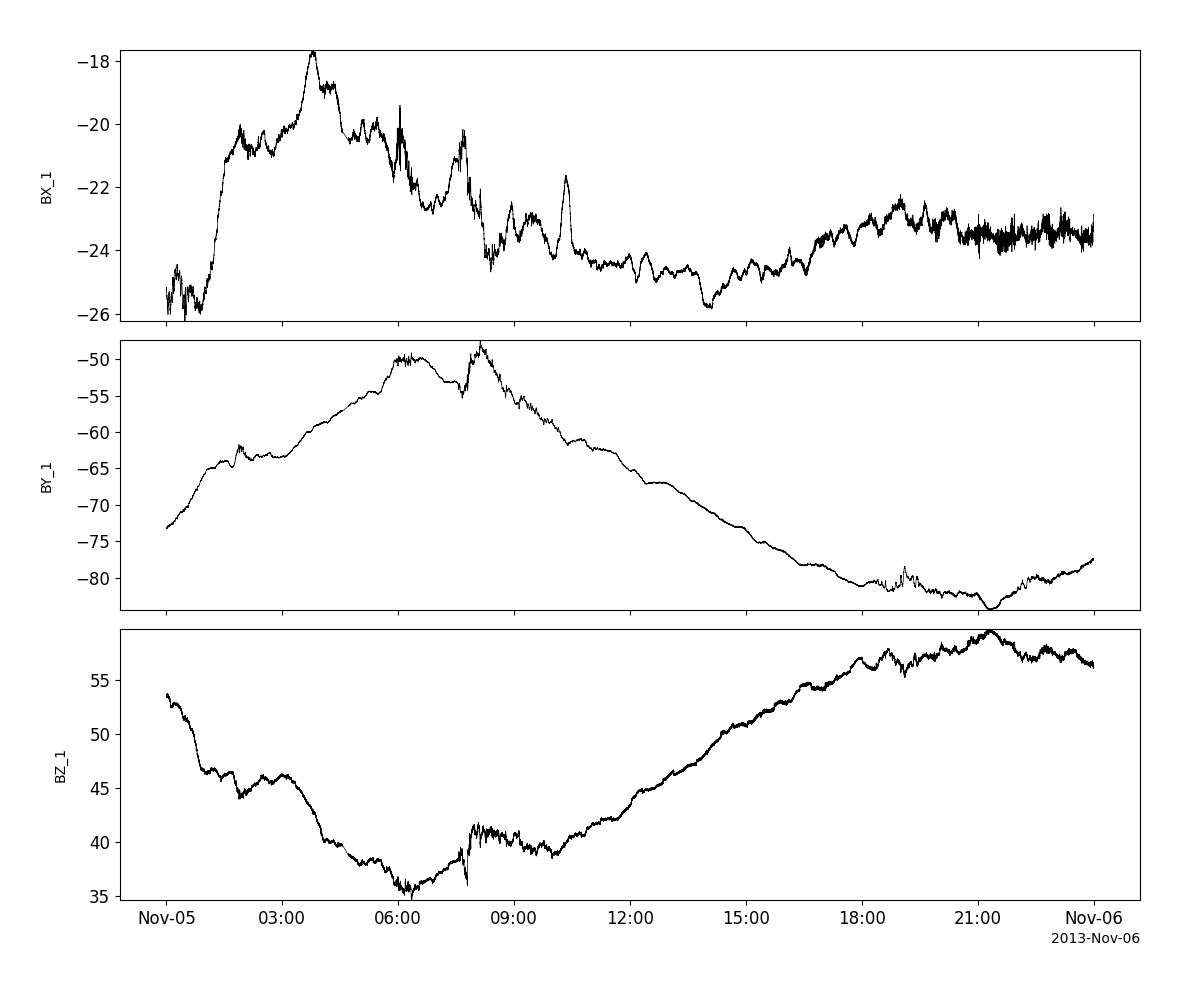
Example
import pyspedas
from pyspedas import tplot
mag_vars = pyspedas.projects.goes.fgm(trange=['2013-11-5', '2013-11-6'], datatype='512ms')
tplot(['BX_1', 'BY_1', 'BZ_1'])
EPS
- pyspedas.projects.goes.eps(trange=['2013-11-05', '2013-11-06 12:00:00'], probe='15', instrument='fgm', datatype='1min', prefix='', suffix='', downloadonly=False, no_update=False, time_clip=True, force_download=False, goes_r=False)
Load GOES L2 data.
- Parameters:
trange (
listofstr) – Time range of interest [‘YYYY-MM-DD’, ‘YYYY-MM-DD’] or to specify more or less than a day [‘YYYY-MM-DD/hh:mm:ss’, ‘YYYY-MM-DD/hh:mm:ss’].probe (
str,int, orlistofstr/int) – GOES spacecraft number(s), e.g., probe=15.instrument (
strorlistofstr) – Name of the instrument. For GOES 8-15: ‘fgm’, ‘eps’, ‘epead’, ‘maged’, ‘magpd’, ‘hepad’, ‘xrs’. For GOES-R 16-18: ‘euvs’, ‘xrs’, ‘mag’, ‘mpsh’, ‘sgps’.datatype (
str) – Data type; usually instrument resolution, depends on the instrument (default ‘1min’). Valid for GOES 8-15: ‘hi’, ‘low’, ‘full’, ‘avg’, ‘1min’, ‘5min’. Valid for GOES-R 16-18: ‘hi’, ‘low’, ‘full’, ‘avg’, and other options.prefix (
str, optional) – Prefix to add to the tplot variable names. By default, no prefix is added. If prefix is ‘probename’, then the name will be used, for example, ‘g16’.suffix (
str, optional) – Suffix to add to the tplot variable names. By default, no suffix is added.downloadonly (
bool, optional) – If True, downloads the CDF files without loading them into tplot variables. Default is False.no_update (
bool, optional) – If True, only loads data from the local cache. Default is False.time_clip (
bool, optional) – If True (the default), clips the variables to exactly the range specified in the trange keyword.force_download (
bool, optional) – If True, downloads the file even if a newer version exists locally. Default is False.goes_r (
bool, optional) – If True, loads reprocessed data in GOES-R file format, for probes 8-15. Default is False, loads original data for probes 8-15.
- Returns:
List of tplot variables created or list of filenames downloaded.
- Return type:
Notes
This function can be used to load data from three sets of GOES data:
1. GOES 1-15, original netcdf format: https://www.ncei.noaa.gov/data/goes-space-environment-monitor/access/avg/
2. GOES-R 16-19, revised netcdf format: https://data.ngdc.noaa.gov/platforms/solar-space-observing-satellites/goes/
3. GOES 8-15, reprocessed data, GOES-R (revised) netcdf format (hires mag, and xrs only): for this, use the goes_r=True option https://www.ncei.noaa.gov/data/goes-space-environment-monitor/access/science/
Examples
>>> from pyspedas.projects.goes import load
>>> trange = ['2019-01-01', '2019-01-02']
>>> vars = load(trange=trange, probe='15', instrument='fgm', datatype='1min', time_clip=True)
>>> print(vars)
['g15_fgm_BX_1_QUAL_FLAG', 'g15_fgm_BX_1_NUM_PTS', 'g15_fgm_BX_1', ...]
(the result is a list of 66 variables)
EPEAD
- pyspedas.projects.goes.epead(trange=['2013-11-05', '2013-11-06 12:00:00'], probe='15', instrument='fgm', datatype='1min', prefix='', suffix='', downloadonly=False, no_update=False, time_clip=True, force_download=False, goes_r=False)
Load GOES L2 data.
- Parameters:
trange (
listofstr) – Time range of interest [‘YYYY-MM-DD’, ‘YYYY-MM-DD’] or to specify more or less than a day [‘YYYY-MM-DD/hh:mm:ss’, ‘YYYY-MM-DD/hh:mm:ss’].probe (
str,int, orlistofstr/int) – GOES spacecraft number(s), e.g., probe=15.instrument (
strorlistofstr) – Name of the instrument. For GOES 8-15: ‘fgm’, ‘eps’, ‘epead’, ‘maged’, ‘magpd’, ‘hepad’, ‘xrs’. For GOES-R 16-18: ‘euvs’, ‘xrs’, ‘mag’, ‘mpsh’, ‘sgps’.datatype (
str) – Data type; usually instrument resolution, depends on the instrument (default ‘1min’). Valid for GOES 8-15: ‘hi’, ‘low’, ‘full’, ‘avg’, ‘1min’, ‘5min’. Valid for GOES-R 16-18: ‘hi’, ‘low’, ‘full’, ‘avg’, and other options.prefix (
str, optional) – Prefix to add to the tplot variable names. By default, no prefix is added. If prefix is ‘probename’, then the name will be used, for example, ‘g16’.suffix (
str, optional) – Suffix to add to the tplot variable names. By default, no suffix is added.downloadonly (
bool, optional) – If True, downloads the CDF files without loading them into tplot variables. Default is False.no_update (
bool, optional) – If True, only loads data from the local cache. Default is False.time_clip (
bool, optional) – If True (the default), clips the variables to exactly the range specified in the trange keyword.force_download (
bool, optional) – If True, downloads the file even if a newer version exists locally. Default is False.goes_r (
bool, optional) – If True, loads reprocessed data in GOES-R file format, for probes 8-15. Default is False, loads original data for probes 8-15.
- Returns:
List of tplot variables created or list of filenames downloaded.
- Return type:
Notes
This function can be used to load data from three sets of GOES data:
1. GOES 1-15, original netcdf format: https://www.ncei.noaa.gov/data/goes-space-environment-monitor/access/avg/
2. GOES-R 16-19, revised netcdf format: https://data.ngdc.noaa.gov/platforms/solar-space-observing-satellites/goes/
3. GOES 8-15, reprocessed data, GOES-R (revised) netcdf format (hires mag, and xrs only): for this, use the goes_r=True option https://www.ncei.noaa.gov/data/goes-space-environment-monitor/access/science/
Examples
>>> from pyspedas.projects.goes import load
>>> trange = ['2019-01-01', '2019-01-02']
>>> vars = load(trange=trange, probe='15', instrument='fgm', datatype='1min', time_clip=True)
>>> print(vars)
['g15_fgm_BX_1_QUAL_FLAG', 'g15_fgm_BX_1_NUM_PTS', 'g15_fgm_BX_1', ...]
(the result is a list of 66 variables)
EUVS
- pyspedas.projects.goes.euvs(trange=['2013-11-05', '2013-11-06 12:00:00'], probe='15', instrument='fgm', datatype='1min', prefix='', suffix='', downloadonly=False, no_update=False, time_clip=True, force_download=False, goes_r=False)
Load GOES L2 data.
- Parameters:
trange (
listofstr) – Time range of interest [‘YYYY-MM-DD’, ‘YYYY-MM-DD’] or to specify more or less than a day [‘YYYY-MM-DD/hh:mm:ss’, ‘YYYY-MM-DD/hh:mm:ss’].probe (
str,int, orlistofstr/int) – GOES spacecraft number(s), e.g., probe=15.instrument (
strorlistofstr) – Name of the instrument. For GOES 8-15: ‘fgm’, ‘eps’, ‘epead’, ‘maged’, ‘magpd’, ‘hepad’, ‘xrs’. For GOES-R 16-18: ‘euvs’, ‘xrs’, ‘mag’, ‘mpsh’, ‘sgps’.datatype (
str) – Data type; usually instrument resolution, depends on the instrument (default ‘1min’). Valid for GOES 8-15: ‘hi’, ‘low’, ‘full’, ‘avg’, ‘1min’, ‘5min’. Valid for GOES-R 16-18: ‘hi’, ‘low’, ‘full’, ‘avg’, and other options.prefix (
str, optional) – Prefix to add to the tplot variable names. By default, no prefix is added. If prefix is ‘probename’, then the name will be used, for example, ‘g16’.suffix (
str, optional) – Suffix to add to the tplot variable names. By default, no suffix is added.downloadonly (
bool, optional) – If True, downloads the CDF files without loading them into tplot variables. Default is False.no_update (
bool, optional) – If True, only loads data from the local cache. Default is False.time_clip (
bool, optional) – If True (the default), clips the variables to exactly the range specified in the trange keyword.force_download (
bool, optional) – If True, downloads the file even if a newer version exists locally. Default is False.goes_r (
bool, optional) – If True, loads reprocessed data in GOES-R file format, for probes 8-15. Default is False, loads original data for probes 8-15.
- Returns:
List of tplot variables created or list of filenames downloaded.
- Return type:
Notes
This function can be used to load data from three sets of GOES data:
1. GOES 1-15, original netcdf format: https://www.ncei.noaa.gov/data/goes-space-environment-monitor/access/avg/
2. GOES-R 16-19, revised netcdf format: https://data.ngdc.noaa.gov/platforms/solar-space-observing-satellites/goes/
3. GOES 8-15, reprocessed data, GOES-R (revised) netcdf format (hires mag, and xrs only): for this, use the goes_r=True option https://www.ncei.noaa.gov/data/goes-space-environment-monitor/access/science/
Examples
>>> from pyspedas.projects.goes import load
>>> trange = ['2019-01-01', '2019-01-02']
>>> vars = load(trange=trange, probe='15', instrument='fgm', datatype='1min', time_clip=True)
>>> print(vars)
['g15_fgm_BX_1_QUAL_FLAG', 'g15_fgm_BX_1_NUM_PTS', 'g15_fgm_BX_1', ...]
(the result is a list of 66 variables)
HEPAD
- pyspedas.projects.goes.hepad(trange=['2013-11-05', '2013-11-06 12:00:00'], probe='15', instrument='fgm', datatype='1min', prefix='', suffix='', downloadonly=False, no_update=False, time_clip=True, force_download=False, goes_r=False)
Load GOES L2 data.
- Parameters:
trange (
listofstr) – Time range of interest [‘YYYY-MM-DD’, ‘YYYY-MM-DD’] or to specify more or less than a day [‘YYYY-MM-DD/hh:mm:ss’, ‘YYYY-MM-DD/hh:mm:ss’].probe (
str,int, orlistofstr/int) – GOES spacecraft number(s), e.g., probe=15.instrument (
strorlistofstr) – Name of the instrument. For GOES 8-15: ‘fgm’, ‘eps’, ‘epead’, ‘maged’, ‘magpd’, ‘hepad’, ‘xrs’. For GOES-R 16-18: ‘euvs’, ‘xrs’, ‘mag’, ‘mpsh’, ‘sgps’.datatype (
str) – Data type; usually instrument resolution, depends on the instrument (default ‘1min’). Valid for GOES 8-15: ‘hi’, ‘low’, ‘full’, ‘avg’, ‘1min’, ‘5min’. Valid for GOES-R 16-18: ‘hi’, ‘low’, ‘full’, ‘avg’, and other options.prefix (
str, optional) – Prefix to add to the tplot variable names. By default, no prefix is added. If prefix is ‘probename’, then the name will be used, for example, ‘g16’.suffix (
str, optional) – Suffix to add to the tplot variable names. By default, no suffix is added.downloadonly (
bool, optional) – If True, downloads the CDF files without loading them into tplot variables. Default is False.no_update (
bool, optional) – If True, only loads data from the local cache. Default is False.time_clip (
bool, optional) – If True (the default), clips the variables to exactly the range specified in the trange keyword.force_download (
bool, optional) – If True, downloads the file even if a newer version exists locally. Default is False.goes_r (
bool, optional) – If True, loads reprocessed data in GOES-R file format, for probes 8-15. Default is False, loads original data for probes 8-15.
- Returns:
List of tplot variables created or list of filenames downloaded.
- Return type:
Notes
This function can be used to load data from three sets of GOES data:
1. GOES 1-15, original netcdf format: https://www.ncei.noaa.gov/data/goes-space-environment-monitor/access/avg/
2. GOES-R 16-19, revised netcdf format: https://data.ngdc.noaa.gov/platforms/solar-space-observing-satellites/goes/
3. GOES 8-15, reprocessed data, GOES-R (revised) netcdf format (hires mag, and xrs only): for this, use the goes_r=True option https://www.ncei.noaa.gov/data/goes-space-environment-monitor/access/science/
Examples
>>> from pyspedas.projects.goes import load
>>> trange = ['2019-01-01', '2019-01-02']
>>> vars = load(trange=trange, probe='15', instrument='fgm', datatype='1min', time_clip=True)
>>> print(vars)
['g15_fgm_BX_1_QUAL_FLAG', 'g15_fgm_BX_1_NUM_PTS', 'g15_fgm_BX_1', ...]
(the result is a list of 66 variables)
MAG
- pyspedas.projects.goes.mag(trange=['2013-11-05', '2013-11-06 12:00:00'], probe='15', instrument='fgm', datatype='1min', prefix='', suffix='', downloadonly=False, no_update=False, time_clip=True, force_download=False, goes_r=False)
Load GOES L2 data.
- Parameters:
trange (
listofstr) – Time range of interest [‘YYYY-MM-DD’, ‘YYYY-MM-DD’] or to specify more or less than a day [‘YYYY-MM-DD/hh:mm:ss’, ‘YYYY-MM-DD/hh:mm:ss’].probe (
str,int, orlistofstr/int) – GOES spacecraft number(s), e.g., probe=15.instrument (
strorlistofstr) – Name of the instrument. For GOES 8-15: ‘fgm’, ‘eps’, ‘epead’, ‘maged’, ‘magpd’, ‘hepad’, ‘xrs’. For GOES-R 16-18: ‘euvs’, ‘xrs’, ‘mag’, ‘mpsh’, ‘sgps’.datatype (
str) – Data type; usually instrument resolution, depends on the instrument (default ‘1min’). Valid for GOES 8-15: ‘hi’, ‘low’, ‘full’, ‘avg’, ‘1min’, ‘5min’. Valid for GOES-R 16-18: ‘hi’, ‘low’, ‘full’, ‘avg’, and other options.prefix (
str, optional) – Prefix to add to the tplot variable names. By default, no prefix is added. If prefix is ‘probename’, then the name will be used, for example, ‘g16’.suffix (
str, optional) – Suffix to add to the tplot variable names. By default, no suffix is added.downloadonly (
bool, optional) – If True, downloads the CDF files without loading them into tplot variables. Default is False.no_update (
bool, optional) – If True, only loads data from the local cache. Default is False.time_clip (
bool, optional) – If True (the default), clips the variables to exactly the range specified in the trange keyword.force_download (
bool, optional) – If True, downloads the file even if a newer version exists locally. Default is False.goes_r (
bool, optional) – If True, loads reprocessed data in GOES-R file format, for probes 8-15. Default is False, loads original data for probes 8-15.
- Returns:
List of tplot variables created or list of filenames downloaded.
- Return type:
Notes
This function can be used to load data from three sets of GOES data:
1. GOES 1-15, original netcdf format: https://www.ncei.noaa.gov/data/goes-space-environment-monitor/access/avg/
2. GOES-R 16-19, revised netcdf format: https://data.ngdc.noaa.gov/platforms/solar-space-observing-satellites/goes/
3. GOES 8-15, reprocessed data, GOES-R (revised) netcdf format (hires mag, and xrs only): for this, use the goes_r=True option https://www.ncei.noaa.gov/data/goes-space-environment-monitor/access/science/
Examples
>>> from pyspedas.projects.goes import load
>>> trange = ['2019-01-01', '2019-01-02']
>>> vars = load(trange=trange, probe='15', instrument='fgm', datatype='1min', time_clip=True)
>>> print(vars)
['g15_fgm_BX_1_QUAL_FLAG', 'g15_fgm_BX_1_NUM_PTS', 'g15_fgm_BX_1', ...]
(the result is a list of 66 variables)
MPSH
- pyspedas.projects.goes.mpsh(trange=['2013-11-05', '2013-11-06 12:00:00'], probe='15', instrument='fgm', datatype='1min', prefix='', suffix='', downloadonly=False, no_update=False, time_clip=True, force_download=False, goes_r=False)
Load GOES L2 data.
- Parameters:
trange (
listofstr) – Time range of interest [‘YYYY-MM-DD’, ‘YYYY-MM-DD’] or to specify more or less than a day [‘YYYY-MM-DD/hh:mm:ss’, ‘YYYY-MM-DD/hh:mm:ss’].probe (
str,int, orlistofstr/int) – GOES spacecraft number(s), e.g., probe=15.instrument (
strorlistofstr) – Name of the instrument. For GOES 8-15: ‘fgm’, ‘eps’, ‘epead’, ‘maged’, ‘magpd’, ‘hepad’, ‘xrs’. For GOES-R 16-18: ‘euvs’, ‘xrs’, ‘mag’, ‘mpsh’, ‘sgps’.datatype (
str) – Data type; usually instrument resolution, depends on the instrument (default ‘1min’). Valid for GOES 8-15: ‘hi’, ‘low’, ‘full’, ‘avg’, ‘1min’, ‘5min’. Valid for GOES-R 16-18: ‘hi’, ‘low’, ‘full’, ‘avg’, and other options.prefix (
str, optional) – Prefix to add to the tplot variable names. By default, no prefix is added. If prefix is ‘probename’, then the name will be used, for example, ‘g16’.suffix (
str, optional) – Suffix to add to the tplot variable names. By default, no suffix is added.downloadonly (
bool, optional) – If True, downloads the CDF files without loading them into tplot variables. Default is False.no_update (
bool, optional) – If True, only loads data from the local cache. Default is False.time_clip (
bool, optional) – If True (the default), clips the variables to exactly the range specified in the trange keyword.force_download (
bool, optional) – If True, downloads the file even if a newer version exists locally. Default is False.goes_r (
bool, optional) – If True, loads reprocessed data in GOES-R file format, for probes 8-15. Default is False, loads original data for probes 8-15.
- Returns:
List of tplot variables created or list of filenames downloaded.
- Return type:
Notes
This function can be used to load data from three sets of GOES data:
1. GOES 1-15, original netcdf format: https://www.ncei.noaa.gov/data/goes-space-environment-monitor/access/avg/
2. GOES-R 16-19, revised netcdf format: https://data.ngdc.noaa.gov/platforms/solar-space-observing-satellites/goes/
3. GOES 8-15, reprocessed data, GOES-R (revised) netcdf format (hires mag, and xrs only): for this, use the goes_r=True option https://www.ncei.noaa.gov/data/goes-space-environment-monitor/access/science/
Examples
>>> from pyspedas.projects.goes import load
>>> trange = ['2019-01-01', '2019-01-02']
>>> vars = load(trange=trange, probe='15', instrument='fgm', datatype='1min', time_clip=True)
>>> print(vars)
['g15_fgm_BX_1_QUAL_FLAG', 'g15_fgm_BX_1_NUM_PTS', 'g15_fgm_BX_1', ...]
(the result is a list of 66 variables)
MAGED
- pyspedas.projects.goes.maged(trange=['2013-11-05', '2013-11-06 12:00:00'], probe='15', instrument='fgm', datatype='1min', prefix='', suffix='', downloadonly=False, no_update=False, time_clip=True, force_download=False, goes_r=False)
Load GOES L2 data.
- Parameters:
trange (
listofstr) – Time range of interest [‘YYYY-MM-DD’, ‘YYYY-MM-DD’] or to specify more or less than a day [‘YYYY-MM-DD/hh:mm:ss’, ‘YYYY-MM-DD/hh:mm:ss’].probe (
str,int, orlistofstr/int) – GOES spacecraft number(s), e.g., probe=15.instrument (
strorlistofstr) – Name of the instrument. For GOES 8-15: ‘fgm’, ‘eps’, ‘epead’, ‘maged’, ‘magpd’, ‘hepad’, ‘xrs’. For GOES-R 16-18: ‘euvs’, ‘xrs’, ‘mag’, ‘mpsh’, ‘sgps’.datatype (
str) – Data type; usually instrument resolution, depends on the instrument (default ‘1min’). Valid for GOES 8-15: ‘hi’, ‘low’, ‘full’, ‘avg’, ‘1min’, ‘5min’. Valid for GOES-R 16-18: ‘hi’, ‘low’, ‘full’, ‘avg’, and other options.prefix (
str, optional) – Prefix to add to the tplot variable names. By default, no prefix is added. If prefix is ‘probename’, then the name will be used, for example, ‘g16’.suffix (
str, optional) – Suffix to add to the tplot variable names. By default, no suffix is added.downloadonly (
bool, optional) – If True, downloads the CDF files without loading them into tplot variables. Default is False.no_update (
bool, optional) – If True, only loads data from the local cache. Default is False.time_clip (
bool, optional) – If True (the default), clips the variables to exactly the range specified in the trange keyword.force_download (
bool, optional) – If True, downloads the file even if a newer version exists locally. Default is False.goes_r (
bool, optional) – If True, loads reprocessed data in GOES-R file format, for probes 8-15. Default is False, loads original data for probes 8-15.
- Returns:
List of tplot variables created or list of filenames downloaded.
- Return type:
Notes
This function can be used to load data from three sets of GOES data:
1. GOES 1-15, original netcdf format: https://www.ncei.noaa.gov/data/goes-space-environment-monitor/access/avg/
2. GOES-R 16-19, revised netcdf format: https://data.ngdc.noaa.gov/platforms/solar-space-observing-satellites/goes/
3. GOES 8-15, reprocessed data, GOES-R (revised) netcdf format (hires mag, and xrs only): for this, use the goes_r=True option https://www.ncei.noaa.gov/data/goes-space-environment-monitor/access/science/
Examples
>>> from pyspedas.projects.goes import load
>>> trange = ['2019-01-01', '2019-01-02']
>>> vars = load(trange=trange, probe='15', instrument='fgm', datatype='1min', time_clip=True)
>>> print(vars)
['g15_fgm_BX_1_QUAL_FLAG', 'g15_fgm_BX_1_NUM_PTS', 'g15_fgm_BX_1', ...]
(the result is a list of 66 variables)
MAGPD
- pyspedas.projects.goes.magpd(trange=['2013-11-05', '2013-11-06 12:00:00'], probe='15', instrument='fgm', datatype='1min', prefix='', suffix='', downloadonly=False, no_update=False, time_clip=True, force_download=False, goes_r=False)
Load GOES L2 data.
- Parameters:
trange (
listofstr) – Time range of interest [‘YYYY-MM-DD’, ‘YYYY-MM-DD’] or to specify more or less than a day [‘YYYY-MM-DD/hh:mm:ss’, ‘YYYY-MM-DD/hh:mm:ss’].probe (
str,int, orlistofstr/int) – GOES spacecraft number(s), e.g., probe=15.instrument (
strorlistofstr) – Name of the instrument. For GOES 8-15: ‘fgm’, ‘eps’, ‘epead’, ‘maged’, ‘magpd’, ‘hepad’, ‘xrs’. For GOES-R 16-18: ‘euvs’, ‘xrs’, ‘mag’, ‘mpsh’, ‘sgps’.datatype (
str) – Data type; usually instrument resolution, depends on the instrument (default ‘1min’). Valid for GOES 8-15: ‘hi’, ‘low’, ‘full’, ‘avg’, ‘1min’, ‘5min’. Valid for GOES-R 16-18: ‘hi’, ‘low’, ‘full’, ‘avg’, and other options.prefix (
str, optional) – Prefix to add to the tplot variable names. By default, no prefix is added. If prefix is ‘probename’, then the name will be used, for example, ‘g16’.suffix (
str, optional) – Suffix to add to the tplot variable names. By default, no suffix is added.downloadonly (
bool, optional) – If True, downloads the CDF files without loading them into tplot variables. Default is False.no_update (
bool, optional) – If True, only loads data from the local cache. Default is False.time_clip (
bool, optional) – If True (the default), clips the variables to exactly the range specified in the trange keyword.force_download (
bool, optional) – If True, downloads the file even if a newer version exists locally. Default is False.goes_r (
bool, optional) – If True, loads reprocessed data in GOES-R file format, for probes 8-15. Default is False, loads original data for probes 8-15.
- Returns:
List of tplot variables created or list of filenames downloaded.
- Return type:
Notes
This function can be used to load data from three sets of GOES data:
1. GOES 1-15, original netcdf format: https://www.ncei.noaa.gov/data/goes-space-environment-monitor/access/avg/
2. GOES-R 16-19, revised netcdf format: https://data.ngdc.noaa.gov/platforms/solar-space-observing-satellites/goes/
3. GOES 8-15, reprocessed data, GOES-R (revised) netcdf format (hires mag, and xrs only): for this, use the goes_r=True option https://www.ncei.noaa.gov/data/goes-space-environment-monitor/access/science/
Examples
>>> from pyspedas.projects.goes import load
>>> trange = ['2019-01-01', '2019-01-02']
>>> vars = load(trange=trange, probe='15', instrument='fgm', datatype='1min', time_clip=True)
>>> print(vars)
['g15_fgm_BX_1_QUAL_FLAG', 'g15_fgm_BX_1_NUM_PTS', 'g15_fgm_BX_1', ...]
(the result is a list of 66 variables)
ORBIT
- pyspedas.projects.goes.orbit(trange=['2013-11-5', '2013-11-6'], probe='15', prefix='', suffix='', get_support_data=False, varformat=None, varnames=[], downloadonly=False, notplot=False, no_update=False, time_clip=True, force_download=False)
Load GOES orbit data from SPDF.
Fetches GOES orbit data from the Space Physics Data Facility (SPDF) website: https://spdf.gsfc.nasa.gov/pub/data/goes/goes#/orbit/YYYY/
- Parameters:
trange (
listofstr) – Time range of interest [‘YYYY-MM-DD’, ‘YYYY-MM-DD’]. Or, to specify more or less than a day: [‘YYYY-MM-DD hh:mm:ss’, ‘YYYY-MM-DD hh:mm:ss’].probe (
strorintorlistofstrorint) – GOES spacecraft number(s), e.g., probe=15.prefix (
str, optional) – Prefix to add to the tplot variable names. By default, the added prefix is ‘g[probe]_orbit_’.suffix (
str, optional) – Suffix to add to the tplot variable names. By default, no suffix is added.downloadonly (
bool, optional) – If True, downloads the CDF files without loading them into tplot variables. Default is False.notplot (
bool, optional) – If True, loads the data into dictionaries containing the numpy objects instead of creating tplot variables. Default is False.no_update (
bool, optional) – If True, only loads data from the local cache. Default is False.time_clip (
bool, optional) – If True, clips the variables to exactly the range specified in the trange keyword. Default is False.force_download (
bool, optional) – If True, downloads the file even if a newer version exists locally. Default is False.
- Returns:
List of tplot variables created or list of filenames downloaded.
- Return type:
SGPS
- pyspedas.projects.goes.sgps(trange=['2013-11-05', '2013-11-06 12:00:00'], probe='15', instrument='fgm', datatype='1min', prefix='', suffix='', downloadonly=False, no_update=False, time_clip=True, force_download=False, goes_r=False)
Load GOES L2 data.
- Parameters:
trange (
listofstr) – Time range of interest [‘YYYY-MM-DD’, ‘YYYY-MM-DD’] or to specify more or less than a day [‘YYYY-MM-DD/hh:mm:ss’, ‘YYYY-MM-DD/hh:mm:ss’].probe (
str,int, orlistofstr/int) – GOES spacecraft number(s), e.g., probe=15.instrument (
strorlistofstr) – Name of the instrument. For GOES 8-15: ‘fgm’, ‘eps’, ‘epead’, ‘maged’, ‘magpd’, ‘hepad’, ‘xrs’. For GOES-R 16-18: ‘euvs’, ‘xrs’, ‘mag’, ‘mpsh’, ‘sgps’.datatype (
str) – Data type; usually instrument resolution, depends on the instrument (default ‘1min’). Valid for GOES 8-15: ‘hi’, ‘low’, ‘full’, ‘avg’, ‘1min’, ‘5min’. Valid for GOES-R 16-18: ‘hi’, ‘low’, ‘full’, ‘avg’, and other options.prefix (
str, optional) – Prefix to add to the tplot variable names. By default, no prefix is added. If prefix is ‘probename’, then the name will be used, for example, ‘g16’.suffix (
str, optional) – Suffix to add to the tplot variable names. By default, no suffix is added.downloadonly (
bool, optional) – If True, downloads the CDF files without loading them into tplot variables. Default is False.no_update (
bool, optional) – If True, only loads data from the local cache. Default is False.time_clip (
bool, optional) – If True (the default), clips the variables to exactly the range specified in the trange keyword.force_download (
bool, optional) – If True, downloads the file even if a newer version exists locally. Default is False.goes_r (
bool, optional) – If True, loads reprocessed data in GOES-R file format, for probes 8-15. Default is False, loads original data for probes 8-15.
- Returns:
List of tplot variables created or list of filenames downloaded.
- Return type:
Notes
This function can be used to load data from three sets of GOES data:
1. GOES 1-15, original netcdf format: https://www.ncei.noaa.gov/data/goes-space-environment-monitor/access/avg/
2. GOES-R 16-19, revised netcdf format: https://data.ngdc.noaa.gov/platforms/solar-space-observing-satellites/goes/
3. GOES 8-15, reprocessed data, GOES-R (revised) netcdf format (hires mag, and xrs only): for this, use the goes_r=True option https://www.ncei.noaa.gov/data/goes-space-environment-monitor/access/science/
Examples
>>> from pyspedas.projects.goes import load
>>> trange = ['2019-01-01', '2019-01-02']
>>> vars = load(trange=trange, probe='15', instrument='fgm', datatype='1min', time_clip=True)
>>> print(vars)
['g15_fgm_BX_1_QUAL_FLAG', 'g15_fgm_BX_1_NUM_PTS', 'g15_fgm_BX_1', ...]
(the result is a list of 66 variables)