Akebono
The routines in this module can be used to load data from the Akebono mission.
Plasma Waves and Sounder experiment (PWS)
- pyspedas.projects.akebono.pws(trange=['2012-10-01', '2012-10-02'], datatype='ne', level='h1', prefix='', suffix='', get_support_data=False, varformat=None, varnames=[], downloadonly=False, notplot=False, no_update=False, time_clip=False, force_download=False)[source]
Load data from the Akebono Plasma Waves and Sounder experiment (PWS)
- Parameters:
trange (
listofstr) – time range of interest [starttime, endtime] with the format ‘YYYY-MM-DD’,’YYYY-MM-DD’] or to specify more or less than a day [‘YYYY-MM-DD/hh:mm:ss’,’YYYY-MM-DD/hh:mm:ss’] Default: [‘2012-10-01’, ‘2012-10-02’]datatype (
str) –Data type; Valid options:
‘ne’, ‘npw-ds’, ‘npw-py’, ‘spw’
Default: ‘ne’
level (
str) – Data level; options: ‘h1’ (default: h1) Default: ‘h1’prefix (
str) – The tplot variable names will be given this prefix. By default, no prefix is added. Default: ‘’suffix (
str) – The tplot variable names will be given this suffix. By default, no suffix is added. Default: ‘’get_support_data (
bool) – Data with an attribute “VAR_TYPE” with a value of “support_data” will be loaded into tplot. By default, only loads in data with a “VAR_TYPE” attribute of “data”. Default: Falsevarformat (
str) – The file variable formats to load into tplot. Wildcard character “*” is accepted. By default, all variables are loaded in. Default: Nonevarnames (
listofstr) – List of variable names to load (if not specified, all data variables are loaded) Default: []downloadonly (
bool) – Set this flag to download the CDF files, but not load them into tplot variables Default: Falsenotplot (
bool) – Return the data in hash tables instead of creating tplot variables Default: Falseno_update (
bool) – If set, only load data from your local cache Default: Falsetime_clip (
bool) – Time clip the variables to exactly the range specified in the trange keyword Default: Falseforce_download (
bool) – Download file even if local version is more recent than server version Default: False
- Returns:
List of tplot variables created.
- Return type:
Example
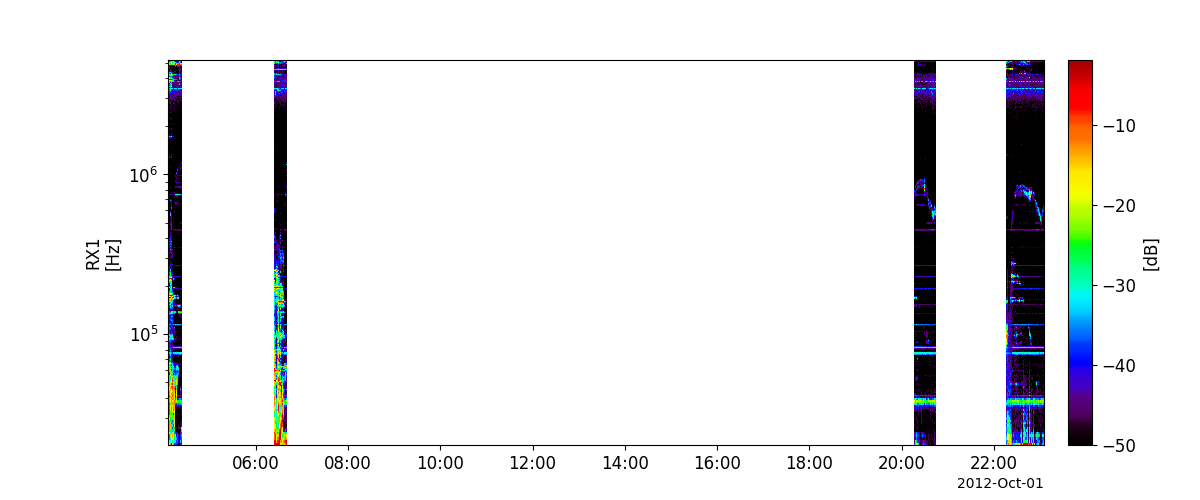
>>> import pyspedas
>>> from pyspedas import tplot
>>> pws_vars = pyspedas.projects.akebono.pws(trange=['2012-10-01', '2012-10-02'])
>>> tplot(['akb_pws_RX1', 'akb_pws_RX2'])
Example
import pyspedas
from pyspedas import tplot
pws_vars = pyspedas.projects.akebono.pws(trange=['2012-10-01', '2012-10-02'])
tplot('akb_pws_RX1')
Radiation Moniter (RDM)
- pyspedas.projects.akebono.rdm(trange=['2012-10-01', '2012-10-02'], prefix='', suffix='', get_support_data=False, varformat=None, varnames=[], downloadonly=False, notplot=False, no_update=False, time_clip=False, force_download=False)[source]
oads data from the Akebono Radiation Moniter (RDM)
- Parameters:
trange (
listofstr) – time range of interest [starttime, endtime] with the format ‘YYYY-MM-DD’,’YYYY-MM-DD’] or to specify more or less than a day [‘YYYY-MM-DD/hh:mm:ss’,’YYYY-MM-DD/hh:mm:ss’] Default: [‘2012-10-01’, ‘2012-10-02’]prefix (
str) – The tplot variable names will be given this prefix. By default, no prefix is added. Default: ‘’suffix (
str) – The tplot variable names will be given this suffix. By default, no suffix is added. Default: ‘’get_support_data (
bool) – Data with an attribute “VAR_TYPE” with a value of “support_data” will be loaded into tplot. By default, only loads in data with a “VAR_TYPE” attribute of “data”. Default: Falsevarformat (
str) – The file variable formats to load into tplot. Wildcard character “*” is accepted. By default, all variables are loaded in. Default: Nonevarnames (
listofstr) – List of variable names to load (if not specified, all data variables are loaded) Default: []downloadonly (
bool) – Set this flag to download the CDF files, but not load them into tplot variables Default: Falsenotplot (
bool) – Return the data in hash tables instead of creating tplot variables Default: Falseno_update (
bool) – If set, only load data from your local cache Default: Falsetime_clip (
bool) – Time clip the variables to exactly the range specified in the trange keyword Default: Falseforce_download (
bool) – Download file even if local version is more recent than server version Default: False
- Returns:
List of tplot variables created.
- Return type:
Example
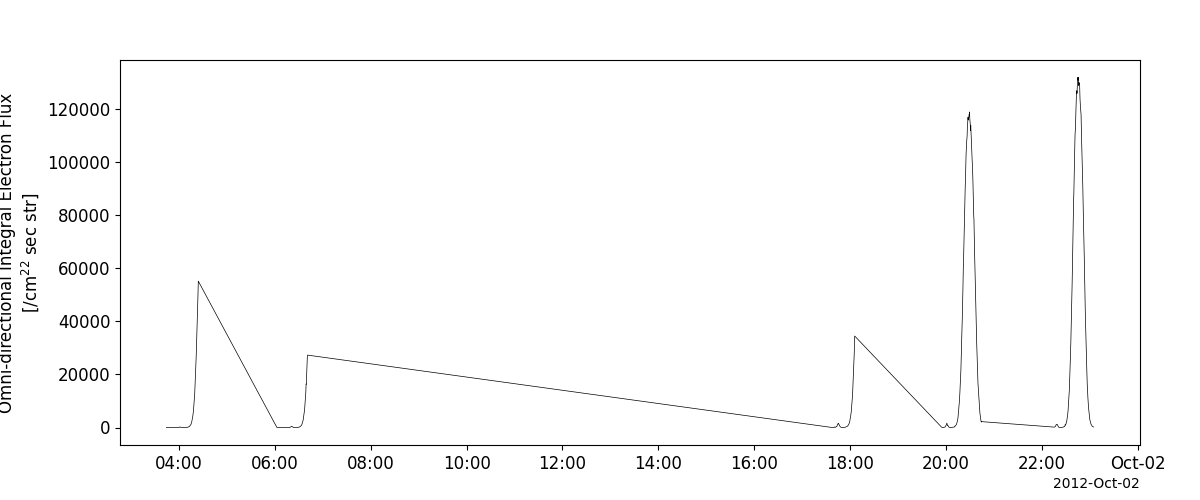
>>> import pyspedas
>>> from pyspedas import tplot
>>> rdm_vars = pyspedas.projects.akebono.rdm(trange=['2012-10-01', '2012-10-02'])
>>> tplot('akb_rdm_FEIO')
Example
import pyspedas
from pyspedas import tplot
rdm_vars = pyspedas.projects.akebono.rdm(trange=['2012-10-01', '2012-10-02'])
tplot('akb_rdm_FEIO')
Orbit data (orb)
- pyspedas.projects.akebono.orb(trange=['2012-10-01', '2012-10-02'], prefix='', suffix='', get_support_data=False, varformat=None, varnames=[], downloadonly=False, notplot=False, no_update=False, time_clip=False, force_download=False)[source]
Loads Akebono orbit data (orb)
- Parameters:
trange (
listofstr) – time range of interest [starttime, endtime] with the format ‘YYYY-MM-DD’,’YYYY-MM-DD’] or to specify more or less than a day [‘YYYY-MM-DD/hh:mm:ss’,’YYYY-MM-DD/hh:mm:ss’] Default: [‘2012-10-01’, ‘2012-10-02’]prefix (
str) – The tplot variable names will be given this prefix. By default, no prefix is added. Default: ‘’suffix (
str) – The tplot variable names will be given this suffix. By default, no suffix is added. Default: ‘’get_support_data (
bool) – Data with an attribute “VAR_TYPE” with a value of “support_data” will be loaded into tplot. By default, only loads in data with a “VAR_TYPE” attribute of “data”. Default: Falsevarformat (
str) – The file variable formats to load into tplot. Wildcard character “*” is accepted. By default, all variables are loaded in. Default: Nonevarnames (
listofstr) – List of variable names to load (if not specified, all data variables are loaded) Default: []downloadonly (
bool) – Set this flag to download the CDF files, but not load them into tplot variables Default: Falsenotplot (
bool) – Return the data in hash tables instead of creating tplot variables Default: Falseno_update (
bool) – If set, only load data from your local cache Default: Falsetime_clip (
bool) – Time clip the variables to exactly the range specified in the trange keyword Default: Falseforce_download (
bool) – Download file even if local version is more recent than server version Default: False
- Returns:
List of tplot variables created.
- Return type:
Example
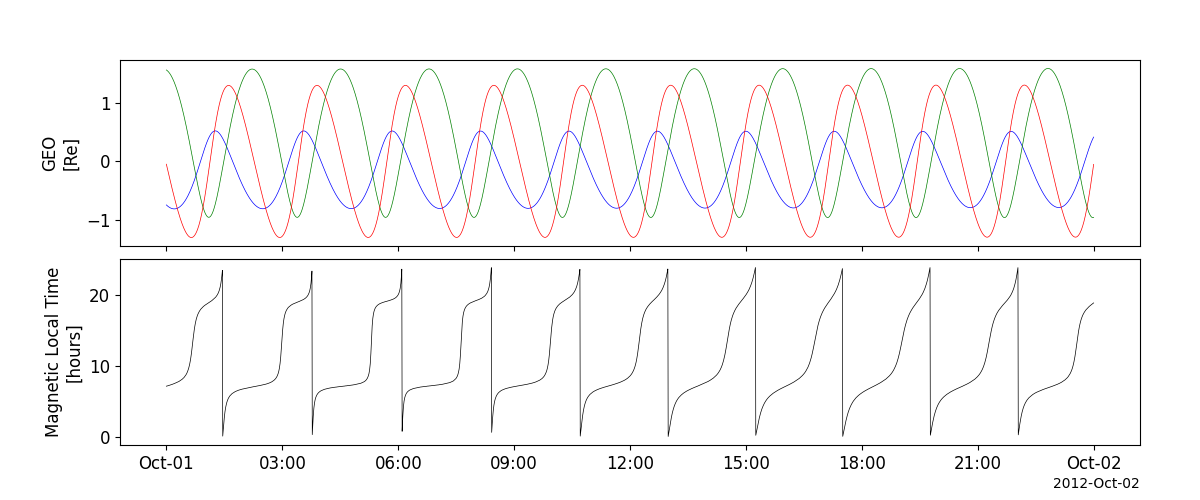
>>> import pyspedas
>>> from pyspedas import tplot
>>> orb_vars = pyspedas.projects.akebono.orb(trange=['2012-10-01', '2012-10-02'])
>>> tplot(['akb_orb_geo', 'akb_orb_MLT'])
Example
import pyspedas
from pyspedas import tplot
orb_vars = pyspedas.projects.akebono.orb(trange=['2012-10-01', '2012-10-02'])
tplot(['akb_orb_geo', 'akb_orb_MLT'])