Solar Orbiter (SOLO)
The routines in this module can be used to load data from the Solar Orbiter (SOLO) mission.
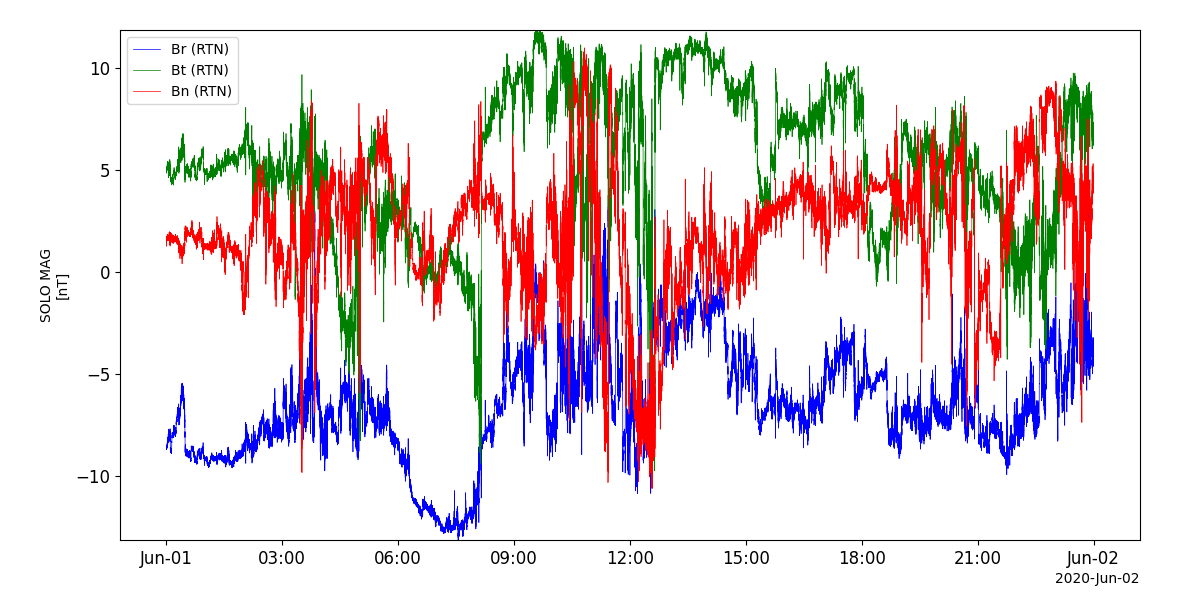
Magnetometer (MAG)
- pyspedas.projects.solo.mag(trange=['2020-06-01', '2020-06-02'], datatype='rtn-normal', level='l2', suffix='', prefix='', get_support_data=False, varformat=None, varnames=[], downloadonly=False, notplot=False, no_update=False, time_clip=False)[source]
This function loads data from the Magnetometer (MAG)
- Parameters:
trange (
listofstr) – time range of interest [starttime, endtime] with the format ‘YYYY-MM-DD’,’YYYY-MM-DD’] or to specify more or less than a day [‘YYYY-MM-DD/hh:mm:ss’,’YYYY-MM-DD/hh:mm:ss’]datatype (
str) –- Data type; Valid options:
‘rtn-normal’: RTN Coordinates in Normal Mode ‘rtn-normal-1-minute’: Same as above, but at 1-min resolution ‘rtn-burst’: RTN Coordinates in Burst Mode ‘srf-normal’: Spacecraft Reference Frame in Normal Mode ‘srf-burst’: Spacecraft Reference Frame in Burst Mode
level (
str) – Data level (default: l2)suffix (
str) – The tplot variable names will be given this suffix. By default, no prefix is added. Default: ‘’prefix (
str) – The tplot variable names will be given this prefix. By default, no prefix is added. Default: ‘’get_support_data (
bool) – Data with an attribute “VAR_TYPE” with a value of “support_data” will be loaded into tplot. By default, only loads in data with a “VAR_TYPE” attribute of “data”.varformat (
str) – The file variable formats to load into tplot. Wildcard character “*” is accepted. By default, all variables are loaded in.varnames (
listofstr) – List of variable names to load (if not specified, all data variables are loaded)downloadonly (
bool) – Set this flag to download the CDF files, but not load them into tplot variablesnotplot (
bool) – Return the data in hash tables instead of creating tplot variablesno_update (
bool) – If set, only load data from your local cachetime_clip (
bool) – Time clip the variables to exactly the range specified in the trange keyword
- Return type:
Listoftplot variables created.
Example
import pyspedas
from pyspedas import tplot
mag_vars = pyspedas.projects.solo.mag(trange=['2020-06-01', '2020-06-02'], datatype='rtn-normal')
tplot('B_RTN')
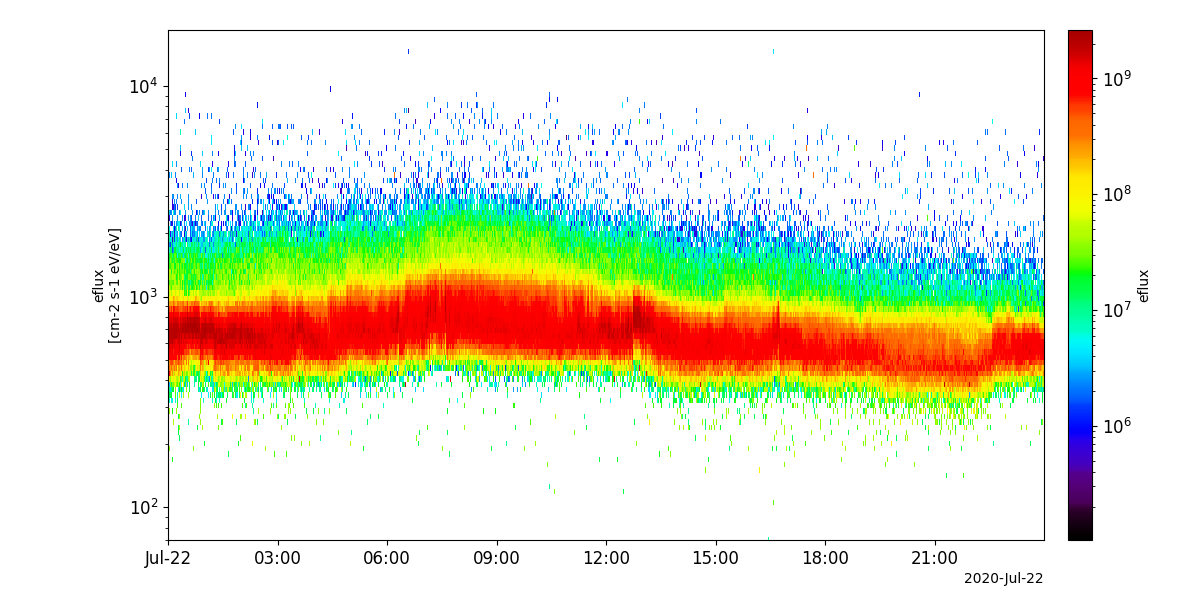
Solar Wind Plasma Analyser (SWA)
- pyspedas.projects.solo.swa(trange=['2020-07-22', '2020-07-23'], datatype='pas-eflux', level='l2', suffix='', prefix='', get_support_data=False, varformat=None, varnames=[], downloadonly=False, notplot=False, no_update=False, time_clip=False)[source]
This function loads data from the Solar Wind Plasma Analyser (SWA)
- Parameters:
trange (
listofstr) – time range of interest [starttime, endtime] with the format ‘YYYY-MM-DD’,’YYYY-MM-DD’] or to specify more or less than a day [‘YYYY-MM-DD/hh:mm:ss’,’YYYY-MM-DD/hh:mm:ss’]datatype (
str) – Data type; Valid options:level (
str) – Data level (default: l2)suffix (
str) – The tplot variable names will be given this suffix. By default, no prefix is added. Default: ‘’prefix (
str) – The tplot variable names will be given this prefix. By default, no prefix is added. Default: ‘’get_support_data (
bool) – Data with an attribute “VAR_TYPE” with a value of “support_data” will be loaded into tplot. By default, only loads in data with a “VAR_TYPE” attribute of “data”.varformat (
str) – The file variable formats to load into tplot. Wildcard character “*” is accepted. By default, all variables are loaded in.varnames (
listofstr) – List of variable names to load (if not specified, all data variables are loaded)downloadonly (
bool) – Set this flag to download the CDF files, but not load them into tplot variablesnotplot (
bool) – Return the data in hash tables instead of creating tplot variablesno_update (
bool) – If set, only load data from your local cachetime_clip (
bool) – Time clip the variables to exactly the range specified in the trange keyword
- Return type:
Listoftplot variables created.
Example
import pyspedas
from pyspedas import tplot
swa_vars = pyspedas.projects.solo.swa(trange=['2020-07-22', '2020-07-23'], datatype='pas-eflux')
tplot('eflux')
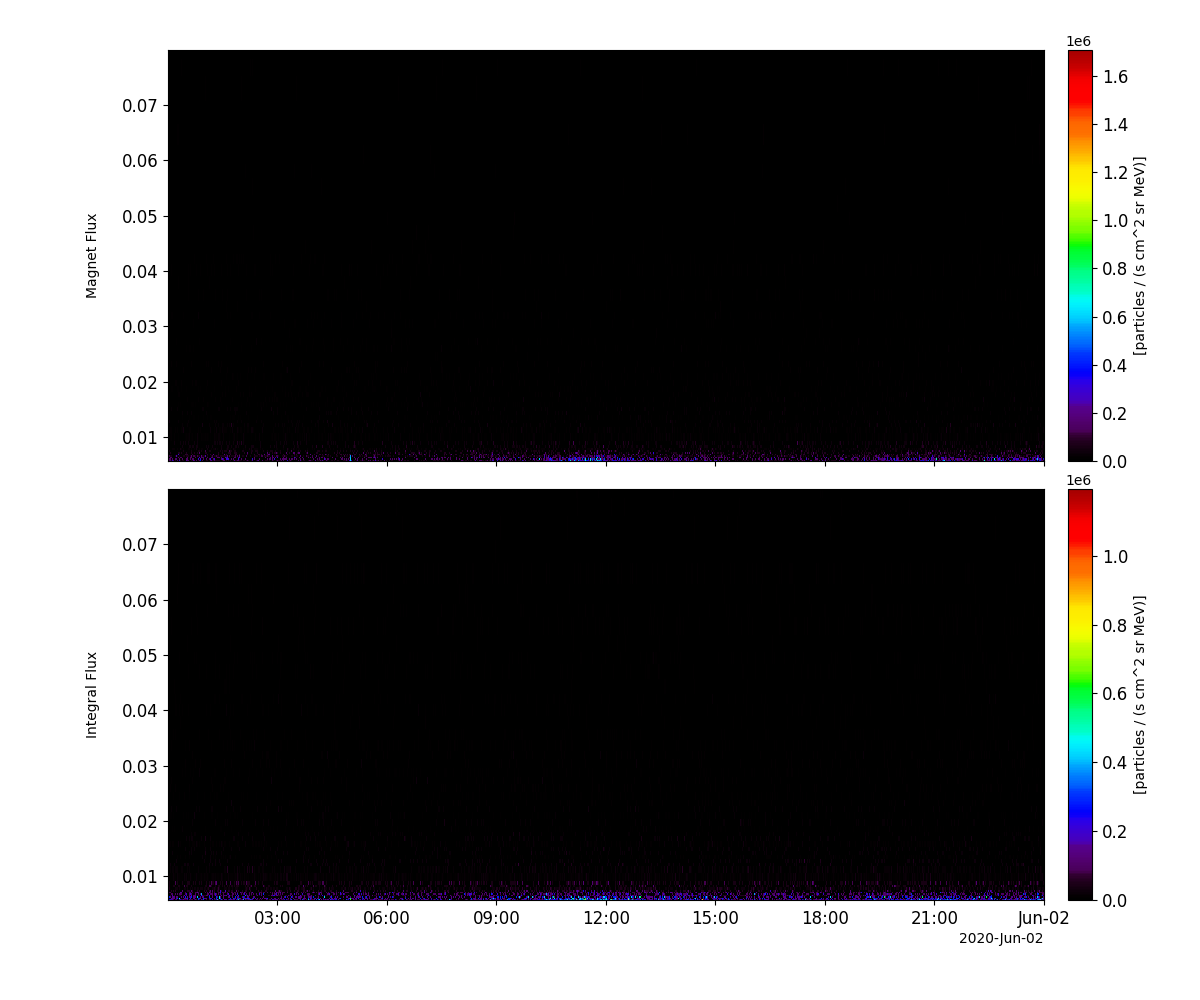
Energetic Particle Detector (EPD)
- pyspedas.projects.solo.epd(trange=['2020-06-14', '2020-06-15'], datatype='step', mode='hcad', level='l2', suffix='', prefix='', get_support_data=False, varformat=None, varnames=[], downloadonly=False, notplot=False, no_update=False, time_clip=False)[source]
This function loads data from the Energetic Particle Detector (EPD)
- Parameters:
trange (
listofstr) – time range of interest [starttime, endtime] with the format ‘YYYY-MM-DD’,’YYYY-MM-DD’] or to specify more or less than a day [‘YYYY-MM-DD/hh:mm:ss’,’YYYY-MM-DD/hh:mm:ss’]datatype (
str) – Data type; Valid options:mode (
str) – EPD mode; Valid options:level (
str) – Data level (default: l2)suffix (
str) – The tplot variable names will be given this suffix. By default, no prefix is added. Default: ‘’prefix (
str) – The tplot variable names will be given this prefix. By default, no prefix is added. Default: ‘’get_support_data (
bool) – Data with an attribute “VAR_TYPE” with a value of “support_data” will be loaded into tplot. By default, only loads in data with a “VAR_TYPE” attribute of “data”.varformat (
str) – The file variable formats to load into tplot. Wildcard character “*” is accepted. By default, all variables are loaded in.varnames (
listofstr) – List of variable names to load (if not specified, all data variables are loaded)downloadonly (
bool) – Set this flag to download the CDF files, but not load them into tplot variablesnotplot (
bool) – Return the data in hash tables instead of creating tplot variablesno_update (
bool) – If set, only load data from your local cachetime_clip (
bool) – Time clip the variables to exactly the range specified in the trange keyword
- Return type:
Listoftplot variables created.
Example
import pyspedas
from pyspedas import tplot
epd_vars = pyspedas.projects.solo.epd(trange=['2020-06-01', '2020-06-02'], datatype='step', mode='rates')
tplot(['Magnet_Flux', 'Integral_Flux'])
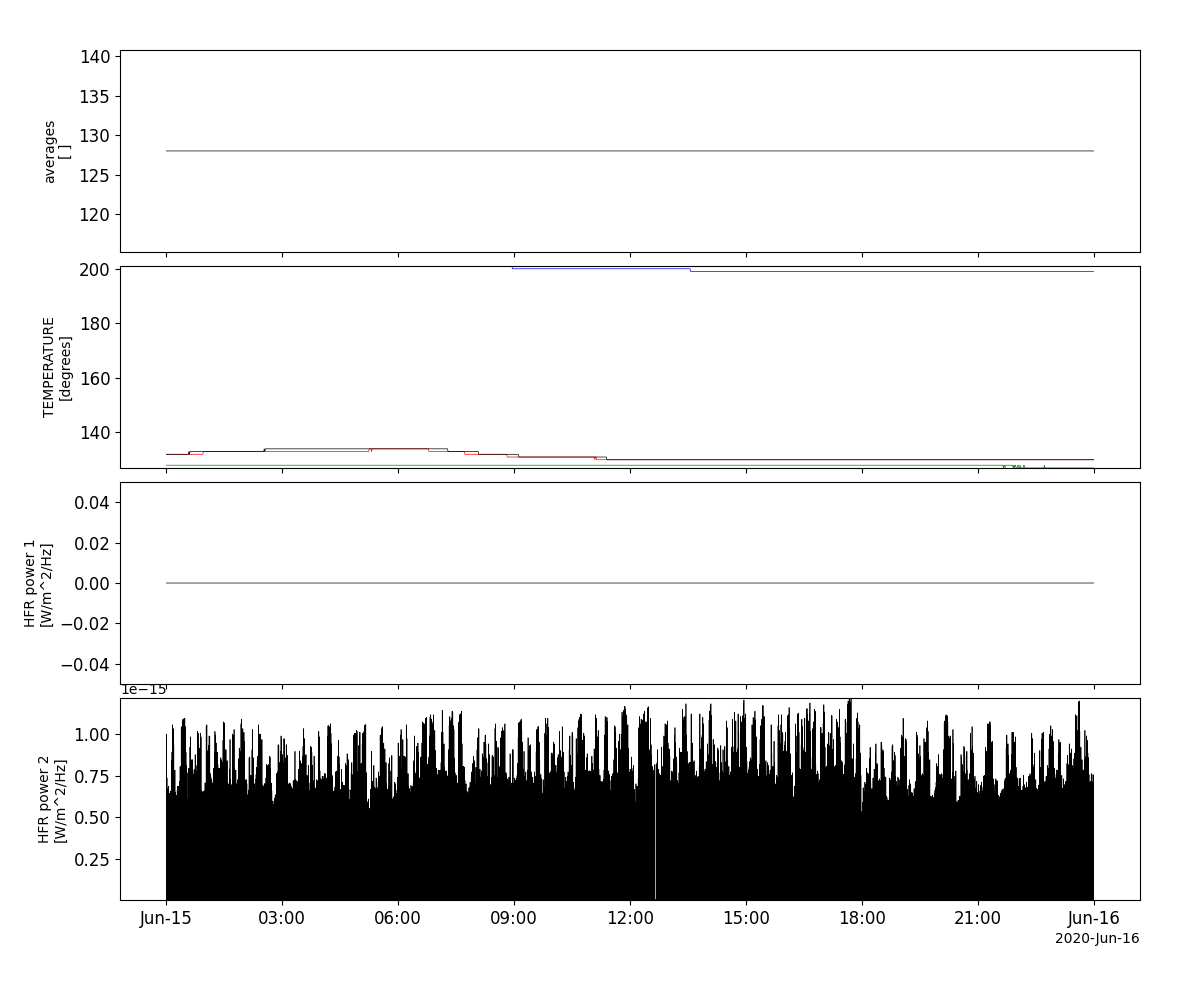
Radio and Plasma Waves (RPW)
- pyspedas.projects.solo.rpw(trange=['2020-06-15', '2020-06-16'], datatype='hfr-surv', level='l2', suffix='', prefix='', get_support_data=False, varformat=None, varnames=[], downloadonly=False, notplot=False, no_update=False, time_clip=False)[source]
Loads data from the Radio and Plasma Waves (RPW) instrument
- Parameters:
trange (
listofstr) – time range of interest [starttime, endtime] with the format ‘YYYY-MM-DD’,’YYYY-MM-DD’] or to specify more or less than a day [‘YYYY-MM-DD/hh:mm:ss’,’YYYY-MM-DD/hh:mm:ss’]datatype (
str) – Data type; Valid options: Level 1:‘hfr-surv’, ‘lfr-surv-asm’, ‘lfr-surv-bp1’, ‘lfr-surv-bp2’, ‘lfr-surv-cwf’, ‘lfr-surv-swf’, ‘tds-surv-hist1d’, ‘tds-surv-hist2d’, ‘tds-surv-mamp’, ‘tds-surv-rswf’, ‘tds-surv-stat’, ‘tds-surv-tswf’, ‘tnr-surv’ (see below for definitions)
Level 2:
High Frequency Receiver (HFR):
‘hfr-surv’: High Frequency Receiver (HFR) Data in Survey Mode
Low Frequency Receiver (LFR):
‘lfr-surv-asm’: Averaged Spectral Matrix (ASM) Data in Survey Mode ‘lfr-surv-bp1’: Basic Parameters Set 1 (BP1) Data in Survey Mode ‘lfr-surv-bp2’: Basic Parameter Set 2 (BP2) Data in Survey Mode ‘lfr-surv-cwf-b’: Continuous Magnetic Waveform (CWF-B) in Survey Mode ‘lfr-surv-cwf-e’: Continuous Electric Waveform (CWF-E) in Survey Mode ‘lfr-surv-swf-b’: Snapshot Magnetic Waveform (SWF-B) in Survey Mode ‘lfr-surv-swf-e’: Snapshot Electric Waveform (SWF-E) in Survey Mode
Time Domain Sampler (TDS):
‘tds-surv-hist1d’: Histogram Set 1 (HIST1D) Data in Survey Mode ‘tds-surv-hist2d’: Histogram Set 2 (HIST2D) Data in Survey Mode ‘tds-surv-mamp’: Maximum Amplitude (MAMP) Data in Survey Mode ‘tds-surv-rswf-b’: Regular Snapshot Waveform (RSWF) Magnetic Field Data in Survey Mode ‘tds-surv-rswf-e’: Regular Snapshot Waveform (RSWF) Electric Field Data in Survey Mode ‘tds-surv-stat’: Statistical (STAT) Data in Survey Mode ‘tds-surv-tswf-b’: Triggered Snapshot Magnetic Waveform (TSWF-B) in Survey Mode ‘tds-surv-tswf-e’: Triggered Snapshot Electric Waveform (TSWF-E) in Survey Mode
Level 3:
‘bia-density’: Plasma density derived from probe-to-spacecraft potential and electron plasma frequency ‘bia-density-10-seconds’: same as above, but median value over 10 s interval ‘bia-efield-10-seconds’: Electric field vector in SRF. Median value over 10 s interval ‘bia-scpot-10-seconds’: Spacecraft potential with respect to plasma. Median value over 10 s interval ‘tnr-fp’: Plasma frequency value derived by the plasma peak tracking (Thermal Noise Receiver (TNR))
level (
str) – Data level (default: l2)suffix (
str) – The tplot variable names will be given this suffix. By default, no prefix is added. Default: ‘’prefix (
str) – The tplot variable names will be given this prefix. By default, no prefix is added. Default: ‘’get_support_data (
bool) – Data with an attribute “VAR_TYPE” with a value of “support_data” will be loaded into tplot. By default, only loads in data with a “VAR_TYPE” attribute of “data”.varformat (
str) – The file variable formats to load into tplot. Wildcard character “*” is accepted. By default, all variables are loaded in.varnames (
listofstr) – List of variable names to load (if not specified, all data variables are loaded)downloadonly (
bool) – Set this flag to download the CDF files, but not load them into tplot variablesnotplot (
bool) – Return the data in hash tables instead of creating tplot variablesno_update (
bool) – If set, only load data from your local cachetime_clip (
bool) – Time clip the variables to exactly the range specified in the trange keyword
- Return type:
Listoftplot variables created.
Example
import pyspedas
from pyspedas import tplot
rpw_vars = pyspedas.projects.solo.rpw(trange=['2020-06-15', '2020-06-16'], datatype='hfr-surv')
tplot(['AVERAGE_NR', 'TEMPERATURE', 'FLUX_DENSITY1', 'FLUX_DENSITY2'])