Polar Orbiting Environmental Satellites (POES) Mission
The routines in this module can be used to load data from the Polar Orbiting Environmental Satellites (POES) Mission mission.
Space Environment Monitor (SEM)
- pyspedas.projects.poes.sem(trange=['2018-11-5', '2018-11-6'], probe=['noaa19'], instrument='sem', datatype='*', prefix='', suffix='', get_support_data=False, ncei_server=False, ncei_l1b_server=False, varformat=None, varnames=[], downloadonly=False, notplot=False, no_update=False, time_clip=False, force_download=False)
Load POES Space Environment Monitor data.
- Parameters:
trange (
listofstr, optional) – Time range of interest [starttime, endtime] with the format [‘YYYY-MM-DD’, ‘YYYY-MM-DD’] or to specify more or less than a day [‘YYYY-MM-DD/hh:mm:ss’, ‘YYYY-MM-DD/hh:mm:ss’]. Default is [‘2018-11-5’, ‘2018-11-6’].probe (
strorlistofstr, optional) – POES spacecraft name(s); e.g., metop1, metop2, noaa15, noaa16, noaa18, noaa19. Default is [‘noaa19’].instrument (
str, optional) – Name of the instrument. Default is ‘sem’.datatype (
str, optional) – This variable is unused. It is reserved for future use. Default is ‘*’.prefix (
str, optional) – The tplot variable names will be given this prefix. By default, no prefix is added. Default is ‘’.suffix (
str, optional) – The tplot variable names will be given this suffix. By default, no suffix is added.get_support_data (
bool, optional) – Data with an attribute “VAR_TYPE” with a value of “support_data” will be loaded into tplot. By default, only loads in data with a “VAR_TYPE” attribute of “data”. Default is False.ncei_server (
bool, optional) – Set this flag to download data from the NCEI NOAA server instead of the default SPDF server. The NCEI server contains older data which is not available on the SPDF server. Default is False.varformat (
str, optional) – The file variable formats to load into tplot. Wildcard character “*” is accepted. By default, all variables are loaded in. Default is False.varnames (
listofstr, optional) – List of variable names to load (if not specified, all data variables are loaded).downloadonly (
bool, optional) – Set this flag to download the CDF files, but not load them into tplot variables. Default is False.notplot (
bool, optional) – Return the data in hash tables instead of creating tplot variables. Default is False.no_update (
bool, optional) – If set, only load data from your local cache. Default is False.time_clip (
bool, optional) – Time clip the variables to exactly the range specified in the trange keyword. Default is False.force_download (
bool, optional) – Download file even if local version is more recent than server version. Default is False.
- Returns:
List of tplot variables created.
- Return type:
Examples
>>> from pyspedas.projects.poes.load import load
>>> vars = load(trange=['2013-11-5', '2013-11-6'])
>>> print(vars)
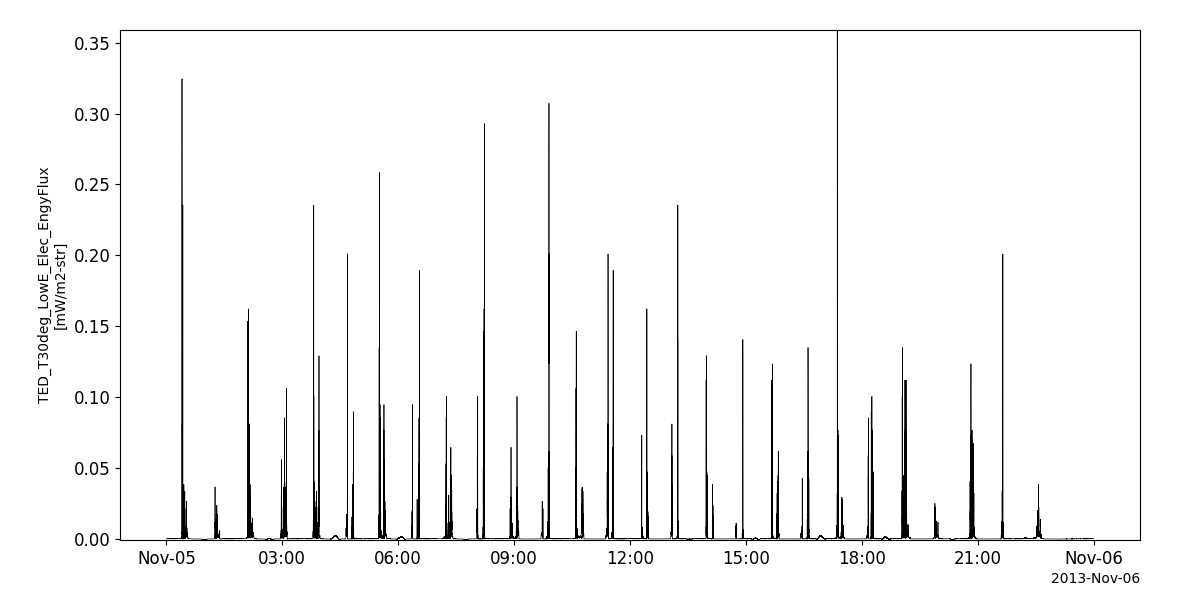
Example
import pyspedas
from pyspedas import tplot
sem_vars = pyspedas.projects.poes.sem(trange=['2013-11-5', '2013-11-6'])
tplot('ted_ele_tel30_low_eflux')