Load Data from NASA’s CDAWeb (Coordinated Data Analysis Web) archive
CDAWeb is an archive and web service, operated by NASA, providing a large number of space-based and ground-based data sets of interest to heliophysics. The tools in this module can be used to access these datasets in PySPEDAS.
CDAWeb API
The scriptable CDAWeb interface provided by PySPEDAS can be used to download data. You will need to know the exact strings CDAWeb uses to represent the missions, instruments, and data sets to be accessed.
All the CDAWeb interface calls are done via the CDAWeb class. This class has methods get_observatories, get_instruments, and get_datasets to return the CDAWeb designations available in their archive.
The get_filenames method takes a list of dataset names, a start time, and an end time, and returns a list of URLs representing the archived data.
The cda_download method takes this list of URLs, a directory to download them to, and some optional parameters specifying how the variables in the dowloaded data files are to be loaded as tplot variables.
- class pyspedas.CDAWeb[source]
Get information and download files from CDAWeb using cdasws.
- cda_download(remote_files, local_dir=None, download_only=False, varformat=None, get_support_data=False, prefix='', suffix='', varnames=None, notplot=False, merge=False, trange=None, time_clip=False, force_download=False)[source]
Download data files and (by default) load the data into tplot variables
- Parameters:
remote_files (
listofstr) – List of remote file URLs, as obtained from function get_datasets().local_dir (
str) – Local directory to save the data in.download_only (
bool) – If True, download the data, but do not load it into tplot variables.varformat (
str) – If set, specifies a pattern for which CDF or NetCDF variables to load.get_support_data (
bool) – If True, load CDF variables marked as ‘support_data’.prefix (
str) – If set, prepend this string to the variable name when creating the tplot variables.suffix (
str) – If set, append this string to the variable name when creating the tplot variables.varnames (
listofstr) – If set, specifies a list of variables to load from the data files. If None or [] or [‘*’], load all variables.notplot (
bool) – If True, return data directly as tplot data structures, rather than a list of tplot names.merge (
bool) – If True, merge the data with existing tplot variables. If False (the default), overwrite existing tplot variables.trange (
listofstr) – If set, clip the time range of the data to these values.time_clip (
bool) – If True, clip the time range of the data to the values in trange.force_download (
bool) – If True, download the data even if it already exists locally.
- Returns:
A tuple containing the number of files downloaded, the number of variables loaded, and a list of the tplot variables loaded.
- Return type:
Examples
>>> from pyspedas import CDAWeb
>>> from pyspedas import tplot
>>> cdaweb_obj = CDAWeb()
>>> urllist = cdaweb_obj.get_filenames(['THB_L2_FIT (2007-02-26 to 2020-01-17)'], '2010-01-01 00:00:00', '2010-01-10 00:00:00')
>>> result = cdaweb_obj.cda_download(urllist,local_dir="/tmp")
>>> tplot('thb_fgs_gsm')
- get_datasets(mission_list, instrument_list)[source]
Return a list of datasets recognized by CDAWeb, given lists of missions and instruments.
- Parameters:
- Returns:
A list of available datasets for the given missions and instruments.
- Return type:
Examples
>>> from pyspedas import CDAWeb
>>> cdaweb_obj = CDAWeb()
>>> dataset_list = cdaweb_obj.get_datasets(['ARTEMIS'],['Electric Fields (space)'])
- get_filenames(dataset_list, t0, t1)[source]
Return a list of urls for a dataset between dates t0 and t1.
- Example: get_files([‘THB_L2_FIT (2007-02-26 to 2020-01-17)’],
‘2010-01-01 00:00:00’, ‘2010-01-10 00:00:00’)
- Parameters:
- Returns:
A list of URLs for the given dataset and time range
- Return type:
Examples
>>> from pyspedas import CDAWeb
>>> cdaweb_obj = CDAWeb()
>>> urllist = cdaweb_obj.get_filenames(['THB_L2_FIT (2007-02-26 to 2020-01-17)'], '2010-01-01 00:00:00', '2010-01-10 00:00:00')
Example
import pyspedas
from pyspedas import tplot, options, get_data
# Create the CDAWeb interface object
cdaweb_obj = pyspedas.CDAWeb()
# This mission and instrument are selected from the lists returned by
# the cdaweb_obj.get_observatories() and cdaweb.get_instruments() methods.
mission_list = ['Voyager']
instrument_list = ['Magnetic Fields (space)']
# Get a list of CDAWeb datasets for Voyager magnetometer data
dataset_list = cdaweb_obj.get_datasets(mission_list, instrument_list)
print(dataset_list)
# We'll pick one of available data sets and load it into tplot variables
dataset = 'VOYAGER2_2S_MAG (1977-08-24 to 1991-01-01)'
start_time = '1979-01-01 00:00:00'
end_time = '1979-01-04 00:00:00'
# Get the URLs for the available data in this time range
urllist = cdaweb_obj.get_filenames([dataset],start_time, end_time)
# Download the data and load as tplot variables. Setting a prefix
# is useful if you want to work with both Voyager 1 and Voyager 2
# data; the variable names in the archived data are the same for both
# spacecraft.
cdaweb_obj.cda_download(urllist,"cdaweb/",prefix='v2_')
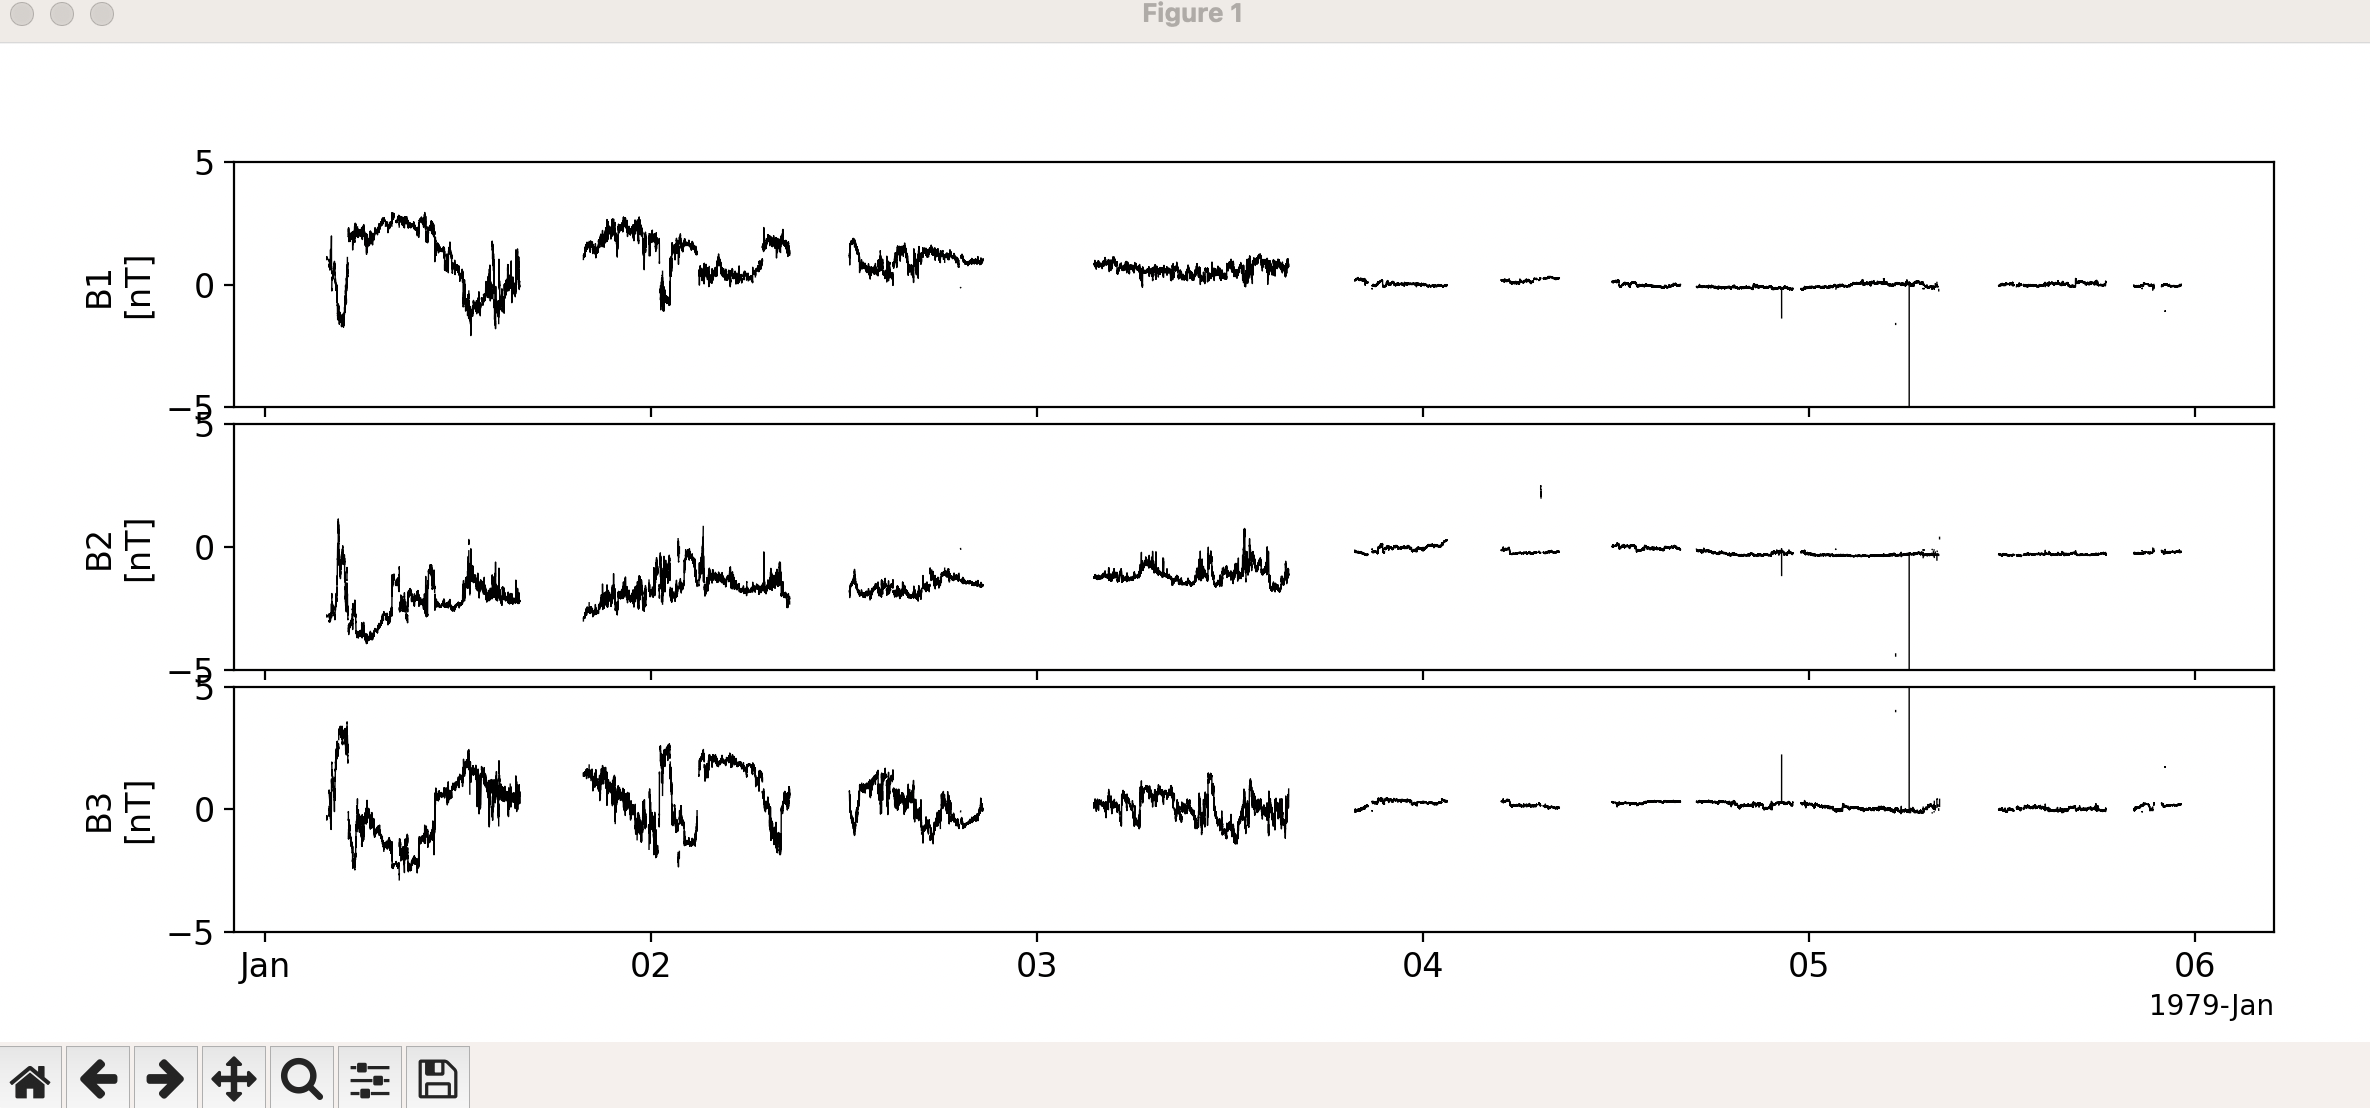
# The magnetic field vectors are given as a set of 3 scalar variables, B1, B2, and B3
# Set a nice Y range for plotting these variables (-5 to +5 nT)
options('v2_B1','yrange',[-5,5])
options('v2_B2','yrange',[-5,5])
options('v2_B3','yrange',[-5,5])
# Plot the data
tplot(['v2_B1', 'v2_B2', 'v2_B3'])
# Get the data arrays and metadata dictionary for v2_B1
b1_dat = get_data('v2_B1')
b1_md = get_data('b2_B1', metadata=True)
time_array = b1_dat.times
data_array = b1_dat.y
Here is what the resulting plot should look like:
Interactive CDAWeb Browser
PySPEDAS also includes an interactive CDAWeb archive browser and downloader, based on the tkinter GUI toolkit.
To start the CDAWeb browser:
from pyspedas import cdagui
cdagui()
This should bring up a screen like this:
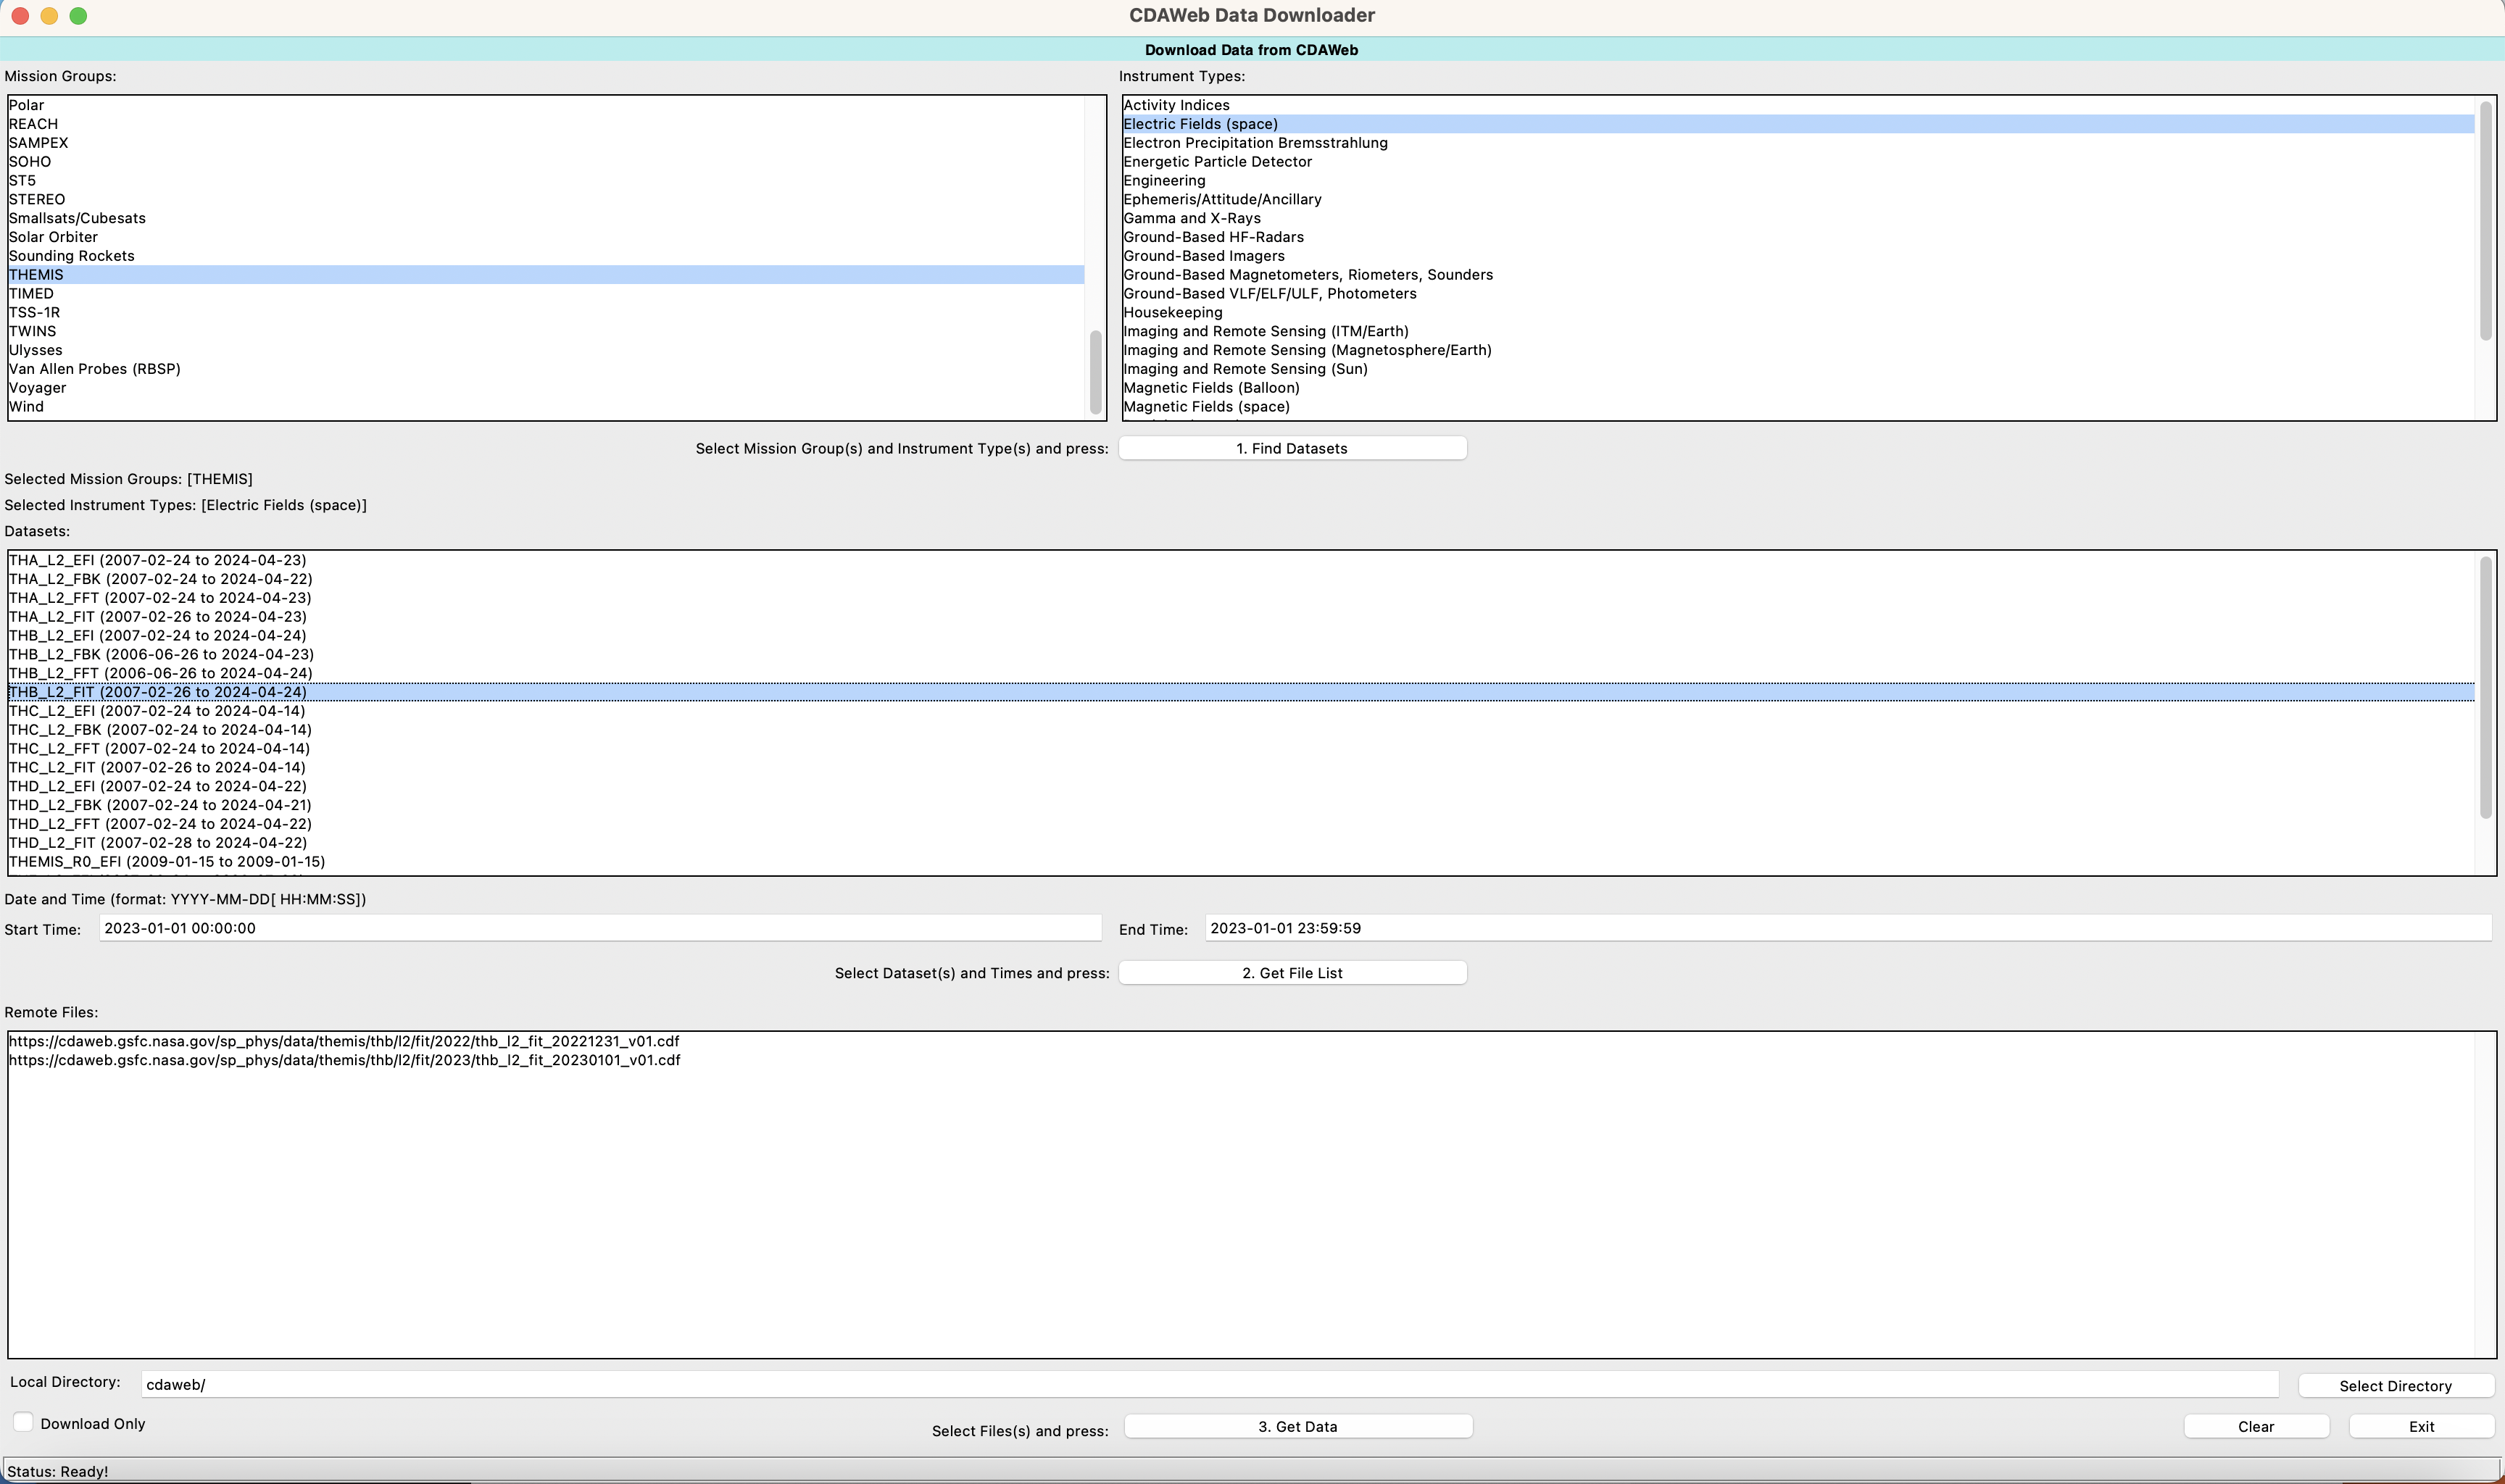
Upon loading the browser, the top two panes should automatically populate with the list of CDAWeb mission names and instrument types.
Select at least one item in each pane, then click the “Find Datasets” button to see the available data matching your selection in the middle pane.
Make one or more selections from the available datasets. Below the dataset list are some controls for setting the time range of interest. Set these to the desired date range, and click the “Get File List” button. The URLs for the available data will be displayed in the bottom pane.
Below that are controls for selecting a download directory, and a checkbox allowing you to simply download the data and skip the conversion to tplot variables. Set the download parameters as desired, select one or more URLs from the list of remote files, and click the “Get Data” button. This begins the download process.
When the data is finished downloading, you should see a pop-up dialog showing how many files were successfully downloaded and loaded into tplot variables.
Upon exiting the browser, the tplot variables you loaded should be available in your interactive session for further plotting and exploration.