PySPEDAS Documentation
![]()
![]()


PySPEDAS is an implementation of the Space Physics Environment Data Analysis Software (SPEDAS) framework in Python.
The SPEDAS framework is written in IDL and contains data loading, data analysis and data plotting tools for various scientific missions (NASA, NOAA, etc.) and ground magnetometers.
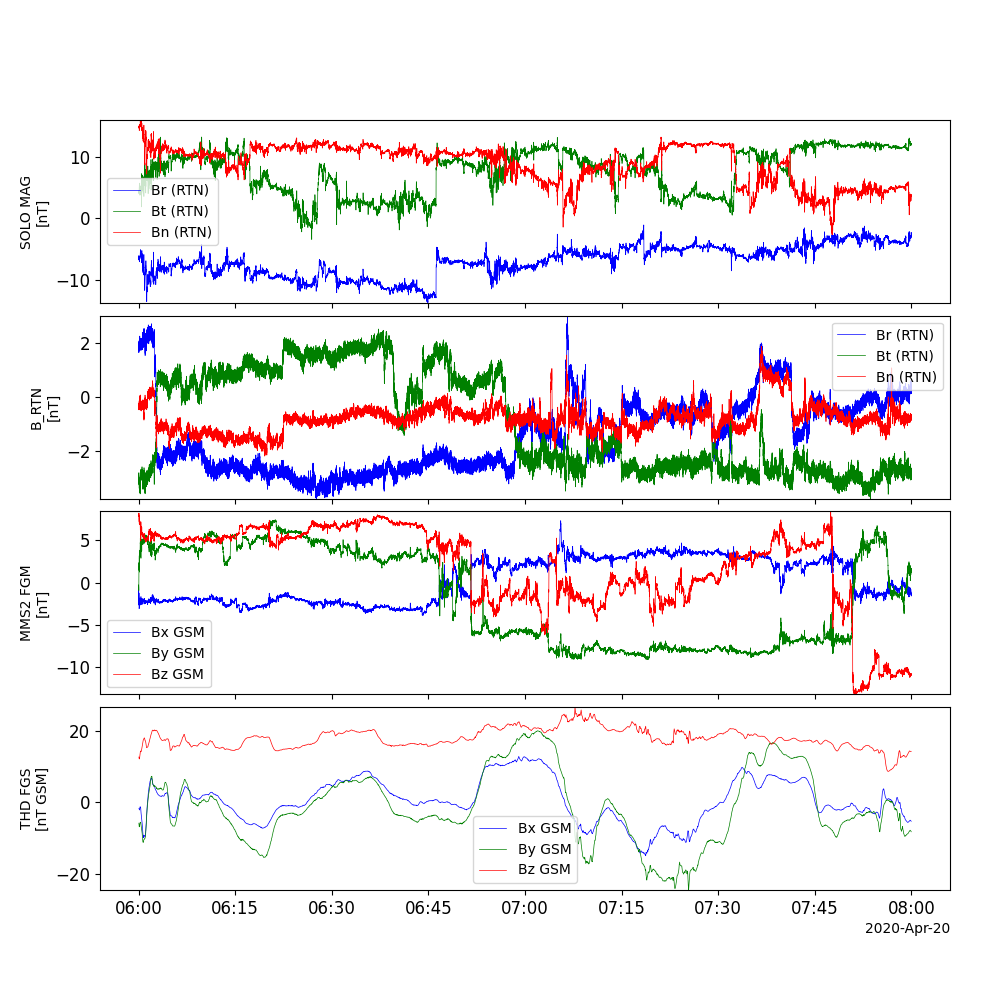
PySPEDAS makes creating multi-mission, multi-instrument figures simple, e.g., to create a figure showing magnetometer data from Solar Orbiter, Parker Solar Probe, MMS, and THEMIS,
import pyspedas
from pyspedas import tplot

time_range = ['2020-04-20/06:00', '2020-04-20/08:00']

pyspedas.projects.solo.mag(trange=time_range, time_clip=True)
pyspedas.projects.psp.fields(trange=time_range, time_clip=True)
pyspedas.projects.mms.fgm(trange=time_range, time_clip=True, probe=2)
pyspedas.projects.themis.fgm(trange=time_range, time_clip=True, probe='d')

tplot(['B_RTN', 'psp_fld_l2_mag_RTN', 'mms2_fgm_b_gsm_srvy_l2_bvec', 'thd_fgs_gsm'])
First Steps
Features
- Load Routines
- Analysis Tools
- Load Data from NASA’s CDAWeb (Coordinated Data Analysis Web) archive
- Load Data via HAPI (the Heliophysics Application Program Interface)
- Load data via VIRES service
- Magnetic Field Models
- Managing model parameters
- Coordinate Systems
- Utilities
- Mission Specific Tools
- Plotting routines
- Contributing to PySPEDAS
Updating older code to PySPEDAS 2.0+