Solar Terrestrial Relations Observatory (STEREO)
The routines in this module can be used to load data from the Solar Terrestrial Relations Observatory (STEREO) mission.
Magnetometer (MAG)
- pyspedas.projects.stereo.mag(trange=['2013-11-5', '2013-11-6'], probe='a', datatype='8hz', suffix='', prefix='', get_support_data=False, varformat=None, varnames=[], downloadonly=False, notplot=False, no_update=False, time_clip=False)[source]
This function loads data from the magnetometer
- Parameters:
trange (
listofstr) – time range of interest [starttime, endtime] with the format ‘YYYY-MM-DD’,’YYYY-MM-DD’] or to specify more or less than a day [‘YYYY-MM-DD/hh:mm:ss’,’YYYY-MM-DD/hh:mm:ss’] Default: [‘2013-11-5’, ‘2013-11-6’]probe (
str) – Spacecraft probe (‘a’ for ahead, ‘b’ for behind) Default: ‘a’datatype (
str) – Data type; Valid options: 8hz, 32hz Default: ‘8hz’suffix (
str) – The tplot variable names will be given this suffix. Default: ‘’, no suffix is added.prefix (
str) – The tplot variable names will be given this prefix. Default: ‘’, no prefix is added.get_support_data (
bool) – Data with an attribute “VAR_TYPE” with a value of “support_data” will be loaded into tplot. Default: False. Only loads in data with a “VAR_TYPE” attribute of “data”.varformat (
str) – The file variable formats to load into tplot. Wildcard character “*” is accepted. Default: None. All variables are loaded in.varnames (
listofstr) – List of variable names to load. Default: [], if not specified, all data variables are loadeddownloadonly (
bool) – Set this flag to download the CDF files, but not load them into tplot variables Default: Falsenotplot (
bool) – Return the data in hash tables instead of creating tplot variables Default: Falseno_update (
bool) – If set, only load data from your local cache Default: Falsetime_clip (
bool) – Time clip the variables to exactly the range specified in the trange keyword Default: False
- Return type:
Listoftplot variables created.
Example:
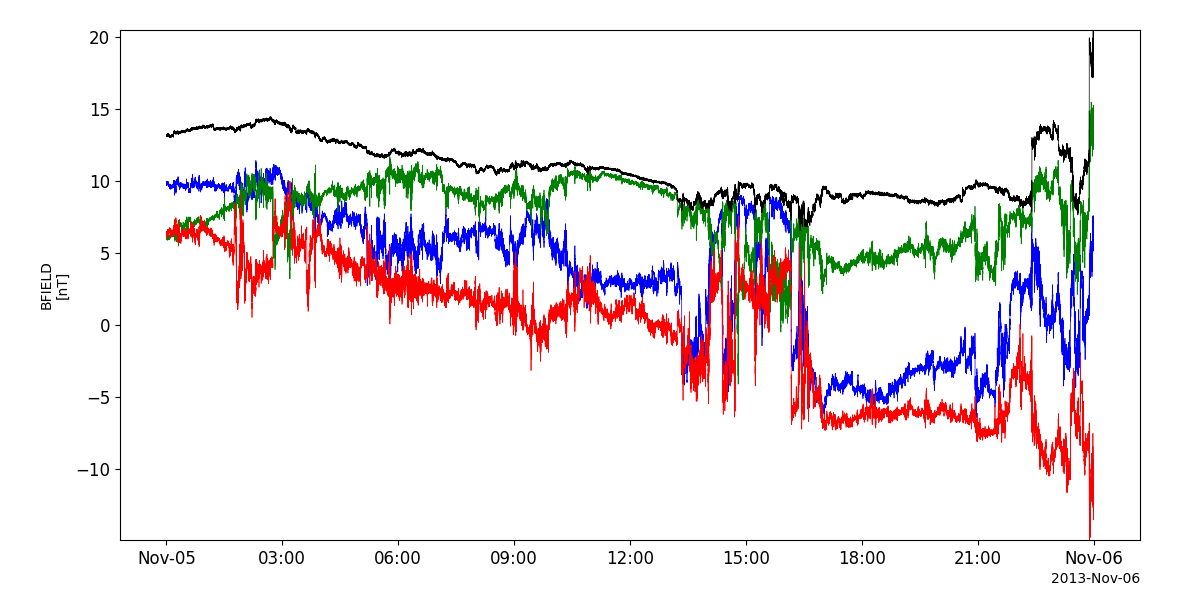
>>> import pyspedas
>>> from pyspedas import tplot
>>> mag_vars = pyspedas.projects.stereo.mag(trange=['2013-1-5', '2013-1-6'])
>>> tplot('BFIELD')
Example
import pyspedas
from pyspedas import tplot
mag_vars = pyspedas.projects.stereo.mag(trange=['2013-11-5', '2013-11-6'])
tplot('BFIELD')
Solar Wind Electron Analyzer (SWEA)
- pyspedas.projects.stereo.swea(trange=['2013-1-5', '2013-1-6'], probe='a', datatype='spec', level='l1', suffix='', prefix='', get_support_data=False, varformat=None, varnames=[], downloadonly=False, notplot=False, no_update=False, time_clip=False)[source]
This function loads data from the Solar Wind Electron Analyzer
- Parameters:
trange (
listofstr) – time range of interest [starttime, endtime] with the format ‘YYYY-MM-DD’,’YYYY-MM-DD’] or to specify more or less than a day [‘YYYY-MM-DD/hh:mm:ss’,’YYYY-MM-DD/hh:mm:ss’] Default: [‘2013-11-5’, ‘2013-11-6’]probe (
str) – Spacecraft probe (‘a’ for ahead, ‘b’ for behind) Default: ‘a’datatype (
str) – Data type; Valid options: disb, dist, spec Default: ‘spec’level (
str) – Default: ‘l1’suffix (
str) – The tplot variable names will be given this suffix. Default: ‘’, no suffix is added.prefix (
str) – The tplot variable names will be given this prefix. Default: ‘’, no prefix is added.get_support_data (
bool) – Data with an attribute “VAR_TYPE” with a value of “support_data” will be loaded into tplot. Default: False. Only loads in data with a “VAR_TYPE” attribute of “data”.varformat (
str) – The file variable formats to load into tplot. Wildcard character “*” is accepted. Default: None. All variables are loaded in.varnames (
listofstr) – List of variable names to load. Default: [], if not specified, all data variables are loadeddownloadonly (
bool) – Set this flag to download the CDF files, but not load them into tplot variables Default: Falsenotplot (
bool) – Return the data in hash tables instead of creating tplot variables Default: Falseno_update (
bool) – If set, only load data from your local cache Default: Falsetime_clip (
bool) – Time clip the variables to exactly the range specified in the trange keyword Default: False
- Return type:
Listoftplot variables created.
Example:
>>> import pyspedas
>>> from pyspedas import tplot
>>> swea_vars = pyspedas.projects.stereo.swea(trange=['2013-1-5', '2013-1-6'])
>>> tplot(sit_vars)
Suprathermal Electron Telescope (STE)
- pyspedas.projects.stereo.ste(trange=['2013-11-5', '2013-11-6'], probe='a', level='l1', suffix='', prefix='', get_support_data=False, varformat=None, varnames=[], downloadonly=False, notplot=False, no_update=False, time_clip=False)[source]
This function loads data from the Suprathermal Electron Telescope
- Parameters:
trange (
listofstr) – time range of interest [starttime, endtime] with the format ‘YYYY-MM-DD’,’YYYY-MM-DD’] or to specify more or less than a day [‘YYYY-MM-DD/hh:mm:ss’,’YYYY-MM-DD/hh:mm:ss’] Default: [‘2013-11-5’, ‘2013-11-6’]probe (
str) – Spacecraft probe (‘a’ for ahead, ‘b’ for behind) Default: ‘a’level (
str) – Default: ‘l1’suffix (
str) – The tplot variable names will be given this suffix. Default: ‘’, no suffix is added.prefix (
str) – The tplot variable names will be given this prefix. Default: ‘’, no prefix is added.get_support_data (
bool) – Data with an attribute “VAR_TYPE” with a value of “support_data” will be loaded into tplot. Default: False. Only loads in data with a “VAR_TYPE” attribute of “data”.varformat (
str) – The file variable formats to load into tplot. Wildcard character “*” is accepted. Default: None. All variables are loaded in.varnames (
listofstr) – List of variable names to load. Default: [], if not specified, all data variables are loadeddownloadonly (
bool) – Set this flag to download the CDF files, but not load them into tplot variables Default: Falsenotplot (
bool) – Return the data in hash tables instead of creating tplot variables Default: Falseno_update (
bool) – If set, only load data from your local cache Default: Falsetime_clip (
bool) – Time clip the variables to exactly the range specified in the trange keyword Default: False
- Return type:
Listoftplot variables created.
Solar Electron Proton Telescope (SEPT)
- pyspedas.projects.stereo.sept(trange=['2013-11-5', '2013-11-6'], probe='a', level='l1', suffix='', prefix='', get_support_data=False, varformat=None, varnames=[], downloadonly=False, notplot=False, no_update=False, time_clip=False)[source]
This function loads data from the Solar Electron Proton Telescope
- Parameters:
trange (
listofstr) – time range of interest [starttime, endtime] with the format ‘YYYY-MM-DD’,’YYYY-MM-DD’] or to specify more or less than a day [‘YYYY-MM-DD/hh:mm:ss’,’YYYY-MM-DD/hh:mm:ss’] Default: [‘2013-11-5’, ‘2013-11-6’]probe (
str) – Spacecraft probe (‘a’ for ahead, ‘b’ for behind) Default: ‘a’level (
str) – Default: ‘l1’suffix (
str) – The tplot variable names will be given this suffix. Default: ‘’, no suffix is added.prefix (
str) – The tplot variable names will be given this prefix. Default: ‘’, no prefix is added.get_support_data (
bool) – Data with an attribute “VAR_TYPE” with a value of “support_data” will be loaded into tplot. Default: False. Only loads in data with a “VAR_TYPE” attribute of “data”.varformat (
str) – The file variable formats to load into tplot. Wildcard character “*” is accepted. Default: None. All variables are loaded in.varnames (
listofstr) – List of variable names to load. Default: [], if not specified, all data variables are loadeddownloadonly (
bool) – Set this flag to download the CDF files, but not load them into tplot variables Default: Falsenotplot (
bool) – Return the data in hash tables instead of creating tplot variables Default: Falseno_update (
bool) – If set, only load data from your local cache Default: Falsetime_clip (
bool) – Time clip the variables to exactly the range specified in the trange keyword Default: False
- Return type:
Listoftplot variables created.
Example:
>>> import pyspedas
>>> from pyspedas import tplot
>>> sept_vars = pyspedas.projects.stereo.sept(trange=['2013-1-5', '2013-1-6'])
>>> tplot(sit_vars)
Suprathermal Ion Telescope (SIT)
- pyspedas.projects.stereo.sit(trange=['2013-11-5', '2013-11-6'], probe='a', level='l1', suffix='', prefix='', get_support_data=False, varformat=None, varnames=[], downloadonly=False, notplot=False, no_update=False, time_clip=False)[source]
This function loads data from the Suprathermal Ion Telescope
- Parameters:
trange (
listofstr) – time range of interest [starttime, endtime] with the format ‘YYYY-MM-DD’,’YYYY-MM-DD’] or to specify more or less than a day [‘YYYY-MM-DD/hh:mm:ss’,’YYYY-MM-DD/hh:mm:ss’] Default: [‘2013-11-5’, ‘2013-11-6’]probe (
str) – Spacecraft probe (‘a’ for ahead, ‘b’ for behind) Default: ‘a’level (
str) – Default: ‘l1’suffix (
str) – The tplot variable names will be given this suffix. Default: ‘’, no suffix is added.prefix (
str) – The tplot variable names will be given this prefix. Default: ‘’, no prefix is added.get_support_data (
bool) – Data with an attribute “VAR_TYPE” with a value of “support_data” will be loaded into tplot. Default: False. Only loads in data with a “VAR_TYPE” attribute of “data”.varformat (
str) – The file variable formats to load into tplot. Wildcard character “*” is accepted. Default: None. All variables are loaded in.varnames (
listofstr) – List of variable names to load. Default: [], if not specified, all data variables are loadeddownloadonly (
bool) – Set this flag to download the CDF files, but not load them into tplot variables Default: Falsenotplot (
bool) – Return the data in hash tables instead of creating tplot variables Default: Falseno_update (
bool) – If set, only load data from your local cache Default: Falsetime_clip (
bool) – Time clip the variables to exactly the range specified in the trange keyword Default: False
- Return type:
Listoftplot variables created.
Example:
>>> import pyspedas
>>> from pyspedas import tplot
>>> sit_vars = pyspedas.projects.stereo.sit(trange=['2013-1-5', '2013-1-6'])
>>> tplot(sit_vars)
Low Energy Telescope (LET)
- pyspedas.projects.stereo.let(trange=['2013-11-5', '2013-11-6'], probe='a', level='l1', suffix='', prefix='', get_support_data=False, varformat=None, varnames=[], downloadonly=False, notplot=False, no_update=False, time_clip=False)[source]
This function loads data from the Low Energy Telescope
- Parameters:
trange (
listofstr) – time range of interest [starttime, endtime] with the format ‘YYYY-MM-DD’,’YYYY-MM-DD’] or to specify more or less than a day [‘YYYY-MM-DD/hh:mm:ss’,’YYYY-MM-DD/hh:mm:ss’] Default: [‘2013-11-5’, ‘2013-11-6’]probe (
str) – Spacecraft probe (‘a’ for ahead, ‘b’ for behind) Default: ‘a’level (
str) – Default: ‘l1’suffix (
str) – The tplot variable names will be given this suffix. Default: ‘’, no suffix is added.prefix (
str) – The tplot variable names will be given this prefix. Default: ‘’, no prefix is added.get_support_data (
bool) – Data with an attribute “VAR_TYPE” with a value of “support_data” will be loaded into tplot. Default: False. Only loads in data with a “VAR_TYPE” attribute of “data”.varformat (
str) – The file variable formats to load into tplot. Wildcard character “*” is accepted. Default: None. All variables are loaded in.varnames (
listofstr) – List of variable names to load. Default: [], if not specified, all data variables are loadeddownloadonly (
bool) – Set this flag to download the CDF files, but not load them into tplot variables Default: Falsenotplot (
bool) – Return the data in hash tables instead of creating tplot variables Default: Falseno_update (
bool) – If set, only load data from your local cache Default: Falsetime_clip (
bool) – Time clip the variables to exactly the range specified in the trange keyword Default: False
- Return type:
Listoftplot variables created.
Example:
>>> import pyspedas
>>> from pyspedas import tplot
>>> sit_vars = pyspedas.projects.stereo.let(trange=['2013-1-5', '2013-1-6'])
>>> tplot(sit_vars)
High Energy Telescope (HET)
PLAsma and SupraThermal Ion Composition (PLASTIC)
- pyspedas.projects.stereo.plastic(trange=['2013-11-5', '2013-11-6'], probe='a', datatype='1min', level='l2', suffix='', prefix='', get_support_data=False, varformat=None, varnames=[], downloadonly=False, notplot=False, no_update=False, time_clip=False)[source]
This function loads data from the PLASTIC instrument
- Parameters:
trange (
listofstr) – time range of interest [starttime, endtime] with the format ‘YYYY-MM-DD’,’YYYY-MM-DD’] or to specify more or less than a day [‘YYYY-MM-DD/hh:mm:ss’,’YYYY-MM-DD/hh:mm:ss’] Default: [‘2013-11-5’, ‘2013-11-6’]probe (
str) – Spacecraft probe (‘a’ for ahead, ‘b’ for behind) Default: ‘a’datatype (
str) – Data type; Valid options: 1min Default: ‘1min’suffix (
str) – The tplot variable names will be given this suffix. Default: ‘’, no suffix is added.prefix (
str) – The tplot variable names will be given this prefix. Default: ‘’, no prefix is added.get_support_data (
bool) – Data with an attribute “VAR_TYPE” with a value of “support_data” will be loaded into tplot. Default: False. Only loads in data with a “VAR_TYPE” attribute of “data”.varformat (
str) – The file variable formats to load into tplot. Wildcard character “*” is accepted. Default: None. All variables are loaded in.varnames (
listofstr) – List of variable names to load. Default: [], if not specified, all data variables are loadeddownloadonly (
bool) – Set this flag to download the CDF files, but not load them into tplot variables Default: Falsenotplot (
bool) – Return the data in hash tables instead of creating tplot variables Default: Falseno_update (
bool) – If set, only load data from your local cache Default: Falsetime_clip (
bool) – Time clip the variables to exactly the range specified in the trange keyword Default: False
- Return type:
Listoftplot variables created.
Example:
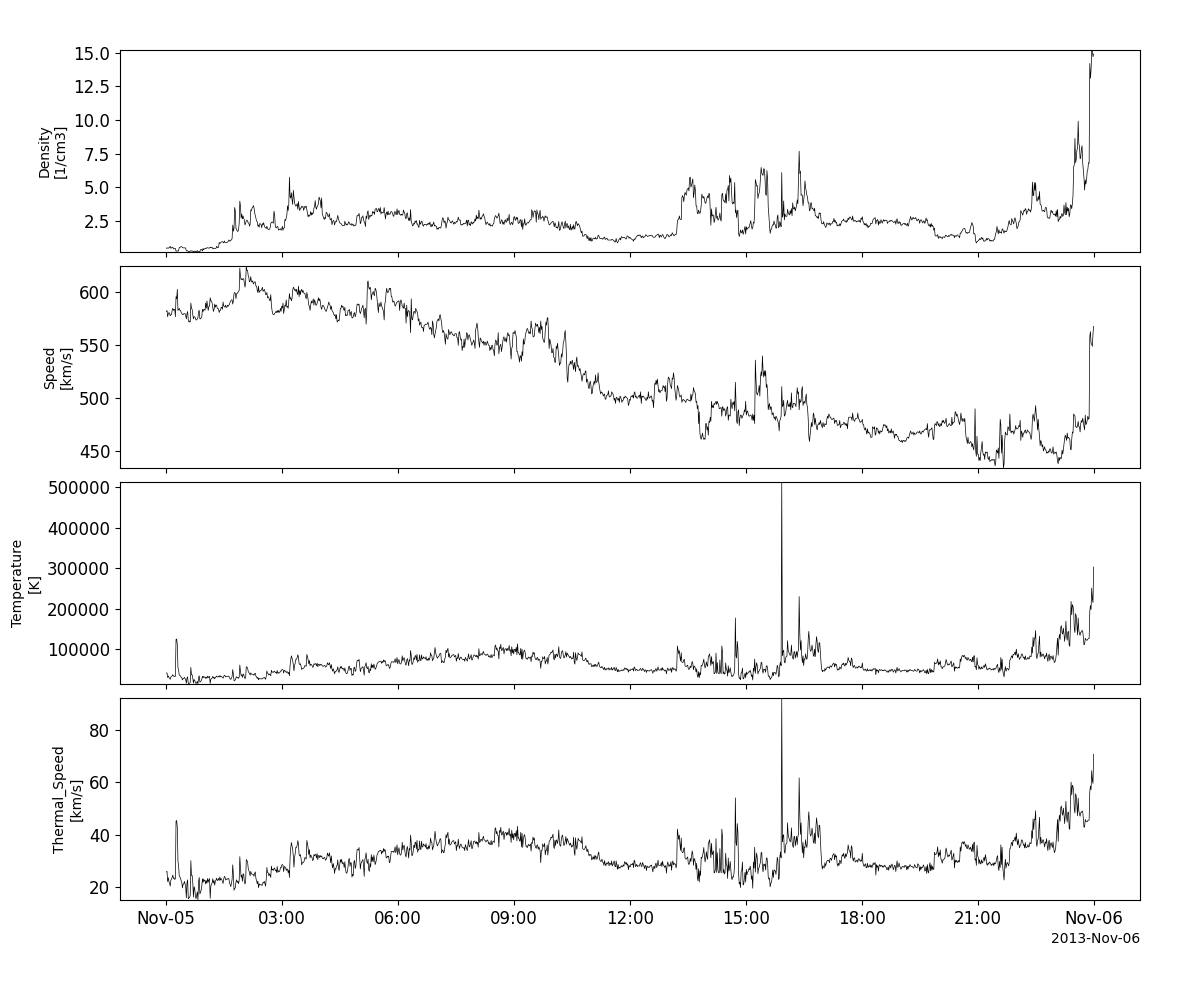
>>> import pyspedas
>>> from pyspedas import tplot
>>> plastic_vars = pyspedas.projects.stereo.plastic(trange=['2013-11-5', '2013-11-6'])
>>> tplot(['proton_number_density', 'proton_bulk_speed', 'proton_temperature', 'proton_thermal_speed'])
Example
import pyspedas
from pyspedas import tplot
plastic_vars = pyspedas.projects.stereo.plastic(trange=['2013-11-5', '2013-11-6'])
tplot(['proton_number_density', 'proton_bulk_speed', 'proton_temperature', 'proton_thermal_speed'])