Colorado Student Space Weather Experiment (CSSWE)
The routines in this module can be used to load data from the Colorado Student Space Weather Experiment (CSSWE) mission.
Relativistic Electron and Proton Telescope integrated little experiment (REPTile)
- pyspedas.projects.csswe.reptile(trange=['2013-11-5', '2013-11-6'], datatype='flux', level='l2', prefix='', suffix='', get_support_data=False, varformat=None, varnames=[], downloadonly=False, notplot=False, no_update=False, time_clip=False, force_download=False)[source]
This function loads data from the Relativistic Electron and Proton Telescope integrated little experiment (REPTile)
- Parameters:
trange (
listofstr) – time range of interest [starttime, endtime] with the format [YYYY-MM-DD, YYYY-MM-DD], or to specify more or less than a day, [YYYY-MM-DD/hh:mm:ss, YYYY-MM-DD/hh:mm:ss]. Default: [‘2013-11-5’, ‘2013-11-6]datatype (
str) –Data type; Valid options:
'counts' for L1 data
'flux' for L2 data
level (
str) – Data level; options: ‘l1’, ‘l2’ (default: l2)prefix (
str) – The tplot variable names will be given this prefix. By default, no prefix is added.suffix (
str) – The tplot variable names will be given this suffix. By default, no suffix is added.get_support_data (
bool) – Data with an attribute “VAR_TYPE” with a value of “support_data” will be loaded into tplot. By default, only loads in data with a “VAR_TYPE” attribute of “data”.varformat (
str) – The file variable formats to load into tplot. Wildcard character “*” is accepted. By default, all variables are loaded in.varnames (
listofstr) – List of variable names to load (if not specified, all data variables are loaded)downloadonly (
bool) – Set this flag to download the CDF files, but not load them into tplot variablesnotplot (
bool) – Return the data in hash tables instead of creating tplot variablesno_update (
bool) – If set, only load data from your local cachetime_clip (
bool) – Time clip the variables to exactly the range specified in the trange keywordforce_download (
bool) – Download file even if local version is more recent than server version Default: False
- Returns:
List of tplot variables created.
- Return type:
Example
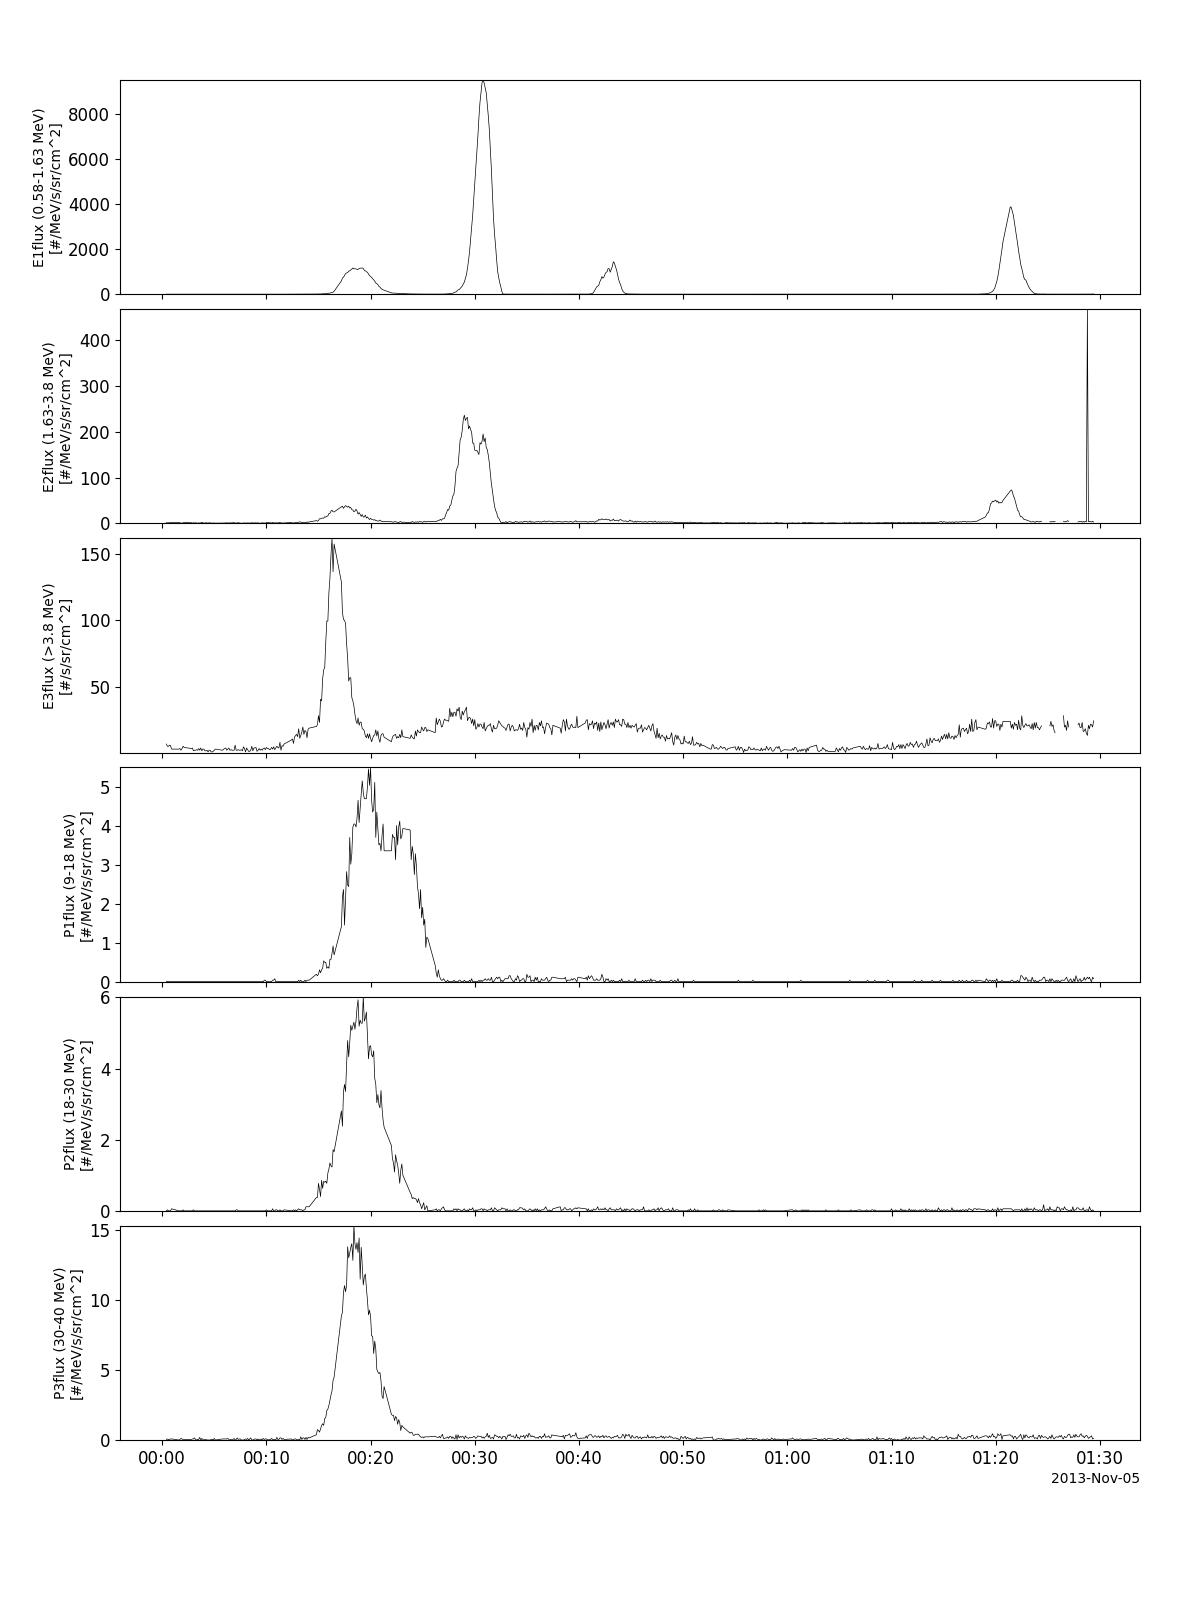
import pyspedas
from pyspedas import tplot
reptile_vars = pyspedas.projects.csswe.reptile(trange=['2013-11-5', '2013-11-6'])
tplot(['E1flux', 'E2flux', 'E3flux', 'P1flux', 'P2flux', 'P3flux'])