Parker Solar Probe (PSP)
The routines in this module can be used to load data from the Parker Solar Probe (PSP) mission.
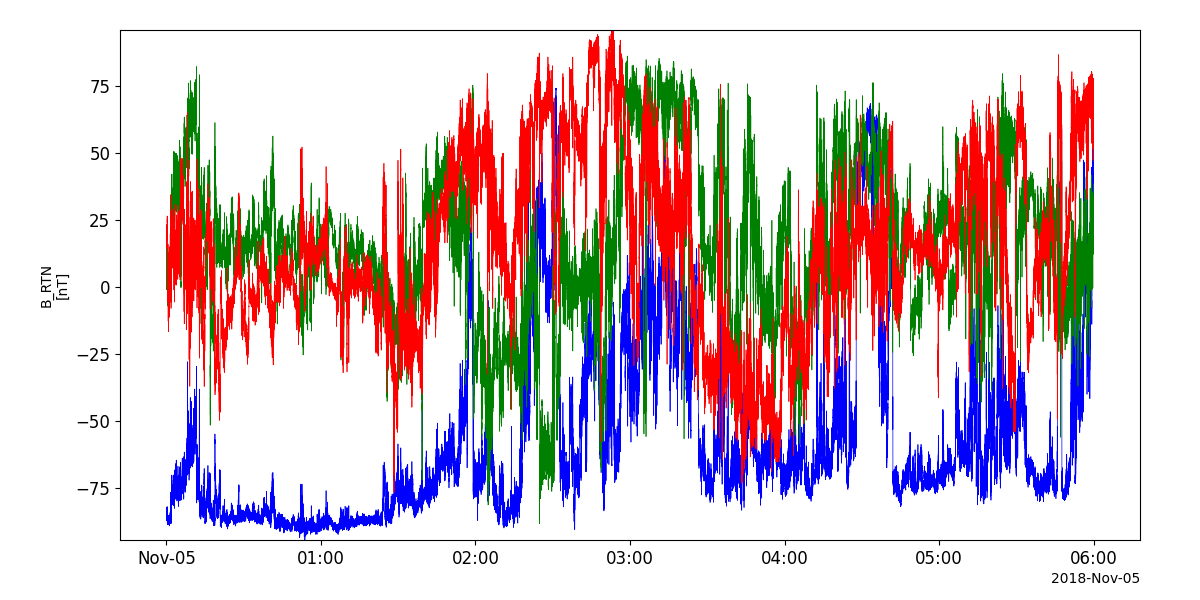
Electromagnetic Fields Investigation (FIELDS)
- pyspedas.projects.psp.fields(trange=['2018-11-5', '2018-11-6'], datatype='mag_rtn', level=None, suffix='', prefix='', get_support_data=False, varformat=None, varnames=[], downloadonly=False, notplot=False, no_update=False, time_clip=False, username=None, password=None, last_version=False, force_download=False, version=None)[source]
This function loads Parker Solar Probe FIELDS data
- Parameters:
trange (
listofstr) – time range of interest [starttime, endtime] with the format ‘YYYY-MM-DD’,’YYYY-MM-DD’] or to specify more or less than a day [‘YYYY-MM-DD/hh:mm:ss’,’YYYY-MM-DD/hh:mm:ss’]datatype (
str) –- Data type; Valid options include:
‘mag_RTN’ ‘mag_RTN_1min’ ‘mag_rtn_4_per_cycle’ (SPDF only) ‘mag_RTN_4_Sa_per_Cyc’ ‘mag_SC’ ‘mag_SC_1min’ ‘mag_sc_4_per_cycle’ (SPDF only) ‘mag_SC_4_Sa_per_Cyc’ ‘mag_VSO’ (limited dates) ‘rfs_burst’ (limited dates) ‘rfs_hfr’, ‘rfs_lfr’ ‘f2_100bps’ ‘dfb_dc_spec’ ‘dfb_ac_spec’ ‘dfb_dc_xspec’ ‘dfb_ac_xspec’ ‘merged_scam_wf’ ‘sqtn_rfs_V1V2’
suffix (
str) – The tplot variable names will be given this suffix. By default, no prefix is added. Default: ‘’prefix (
str) – The tplot variable names will be given this prefix. By default, no prefix is added. Default: ‘’get_support_data (
bool) – Data with an attribute “VAR_TYPE” with a value of “support_data” will be loaded into tplot. By default, this flag is False but FIELDS support data is always loaded for datatypes where filtering on quality flags is supported.varformat (
str) – The file variable formats to load into tplot. Wildcard character “*” is accepted. By default, all variables are loaded in.varnames (
listofstr) – List of variable names to load (if not specified, all data variables are loaded)downloadonly (
bool) – Set this flag to download the CDF files, but not load them into tplot variablesnotplot (
bool) – Return the data in hash tables instead of creating tplot variablesno_update (
bool) – If set, only load data from your local cachetime_clip (
bool) – Time clip the variables to exactly the range specified in the trange keywordusername (
str) – Username to use for authentication.If passed, attempt to download data from the FIELDS Instrument Team server instead of the fully public server at SPDF. Provides access to unpublished, V02 files.
- Implemented for dataypes:
‘mag_RTN_1min’ ‘mag_RTN_4_Sa_per_Cyc’ ‘mag_SC’ ‘mag_SC_1min’ ‘mag_SC_4_Sa_per_Cyc’ ‘sqtn_rfs_V1V2’
password (
str) – Password to use for authenticationlast_version (
bool) – If True, only download the highest-numbered file versionforce_download (
bool) – If True, downloads the file even if a newer version exists locally. Default: False.version (
str) – If supplied, the load routine will look for this specific CDF version, rather than a wildcard pattern matching any version. Valid version strings look like “vN.M” for FIELDS sqtn_rfs_v1v1 data, or “vNN” for all other data types. Default: None
- Return type:
Listoftplot variables created.
Example
import pyspedas
from pyspedas import tplot
fields_vars = pyspedas.projects.psp.fields(trange=['2018-11-5', '2018-11-5/06:00'], datatype='mag_rtn', level='l2', time_clip=True)
tplot('psp_fld_l2_mag_RTN')
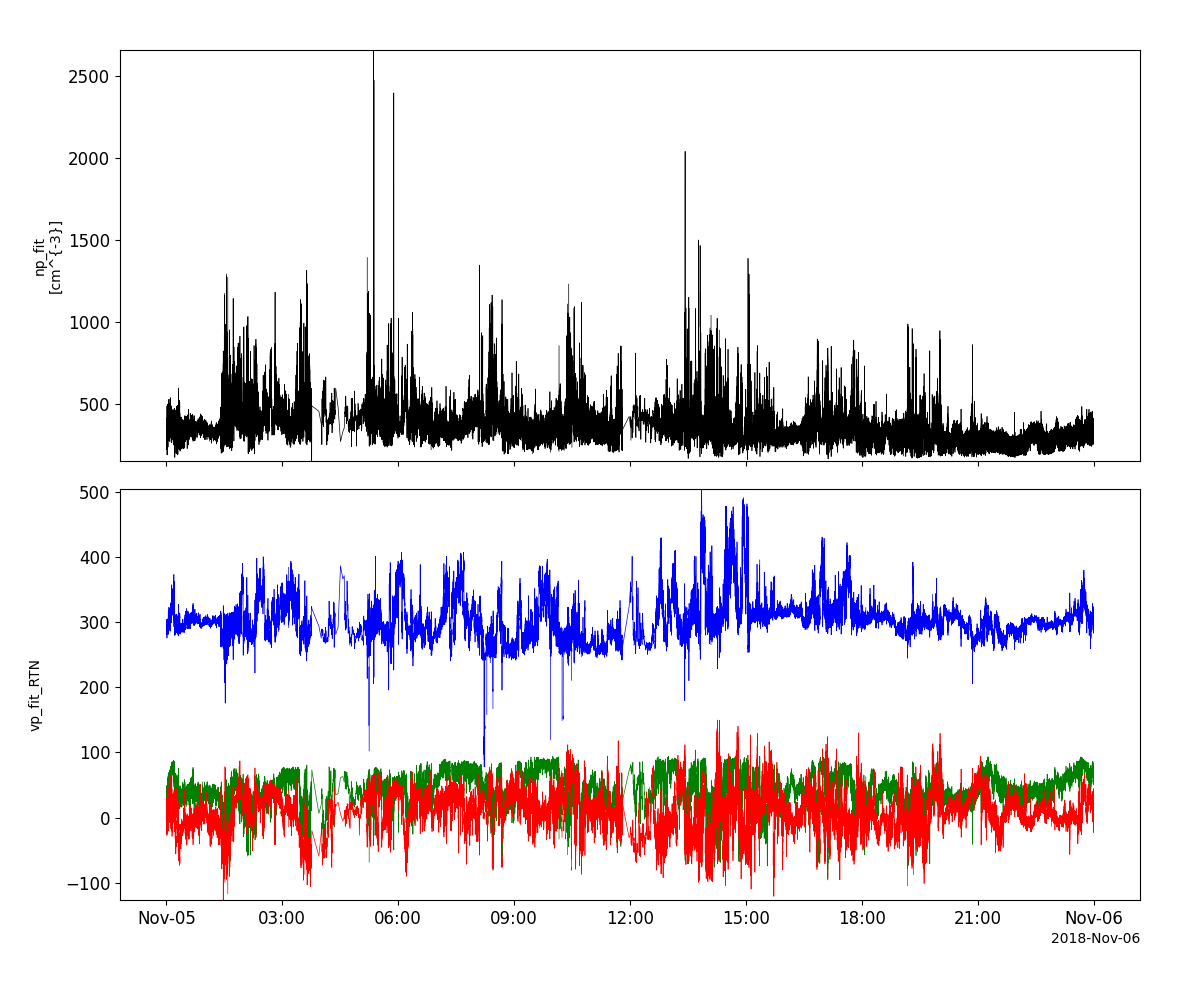
Solar Probe Cup
- pyspedas.projects.psp.spc(trange=['2018-11-5', '2018-11-6'], datatype='l3i', level='l3', suffix='', prefix='', get_support_data=False, varformat=None, varnames=[], downloadonly=False, notplot=False, no_update=False, time_clip=False, username=None, password=None, last_version=False, force_download=False, version=None)[source]
This function loads Parker Solar Probe Solar Probe Cup data
- Parameters:
trange (
listofstr) – time range of interest [starttime, endtime] with the format ‘YYYY-MM-DD’,’YYYY-MM-DD’] or to specify more or less than a day [‘YYYY-MM-DD/hh:mm:ss’,’YYYY-MM-DD/hh:mm:ss’]datatype (
str) –- Data type; Valid options include:
‘l3i’ (level=’l3’) ‘l2i’ (level=’l2’)
suffix (
str) – The tplot variable names will be given this suffix. By default, no prefix is added. Default: ‘’prefix (
str) – The tplot variable names will be given this prefix. By default, no prefix is added. Default: ‘’get_support_data (
bool) – Data with an attribute “VAR_TYPE” with a value of “support_data” will be loaded into tplot. By default, only loads in data with a “VAR_TYPE” attribute of “data”.varformat (
str) – The file variable formats to load into tplot. Wildcard character “*” is accepted. By default, all variables are loaded in.varnames (
listofstr) – List of variable names to load (if not specified, all data variables are loaded)downloadonly (
bool) – Set this flag to download the CDF files, but not load them into tplot variablesnotplot (
bool) – Return the data in hash tables instead of creating tplot variablesno_update (
bool) – If set, only load data from your local cachetime_clip (
bool) – Time clip the variables to exactly the range specified in the trange keywordusername (
str) – Username to use for authentication.If passed, attempt to download data from the SWEAP Instrument Team server instead of the fully public server at SPDF. Provides access to unpublished files.
password (
str) – Password to use for authenticationlast_version (
bool) – If True, only download the highest-numbered file versionforce_download (
bool) – If True, downloads the file even if a newer version exists locally. Default: False.version (
str) – If supplied, the load routine will look for this specific CDF version, rather than a wildcard pattern matching any version. Valid version strings look like “vN.M” for FIELDS sqtn_rfs_v1v1 data, or “vNN” for all other data types. Default: None
- Return type:
Listoftplot variables created.
Example
import pyspedas
from pyspedas import tplot
spc_vars = pyspedas.projects.psp.spc(trange=['2018-11-5', '2018-11-6'], datatype='l3i', level='l3')
tplot(['np_fit', 'vp_fit_RTN'])
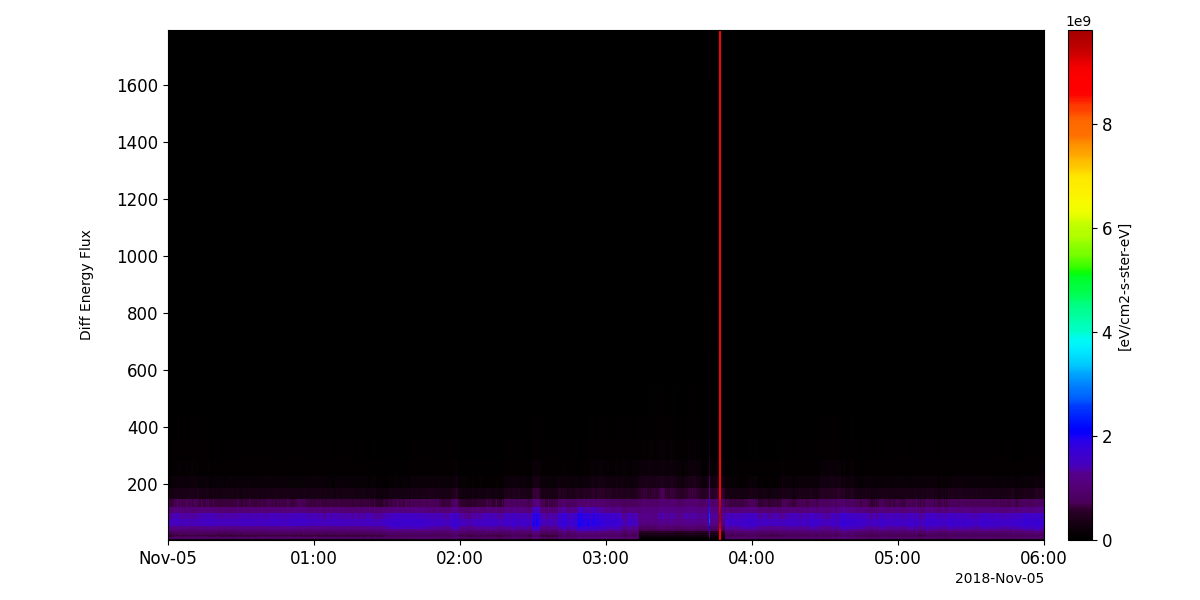
SWEAP/SPAN-e
- pyspedas.projects.psp.spe(trange=['2018-11-5', '2018-11-6'], datatype='spa_sf1_32e', level='l2', suffix='', prefix='', get_support_data=False, varformat=None, varnames=[], downloadonly=False, notplot=False, no_update=False, time_clip=False, last_version=False, force_download=False, version=None)[source]
This function loads Parker Solar Probe SWEAP/SPAN-e data
- Parameters:
trange (
listofstr) – time range of interest [starttime, endtime] with the format ‘YYYY-MM-DD’,’YYYY-MM-DD’] or to specify more or less than a day [‘YYYY-MM-DD/hh:mm:ss’,’YYYY-MM-DD/hh:mm:ss’]datatype (
str) –- Data type; Valid options include:
spa_sf0_pad (L3) spb_sf0_pad (L3) spe_sf0_pad (L3) spa_sf1_32e (L2) spb_sf1_32e (L2) spa_sf0_16ax8dx32e (L2) spb_sf0_16ax8dx32e (L2)
suffix (
str) – The tplot variable names will be given this suffix. By default, no prefix is added. Default: ‘’prefix (
str) – The tplot variable names will be given this prefix. By default, no prefix is added. Default: ‘’get_support_data (
bool) – Data with an attribute “VAR_TYPE” with a value of “support_data” will be loaded into tplot. By default, only loads in data with a “VAR_TYPE” attribute of “data”.varformat (
str) – The file variable formats to load into tplot. Wildcard character “*” is accepted. By default, all variables are loaded in.varnames (
listofstr) – List of variable names to load (if not specified, all data variables are loaded)downloadonly (
bool) – Set this flag to download the CDF files, but not load them into tplot variablesnotplot (
bool) – Return the data in hash tables instead of creating tplot variablesno_update (
bool) – If set, only load data from your local cachetime_clip (
bool) – Time clip the variables to exactly the range specified in the trange keywordlast_version (
bool) – If True, only download the highest-numbered file versionforce_download (
bool) – If True, downloads the file even if a newer version exists locally. Default: False.version (
str) – If supplied, the load routine will look for this specific CDF version, rather than a wildcard pattern matching any version. Valid version strings look like “vN.M” for FIELDS sqtn_rfs_v1v1 data, or “vNN” for all other data types. Default: None
- Return type:
Listoftplot variables created.
Example
import pyspedas
from pyspedas import tplot
spe_vars = pyspedas.projects.psp.spe(trange=['2018-11-5', '2018-11-5/06:00'], datatype='spa_sf1_32e', level='l2', time_clip=True)
tplot('EFLUX')
SWEAP/SPAN-i
- pyspedas.projects.psp.spi(trange=['2018-11-5', '2018-11-6'], datatype='sf00_l3_mom', level='l3', suffix='', prefix='', get_support_data=False, varformat=None, varnames=[], downloadonly=False, notplot=False, no_update=False, time_clip=False, username=None, password=None, last_version=False, force_download=False, version=None)[source]
This function loads Parker Solar Probe SWEAP/SPAN-i data
- Parameters:
trange (
listofstr) – time range of interest [starttime, endtime] with the format ‘YYYY-MM-DD’,’YYYY-MM-DD’] or to specify more or less than a day [‘YYYY-MM-DD/hh:mm:ss’,’YYYY-MM-DD/hh:mm:ss’]datatype (
str) –- Data type; Valid options Include:
‘sf00_l3_mom’: Moments of the Proton distribution function (RTN) ‘sf0a_l3_mom’: Moments of the Alpha distribution function (RTN) ‘sf00_l3_mom_inst’: Moments of the Proton distribution function (Instrument Frame) ‘sf0a_l3_mom_inst’: Moments of the Alpha distribution function (Instrument Frame)
suffix (
str) – The tplot variable names will be given this suffix. By default, no prefix is added. Default: ‘’prefix (
str) – The tplot variable names will be given this prefix. By default, no prefix is added. Default: ‘’get_support_data (
bool) – Data with an attribute “VAR_TYPE” with a value of “support_data” will be loaded into tplot. By default, only loads in data with a “VAR_TYPE” attribute of “data”.varformat (
str) – The file variable formats to load into tplot. Wildcard character “*” is accepted. By default, all variables are loaded in.varnames (
listofstr) – List of variable names to load (if not specified, all data variables are loaded)downloadonly (
bool) – Set this flag to download the CDF files, but not load them into tplot variablesnotplot (
bool) – Return the data in hash tables instead of creating tplot variablesno_update (
bool) – If set, only load data from your local cachetime_clip (
bool) – Time clip the variables to exactly the range specified in the trange keywordusername (
str) – Username to use for authentication.If passed, attempt to download data from the SWEAP Instrument Team server instead of the fully public server at SPDF. Provides access to unpublished files.
password (
str) – Password to use for authenticationlast_version (
bool) – If True, only download the highest-numbered file versionforce_download (
bool) – If True, downloads the file even if a newer version exists locally. Default: False.version (
str) – If supplied, the load routine will look for this specific CDF version, rather than a wildcard pattern matching any version. Valid version strings look like “vN.M” for FIELDS sqtn_rfs_v1v1 data, or “vNN” for all other data types. Default: None
- Return type:
Listoftplot variables created.
Example
import pyspedas
from pyspedas import tplot
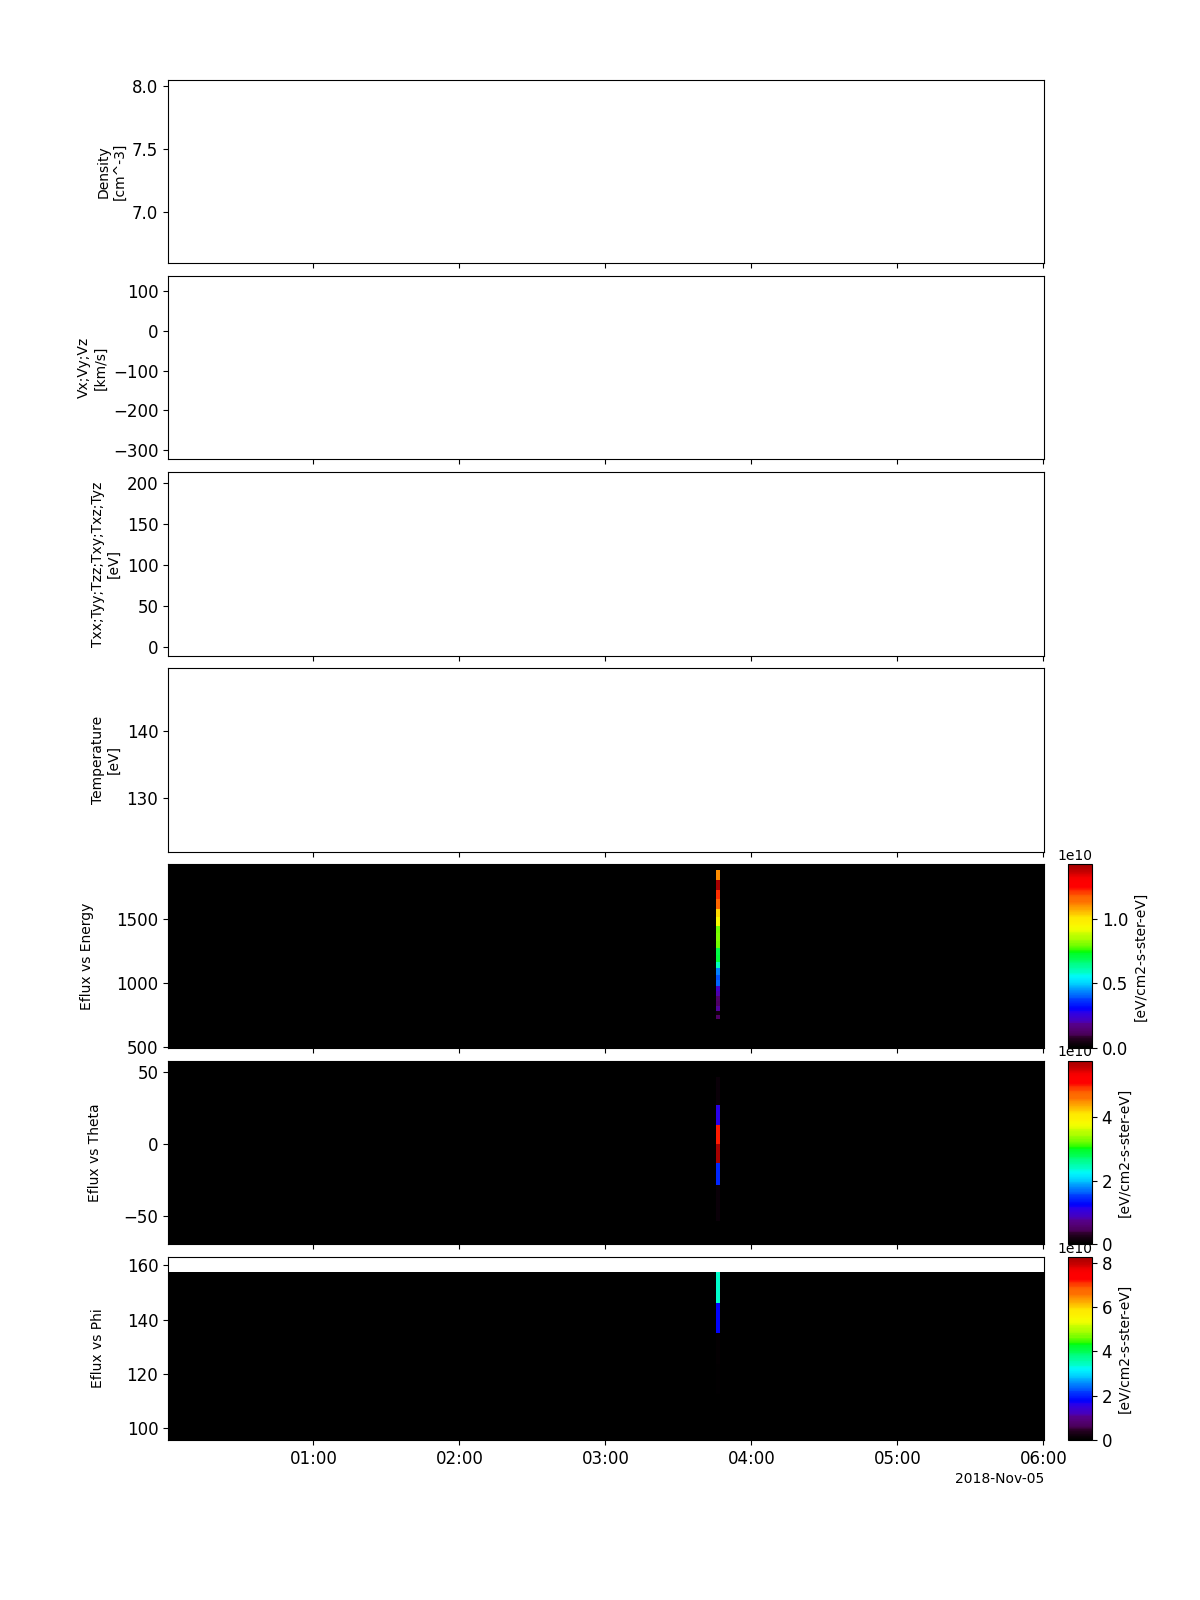
spi_vars = pyspedas.projects.psp.spi(trange=['2018-11-5', '2018-11-5/06:00'], datatype='spi_sf0a_mom_inst', level='l3', time_clip=True)
tplot(['DENS', 'VEL', 'T_TENSOR', 'TEMP', 'EFLUX_VS_ENERGY', 'EFLUX_VS_THETA', 'EFLUX_VS_PHI'])
IS☉IS/EPI-Hi
- pyspedas.projects.psp.epihi(trange=['2018-11-5', '2018-11-6'], datatype='let1_rates1h', level='l2', suffix='', prefix='', get_support_data=False, varformat=None, varnames=[], downloadonly=False, notplot=False, no_update=False, time_clip=False, last_version=False, force_download=False, version=None)[source]
This function loads Parker Solar Probe ISoIS/EPI-Hi data
- Parameters:
trange (
listofstr) – time range of interest [starttime, endtime] with the format ‘YYYY-MM-DD’,’YYYY-MM-DD’] or to specify more or less than a day [‘YYYY-MM-DD/hh:mm:ss’,’YYYY-MM-DD/hh:mm:ss’]datatype (
str) – Data type; Valid options:suffix (
str) – The tplot variable names will be given this suffix. By default, no prefix is added. Default: ‘’prefix (
str) – The tplot variable names will be given this prefix. By default, no prefix is added. Default: ‘’get_support_data (
bool) – Data with an attribute “VAR_TYPE” with a value of “support_data” will be loaded into tplot. By default, only loads in data with a “VAR_TYPE” attribute of “data”.varformat (
str) – The file variable formats to load into tplot. Wildcard character “*” is accepted. By default, all variables are loaded in.varnames (
listofstr) – List of variable names to load (if not specified, all data variables are loaded)downloadonly (
bool) – Set this flag to download the CDF files, but not load them into tplot variablesnotplot (
bool) – Return the data in hash tables instead of creating tplot variablesno_update (
bool) – If set, only load data from your local cachetime_clip (
bool) – Time clip the variables to exactly the range specified in the trange keywordlast_version (
bool) – If True, only download the highest-numbered file versionforce_download (
bool) – If True, downloads the file even if a newer version exists locally. Default: False. `version (
str) – If supplied, the load routine will look for this specific CDF version, rather than a wildcard pattern matching any version. Valid version strings look like “vN.M” for FIELDS sqtn_rfs_v1v1 data, or “vNN” for all other data types. Default: None
- Return type:
Listoftplot variables created.
Example
import pyspedas
from pyspedas import tplot
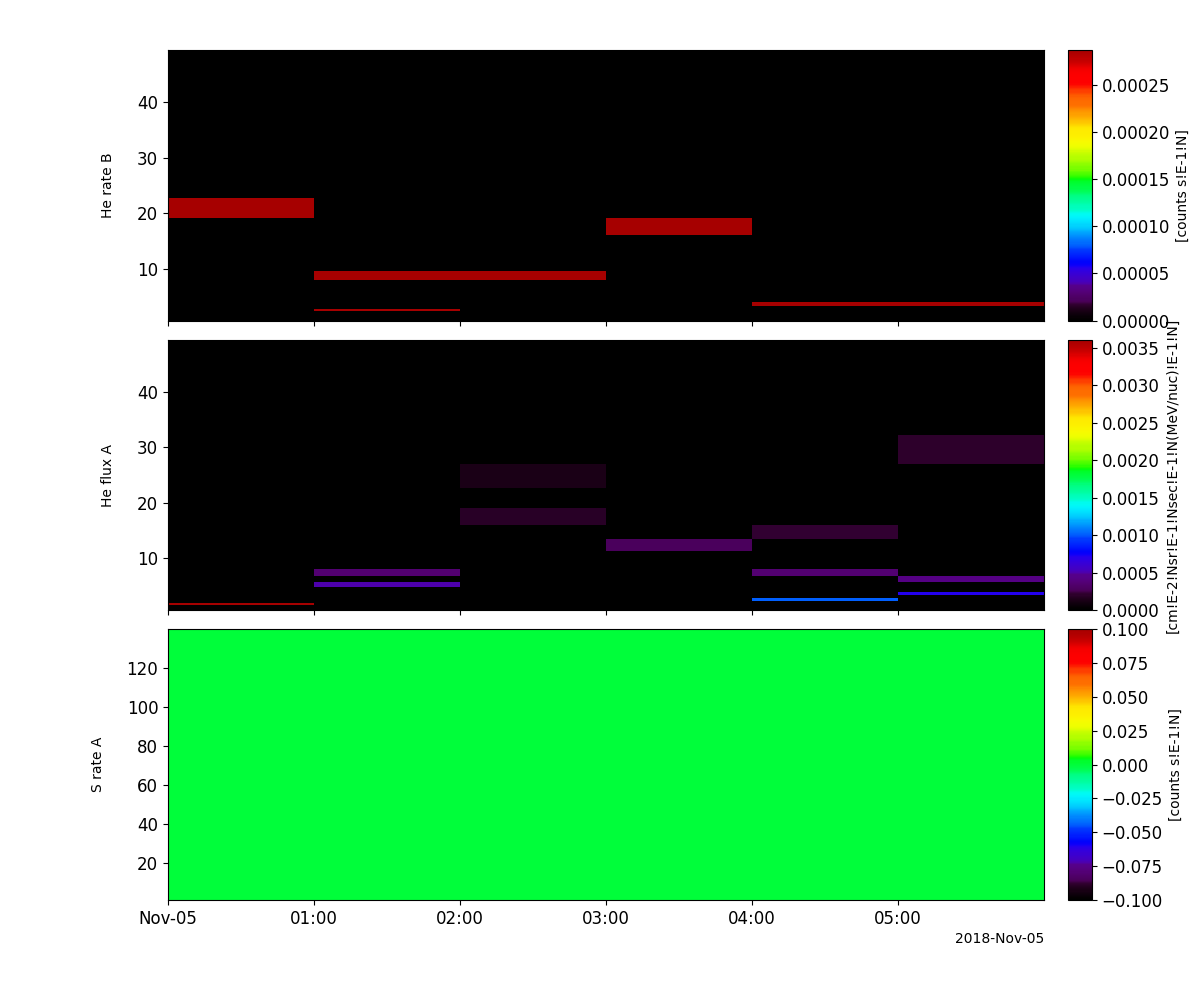
epihi_vars = pyspedas.projects.psp.epihi(trange=['2018-11-5', '2018-11-5/06:00'], datatype='let1_rates1h', level='l2', time_clip=True)
tplot(['B_He_Rate', 'A_He_Flux', 'A_S_Rate'])
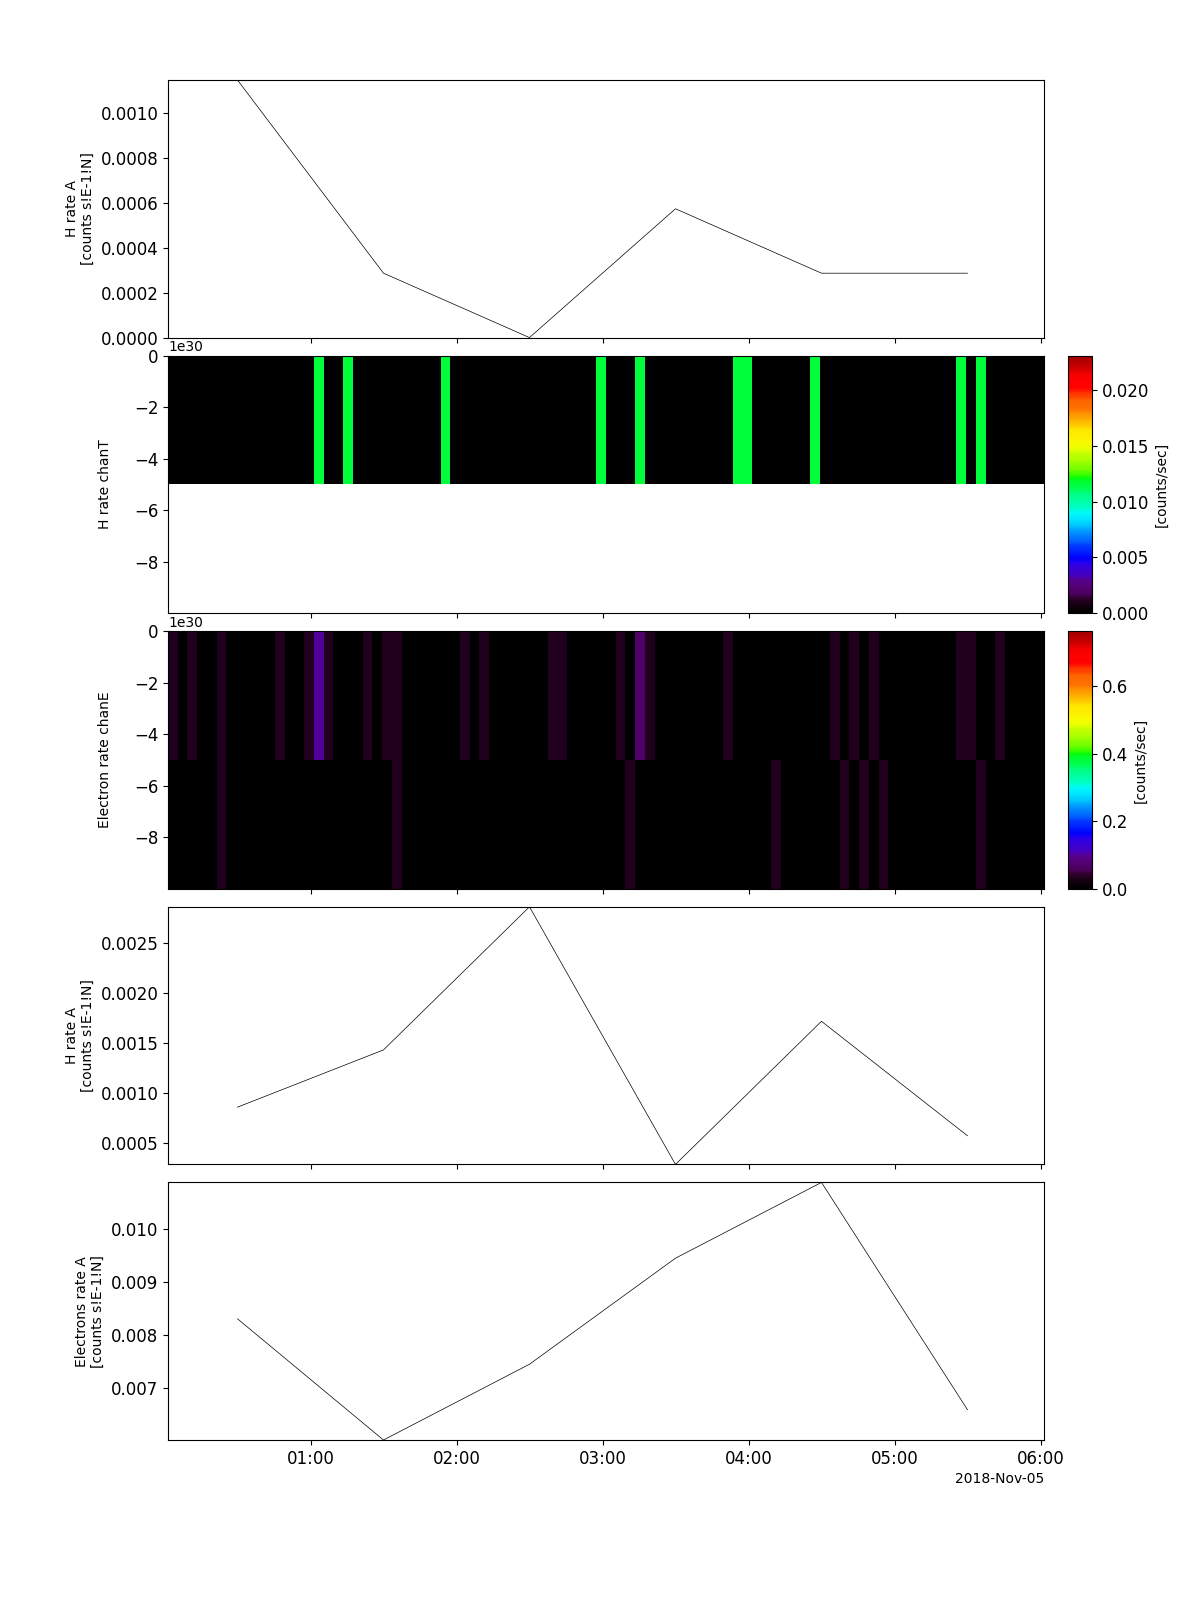
IS☉IS/EPI (merged summary data)
- pyspedas.projects.psp.epi(trange=['2018-11-5', '2018-11-6'], datatype='summary', level='l2', suffix='', prefix='', get_support_data=False, varformat=None, varnames=[], downloadonly=False, notplot=False, no_update=False, time_clip=False, last_version=False, force_download=False, version=None)[source]
This function loads Parker Solar Probe ISoIS/EPI (merged summary) data
- Parameters:
trange (
listofstr) – time range of interest [starttime, endtime] with the format ‘YYYY-MM-DD’,’YYYY-MM-DD’] or to specify more or less than a day [‘YYYY-MM-DD/hh:mm:ss’,’YYYY-MM-DD/hh:mm:ss’]datatype (
str) – Data type; Valid options:suffix (
str) – The tplot variable names will be given this suffix. By default, no prefix is added. Default: ‘’prefix (
str) – The tplot variable names will be given this prefix. By default, no prefix is added. Default: ‘’get_support_data (
bool) – Data with an attribute “VAR_TYPE” with a value of “support_data” will be loaded into tplot. By default, only loads in data with a “VAR_TYPE” attribute of “data”.varformat (
str) – The file variable formats to load into tplot. Wildcard character “*” is accepted. By default, all variables are loaded in.varnames (
listofstr) – List of variable names to load (if not specified, all data variables are loaded)downloadonly (
bool) – Set this flag to download the CDF files, but not load them into tplot variablesnotplot (
bool) – Return the data in hash tables instead of creating tplot variablesno_update (
bool) – If set, only load data from your local cachetime_clip (
bool) – Time clip the variables to exactly the range specified in the trange keywordlast_version (
bool) – If True, only download the highest-numbered file versionforce_download (
bool) – If True, downloads the file even if a newer version exists locally. Default: False.version (
str) – If supplied, the load routine will look for this specific CDF version, rather than a wildcard pattern matching any version. Valid version strings look like “vN.M” for FIELDS sqtn_rfs_v1v1 data, or “vNN” for all other data types. Default: None
- Return type:
Listoftplot variables created.
Example
import pyspedas
from pyspedas import tplot
epi_vars = pyspedas.projects.psp.epi(trange=['2018-11-5', '2018-11-5/06:00'], datatype='summary', level='l2', time_clip=True)
tplot(['A_H_Rate_TS', 'H_CountRate_ChanT_SP', 'Electron_CountRate_ChanE', 'HET_A_H_Rate_TS', 'HET_A_Electrons_Rate_TS'])