Arase (ERG)
The routines in this module can be used to load data from the Arase mission, as well as several other ground-based datasets made available by the ERG Science Center: https://ergsc.isee.nagoya-u.jp
Attitude Data
- pyspedas.projects.erg.att(trange: List[str] = ['2017-04-01', '2017-04-02'], level: str = 'l2', downloadonly: bool = False, notplot: bool = False, no_update: bool = False, uname: str | None = None, passwd: str | None = None, force_download: bool = False) List[str][source]
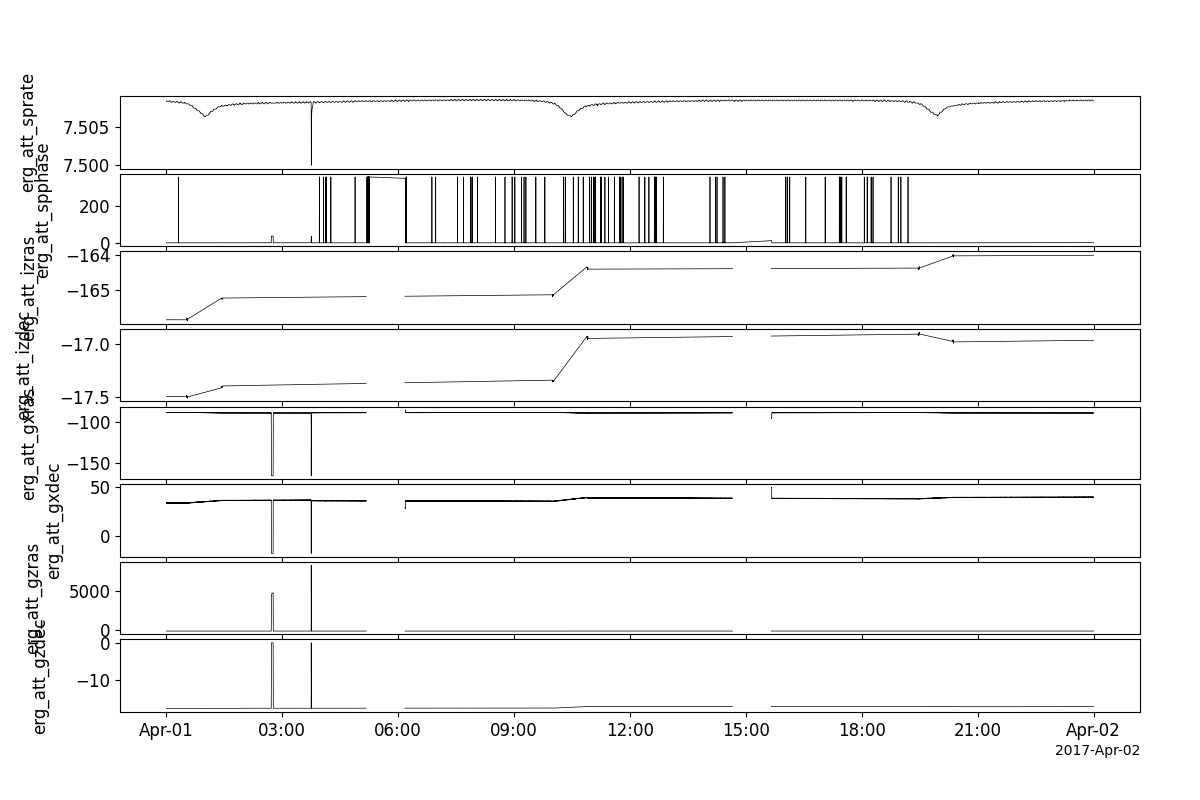
This function loads attitude data from the Arase mission
- Parameters:
trange (
listofstr) – time range of interest [starttime, endtime] with the format ‘YYYY-MM-DD’,’YYYY-MM-DD’] or to specify more or less than a day [‘YYYY-MM-DD/hh:mm:ss’,’YYYY-MM-DD/hh:mm:ss’] Default: [‘2017-04-01’, ‘2017-04-02’]level (
str) – Data level; Valid options: ‘l2’ Default: ‘l2’downloadonly (
bool) – Set this flag to download the files, but not load them into tplot variables. Default: Falsenotplot (
bool) – Return the data in hash tables instead of creating tplot variables. Default: Falseno_update (
bool) – If set, only load data from your local cache. Default: Falseuname (
str) – User name. Default: Nonepasswd (
str) – Password. Default: Noneforce_download (
bool) – Download file even if local version is more recent than server version Default: False
- Returns:
List of tplot variables loaded
- Return type:
Examples
>>> import pyspedas
>>> from pyspedas import tplot
>>> att_vars = pyspedas.projects.erg.att(trange=['2017-04-01', '2017-04-02'])
>>> tplot(['erg_att_sprate', 'erg_att_spphase', 'erg_att_izras', 'erg_att_izdec', 'erg_att_gxras', 'erg_att_gxdec', 'erg_att_gzras', 'erg_att_gzdec'])
Example
import pyspedas
from pyspedas import tplot

att_vars = pyspedas.projects.erg.att(trange=['2017-04-01', '2017-04-02'])
tplot(['erg_att_sprate', 'erg_att_spphase', 'erg_att_izras', 'erg_att_izdec', 'erg_att_gxras', 'erg_att_gxdec', 'erg_att_gzras', 'erg_att_gzdec'])
High-energy Particles – electrons (HEP-e)
- pyspedas.projects.erg.hep(trange: List[str] = ['2017-03-27', '2017-03-28'], datatype: str = 'omniflux', level: str = 'l2', suffix: str = '', get_support_data: bool = True, varformat: str | None = None, varnames: List[str] = [], downloadonly: bool = False, notplot: bool = False, no_update: bool = False, uname: str | None = None, passwd: str | None = None, time_clip: bool = False, ror: bool = True, version: str | None = None, force_download: bool = False) List[str][source]
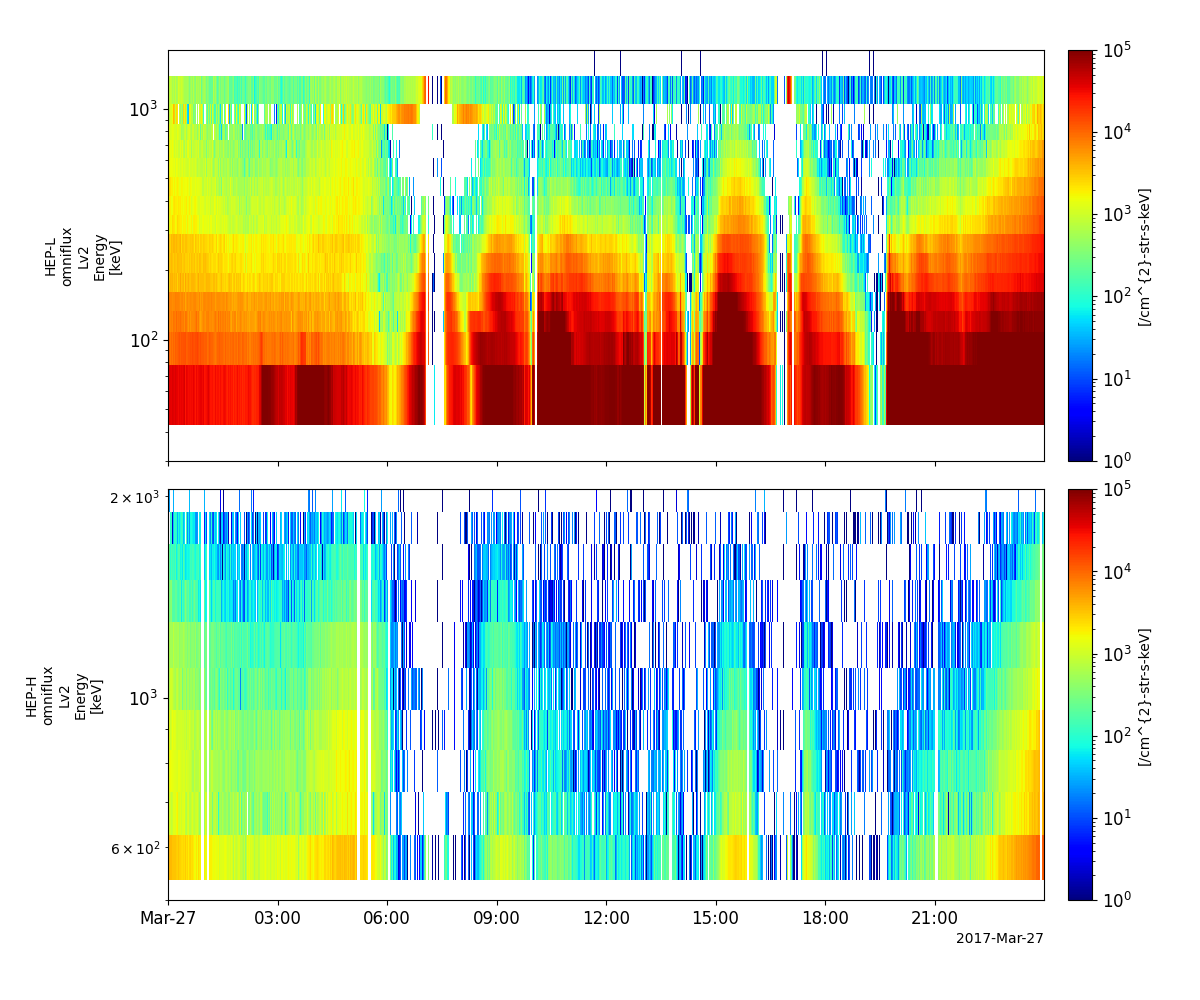
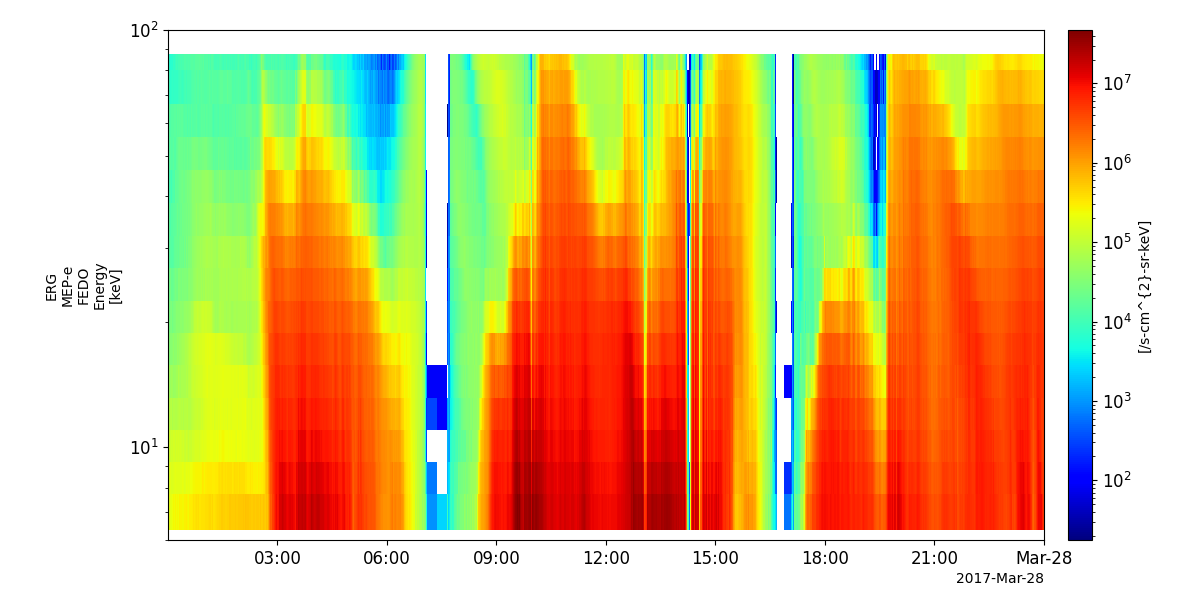
This function loads data from the HEP experiment from the Arase mission
- Parameters:
trange (
listofstr) – time range of interest [starttime, endtime] with the format ‘YYYY-MM-DD’,’YYYY-MM-DD’] or to specify more or less than a day [‘YYYY-MM-DD/hh:mm:ss’,’YYYY-MM-DD/hh:mm:ss’] Default: [‘2017-03-27’, ‘2017-03-28’]datatype (
str) – Data type; Valid ‘l2’ options: ‘omniflux’, ‘3dflux’ Valid ‘l3’ options: ‘pa’level (
str) – Data level; Valid options: ‘l2’,’l3’ Default: ‘l2’suffix (
str) – The tplot variable names will be given this suffix. Default: ‘’get_support_data (
bool) – If true, data with an attribute “VAR_TYPE” with a value of “support_data” or ‘data’ will be loaded into tplot. Default: Truevarformat (
str) – The CDF file variable formats to load into tplot. Wildcard character “*” is accepted. Default: None (all variables will be loaded).varnames (
listofstr) – List of variable names to load. Default: [] (all variables will be loaded)downloadonly (
bool) – Set this flag to download the CDF files, but not load them into tplot variables. Default: Falsenotplot (
bool) – Return the data in hash tables instead of creating tplot variables. Default: Falseno_update (
bool) – If set, only load data from your local cache. Default: Falsetime_clip (
bool) – Time clip the variables to exactly the range specified in the trange keyword. Default: Falseror (
bool) – If set, print PI info and rules of the road. Default: Trueversion (
str) – Set this value to specify the version of cdf files (such as “v01_02”, “v01_03”, …) Default: Noneuname (
str) – User name. Default: Nonepasswd (
str) – Password. Default: Noneforce_download (
bool) – Download file even if local version is more recent than server version Default: False
- Return type:
Listoftplot variables created.
Examples
>>> import pyspedas
>>> from pyspedas import tplot
>>> hep_vars = pyspedas.projects.erg.hep(trange=['2017-03-27', '2017-03-28'])
>>> tplot('erg_hep_l2_FEDO_L')
Example
import pyspedas
from pyspedas import tplot
pyspedas.projects.erg.hep(trange=['2017-03-27', '2017-03-28'])
tplot(['erg_hep_l2_FEDO_L', 'erg_hep_l2_FEDO_H'])
Low-energy Particles – electrons (LEP-e)
- pyspedas.projects.erg.lepe(trange: List[str] = ['2017-04-04', '2017-04-05'], datatype: str = 'omniflux', level: str = 'l2', suffix: str = '', get_support_data: bool = False, varformat: str | None = None, varnames: List[str] = [], downloadonly: bool = False, notplot: bool = False, no_update: bool = False, uname: str | None = None, passwd: str | None = None, time_clip: bool = False, ror: bool = True, version: str | None = None, only_fedu: bool = False, et_diagram: bool = False, force_download: bool = False) List[str][source]
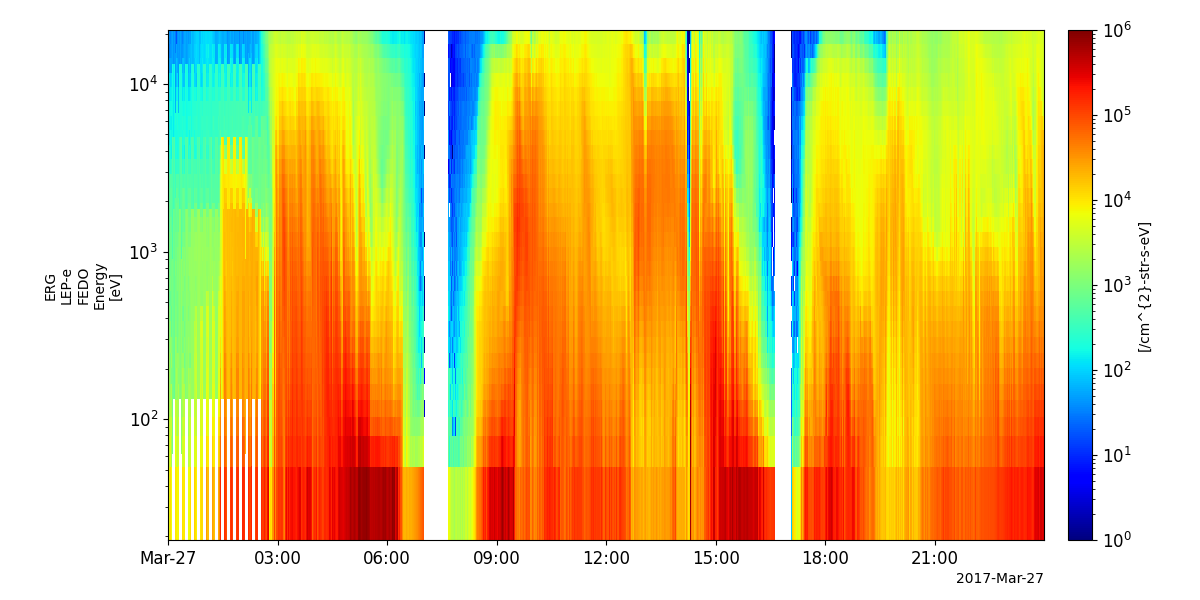
This function loads data from the LEP-e experiment from the Arase mission
- Parameters:
trange (
listofstr) – time range of interest [starttime, endtime] with the format ‘YYYY-MM-DD’,’YYYY-MM-DD’] or to specify more or less than a day [‘YYYY-MM-DD/hh:mm:ss’,’YYYY-MM-DD/hh:mm:ss’] Default: [‘2017-04-04’,’2017-04-05’]datatype (
str) – Data type; Valid ‘l1’ options: None Valid ‘l2’ options: ‘omniflux’, ‘3dflux’, ‘3dflux_finech’ Valid ‘l3’ options: ‘pa’ Default: ‘omniflux’level (
str) – Data level; Valid options: ‘l1’,’l2’,’l3’ Default: ‘l2’suffix (
str) – The tplot variable names will be given this suffix. Default: Noneget_support_data (
bool) – Data with an attribute “VAR_TYPE” with a value of “support_data” will be loaded into tplot. Default: Falsevarformat (
str) – The file variable formats to load into tplot. Wildcard character “*” is accepted. Default: None (all variables are loaded)varnames (
listofstr) – List of variable names to load Default: [] (all data variables are loaded)downloadonly (
bool) – Set this flag to download the CDF files, but not load them into tplot variables. Default: Falsenotplot (
bool) – Return the data in hash tables instead of creating tplot variables. Default: Falseno_update (
bool) – If set, only load data from your local cache. Default: Falsetime_clip (
bool) – Time clip the variables to exactly the range specified in the trange keyword. Default: Falseror (
bool) – If set, print PI info and rules of the road. Default: Trueversion (
str) – Set this value to specify the version of cdf files (such as “v02_02”) Default: Noneonly_fedu (
bool) – If set, not make erg_lepe_l3_pa_enech ??(??:01,01,..32)_FEDU Tplot Variables Default: Falseet_diagram (
bool) – If set, make erg_lepe_l3_pa_pabin ??(??:01,01,..16)_FEDU Tplot Variables Default: Falseuname (
str) – User name. Default: Nonepasswd (
str) – Password. Default: Noneforce_download (
bool) – Download file even if local version is more recent than server version Default: False
- Return type:
Listoftplot variables created.
Examples
>>> import pyspedas
>>> from pyspedas import tplot
>>> lepe_vars = pyspedas.projects.erg.lepe(trange=['2017-03-27', '2017-03-28'])
>>> tplot('erg_lepe_l2_omniflux_FEDO')
import pyspedas
from pyspedas import tplot
pyspedas.projects.erg.lepe(trange=['2017-03-27', '2017-03-28'])
tplot('erg_lepe_l2_omniflux_FEDO')
Low-energy Particles – ion (LEP-i)
- pyspedas.projects.erg.lepi(trange: List[str] = ['2017-07-01', '2017-07-02'], datatype: str = 'omniflux', level: str = 'l2', suffix: str = '', get_support_data: bool = False, varformat: str | None = None, varnames: List[str] = [], downloadonly: bool = False, notplot: bool = False, no_update: bool = False, uname: str | None = None, passwd: str | None = None, time_clip: bool = False, ror: bool = True, version: str | None = None, force_download: bool = False) List[str][source]
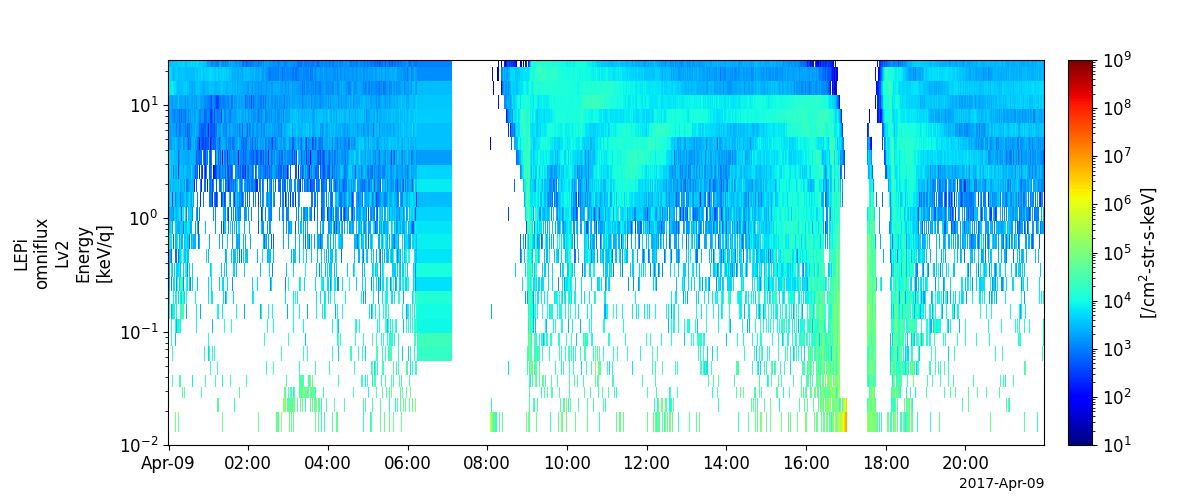
This function loads data from the LEP-i experiment from the Arase mission
- Parameters:
trange (
listofstr) – time range of interest [starttime, endtime] with the format ‘YYYY-MM-DD’,’YYYY-MM-DD’] or to specify more or less than a day [‘YYYY-MM-DD/hh:mm:ss’,’YYYY-MM-DD/hh:mm:ss’] Default: [‘2017-07-01’, ‘2017-07-02’]datatype (
str) – Data type; Valid ‘l2’ options: ‘3dflux’, ‘omniflux’ Valid ‘l3’ options: ‘pa’ Default: ‘omniflux’level (
str) – Data level; Valid options: ‘l2’,’l3’ Default: ‘l2’suffix (
str) – The tplot variable names will be given this suffix. By default, no suffix is added.get_support_data (
bool) – If Trye, data with an attribute “VAR_TYPE” with a value of “support_data” will be loaded into tplot. Default: Falsevarformat (
str) – The file variable formats to load into tplot. Wildcard character “*” is accepted. Default: None (all variables loaded)varnames (
listofstr) – List of variable names to load. If list is empty or not specified, all data variables are loaded. Default: [] (all data loaded)downloadonly (
bool) – Set this flag to download the CDF files, but not load them into tplot variables. Default: Falsenotplot (
bool) – Return the data in hash tables instead of creating tplot variables Default: Falseno_update (
bool) – If set, only load data from your local cache Default: Falsetime_clip (
bool) – Time clip the variables to exactly the range specified in the trange keyword Default: Falseror (
bool) – If set, print PI info and rules of the road Default: Falseversion (
str) – Set this value to specify the version of cdf files (such as “v03_00”) Default: Noneuname (
str) – User name. Default: Nonepasswd (
str) – Password. Default: Noneforce_download (
bool) – Download file even if local version is more recent than server version Default: False
- Return type:
Listoftplot variables created.
Examples
>>> import pyspedas
>>> from pyspedas import tplot
>>> lepi_vars = pyspedas.projects.erg.lepi(trange=['2017-04-09', '2017-04-10'])
>>> tplot('erg_lepi_l2_omniflux_FODO')
Example
import pyspedas
from pyspedas import tplot

lepi_vars = pyspedas.projects.erg.lepi(trange=['2017-04-09', '2017-04-10'])
tplot('erg_lepi_l2_omniflux_FODO')
Medium-energy Particles - electrons (MEP-e)
- pyspedas.projects.erg.mepe(trange: List[str] = ['2017-03-27', '2017-03-28'], datatype: str = 'omniflux', level: str = 'l2', suffix: str = '', get_support_data: bool = False, varformat: str | None = None, varnames: List[str] = [], downloadonly: bool = False, notplot: bool = False, no_update: bool = False, uname: str | None = None, passwd: str | None = None, time_clip: bool = False, ror: bool = True, force_download: bool = False) List[str][source]
This function loads data from the MEP-e experiment from the Arase mission
- Parameters:
trange (
listofstr) – time range of interest [starttime, endtime] with the format ‘YYYY-MM-DD’,’YYYY-MM-DD’] or to specify more or less than a day [‘YYYY-MM-DD/hh:mm:ss’,’YYYY-MM-DD/hh:mm:ss’] Dafault: [‘2017-03-27’, ‘2017-03-28’] ‘datatype (
str) – Data type; Valid ‘l2’ options: ‘3dflux’, ‘omniflux’ Valid ‘l3’ options: ‘3dflux’, ‘pa’ Default: ‘omniflux’level (
str) – Data level; Valid options: ‘l2’, ‘l3’ Default: ‘l2’suffix (
str) – The tplot variable names will be given this suffix. Default: Noneget_support_data (
bool) – If True, data with an attribute “VAR_TYPE” with a value of “support_data” will be loaded into tplot. Default: Falsevarformat (
str) – The file variable formats to load into tplot. Wildcard character “*” is accepted. Default: None (all variables loaded)varnames (
listofstr) – List of variable names to load. If list is empty or not specified, all data variables are loaded. Default: [] (all variables loaded)downloadonly (
bool) – Set this flag to download the CDF files, but not load them into tplot variables. Default: Falsenotplot (
bool) – Return the data in hash tables instead of creating tplot variables. Default: Falseno_update (
bool) – If set, only load data from your local cache Default: Falsetime_clip (
bool) – Time clip the variables to exactly the range specified in the trange keyword. Default: Falseror (
bool) – If set, print PI info and rules of the road. Default: Trueuname (
str) – User name. Default: Nonepasswd (
str) – Password. Default: Noneforce_download (
bool) – Download file even if local version is more recent than server version Default: False
- Return type:
Listoftplot variables created.
Examples
>>> import pyspedas
>>> from pyspedas import tplot
>>> mepe_vars = pyspedas.projects.erg.mepe(trange=['2017-03-27', '2017-03-28'])
>>> tplot('erg_mepe_l2_omniflux_FEDO')
import pyspedas
from pyspedas import tplot
pyspedas.projects.erg.mepe(trange=['2017-03-27', '2017-03-28'])
tplot('erg_mepe_l2_omniflux_FEDO')
Medium-energy Particles – “normal mode” ion (MEP-i)
- pyspedas.projects.erg.mepi_nml(trange: List[str] = ['2017-03-27', '2017-03-28'], datatype: str = 'omniflux', level: str = 'l2', suffix: str = '', get_support_data: bool = False, varformat: str | None = None, varnames: List[str] = [], downloadonly: bool = False, notplot: bool = False, no_update: bool = False, uname: str | None = None, passwd: str | None = None, time_clip: bool = False, ror: bool = True, force_download: bool = False) List[str][source]
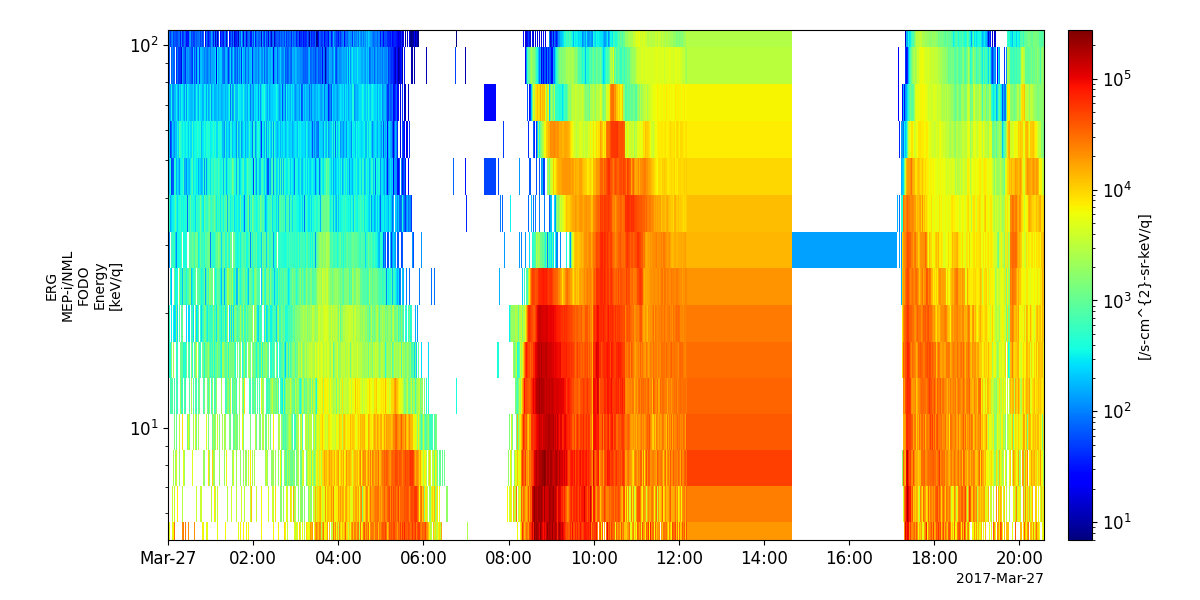
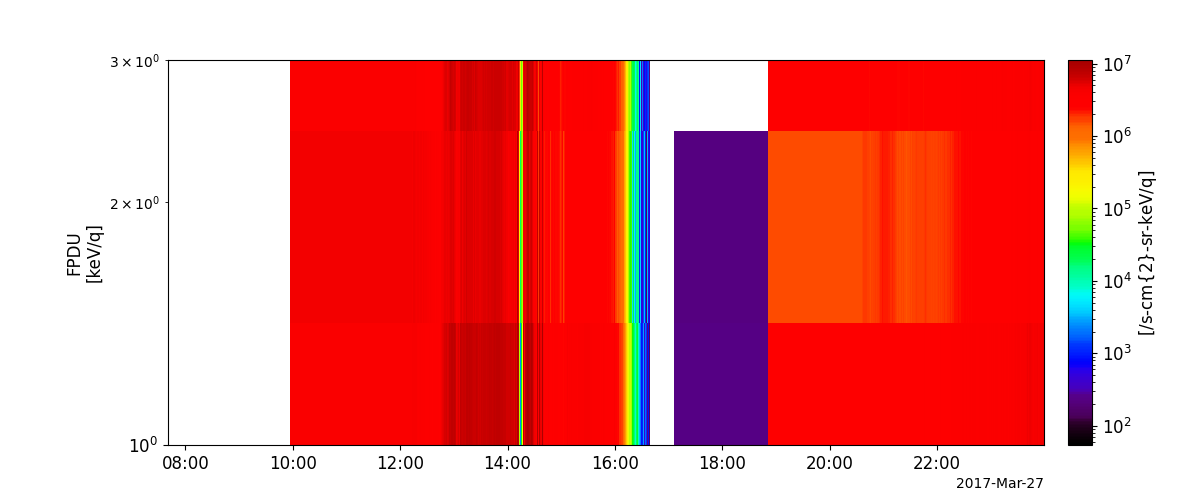
This function loads data from the MEP-i experiment from the Arase mission
- Parameters:
trange (
listofstr) – time range of interest [starttime, endtime] with the format ‘YYYY-MM-DD’,’YYYY-MM-DD’] or to specify more or less than a day [‘YYYY-MM-DD/hh:mm:ss’,’YYYY-MM-DD/hh:mm:ss’] Default: [‘2017-03-27’,’2017-03-28’]datatype (
str) – Data type; Valid ‘l2’ options: ‘omniflux’, ‘3dflux’, ‘tof’ Valid ‘l3’ options: ‘3dflux’, ‘pa’ Default: ‘omniflux’level (
str) – Data level; Valid options: ‘l2’, ‘l3’suffix (
str) – The tplot variable names will be given this suffix. Default: Noneget_support_data (
bool) – If True, data with an attribute “VAR_TYPE” with a value of “support_data” will be loaded into tplot. Default: Falsevarformat (
str) – The file variable formats to load into tplot. Wildcard character “*” is accepted. Default: None (all variables loaded)varnames (
listofstr) – List of variable names to load. If list is empty or not specified, all data variables are loaded. Default: [] (all variables loaded)downloadonly (
bool) – Set this flag to download the CDF files, but not load them into tplot variables. Default: Falsenotplot (
bool) – Return the data in hash tables instead of creating tplot variables Default: Falseno_update (
bool) – If set, only load data from your local cache Default: Falsetime_clip (
bool) – Time clip the variables to exactly the range specified in the trange keyword Default: Falseror (
bool) – If set, print PI info and rules of the road Default: Trueuname (
str) – User name. Default: Nonepasswd (
str) – Password. Default: Noneforce_download (
bool) – Download file even if local version is more recent than server version Default: False
- Return type:
Listoftplot variables created.
Examples
>>> import pyspedas
>>> from pyspedas import tplot
>>> mepi_nml_vars = pyspedas.projects.erg.mepi_nml(trange=['2017-03-27', '2017-03-28'])
>>> tplot('erg_mepi_l2_omniflux_FPDO')
import pyspedas
from pyspedas import tplot
pyspedas.projects.erg.mepi_nml(trange=['2017-03-27', '2017-03-28'])
tplot('erg_mepi_l2_omniflux_FODO')
Medium-energy Particles - “time of flight mode” ion (MEP-i)
- pyspedas.projects.erg.mepi_tof(trange: List[str] = ['2017-03-27', '2017-03-28'], datatype: str = 'flux', level: str = 'l2', suffix: str = '', get_support_data: bool = False, varformat: str | None = None, varnames: List[str] = [], downloadonly: bool = False, notplot: bool = False, no_update: bool = False, uname: str | None = None, passwd: str | None = None, time_clip: bool = False, ror: bool = True, force_download: bool = False) List[str][source]
This function loads data from the MEP-i experiment from the Arase mission
- Parameters:
trange (
listofstr) – time range of interest [starttime, endtime] with the format ‘YYYY-MM-DD’,’YYYY-MM-DD’] or to specify more or less than a day [‘YYYY-MM-DD/hh:mm:ss’,’YYYY-MM-DD/hh:mm:ss’] Default: [‘2017-03-27’, ‘2017-03-28’]datatype (
str) – Data type; Valid options: ‘flux’ Default: ‘flux’level (
str) – Data level; Valid options: ‘l2’ Defauls: ‘l2’suffix (
str) – The tplot variable names will be given this suffix. Default: Noneget_support_data (
bool) – If True, data with an attribute “VAR_TYPE” with a value of “support_data” will be loaded into tplot. Default: Falsevarformat (
str) – The file variable formats to load into tplot. Wildcard character “*” is accepted. By default, all variables are loaded in. Default: None (all variables loaded)varnames (
listofstr) – List of variable names to load. If list is empty or not specified, all data variables are loaded. Default: [] (all variables loaded)downloadonly (
bool) – Set this flag to download the CDF files, but not load them into tplot variables. Default: Falsenotplot (
bool) – Return the data in hash tables instead of creating tplot variables Default: Falseno_update (
bool) – If set, only load data from your local cache. Default: Falsetime_clip (
bool) – Time clip the variables to exactly the range specified in the trange keyword. Default: Falseror (
bool) – If set, print PI info and rules of the road. Default: Trueuname (
str) – User name. Default: Nonepasswd (
str) – Password. Default: Noneforce_download (
bool) – Download file even if local version is more recent than server version Default: False
- Return type:
Listoftplot variables created.
Examples
>>> import pyspedas
>>> from pyspedas import tplot
>>> mepi_tof_vars = pyspedas.projects.erg.mepi_tof(trange=['2017-03-27', '2017-03-28'])
import pyspedas
from pyspedas import tplot
pyspedas.projects.erg.mepi_tof(trange=['2017-03-27', '2017-03-28'])
tplot('erg_mepi_l2_omniflux_FODO')
Magnetic Field Experiment (MGF)
- pyspedas.projects.erg.mgf(trange: List[str] = ['2017-03-27', '2017-03-28'], datatype: str = '8sec', level: str = 'l2', suffix: str = '', get_support_data: bool = False, varformat: str | None = None, varnames: List[str] = [], downloadonly: bool = False, notplot: bool = False, no_update: bool = False, uname: str | None = None, passwd: str | None = None, time_clip: bool = False, ror: bool = True, coord: str = 'dsi', version: str | None = None, force_download: bool = False) List[str][source]
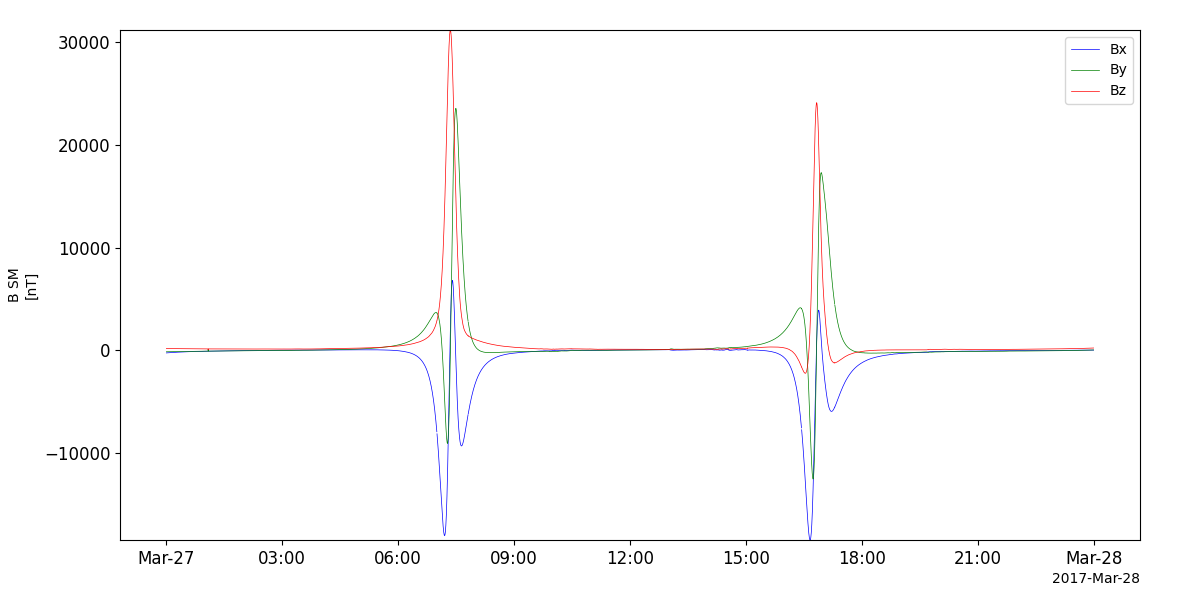
This function loads data from the MGF experiment from the Arase mission
- Parameters:
trange (
listofstr) – time range of interest [starttime, endtime] with the format ‘YYYY-MM-DD’,’YYYY-MM-DD’] or to specify more or less than a day [‘YYYY-MM-DD/hh:mm:ss’,’YYYY-MM-DD/hh:mm:ss’] Default: [‘2017-03-27’, ‘2017-03-28’]datatype (
str) – Data type; Valid options: ‘128hz’, ‘256hz’, ‘64hz’, ‘8sec’level (
str) – Data level; Valid options: ‘l2’ Default: ‘l2’suffix (
str) – The tplot variable names will be given this suffix. Default: Noneget_support_data (
bool) – If true, data with an attribute “VAR_TYPE” with a value of “support_data” will be loaded into tplot. Default: Falsevarformat (
str) – The file variable formats to load into tplot. Wildcard character “*” is accepted. Default: None (all variables loaded)downloadonly (
bool) – Set this flag to download the CDF files, but not load them into tplot variables. Default: Falsenotplot (
bool) – Return the data in hash tables instead of creating tplot variables Default: Falseno_update (
bool) – If set, only load data from your local cache Default: Falsetime_clip (
bool) – Time clip the variables to exactly the range specified in the trange keyword Default: Falseror (
bool) – If set, print PI info and rules of the road Default: Truecoord (
str) – Valid values: “sm”, “dsi”, “gse”, “gsm”, “sgi” Default: ‘dsi’version (
str) – Set this value to specify the version of cdf files (such as “v03.03”, “v03.04”, …)uname (
str) – User name. Default: Nonepasswd (
str) – Password. Default: Noneforce_download (
bool) – Download file even if local version is more recent than server version Default: False
- Return type:
Listoftplot variables created.
Examples
>>> import pyspedas
>>> from pyspedas import tplot
>>> mgf_vars = pyspedas.projects.erg.mgf(trange=['2017-03-27', '2017-03-28'])
>>> tplot('erg_mgf_l2_mag_8sec_sm')
Example
import pyspedas
from pyspedas import tplot
pyspedas.projects.erg.mgf(trange=['2017-03-27', '2017-03-28'])
tplot('erg_mgf_l2_mag_8sec_sm')
Orbit data
- pyspedas.projects.erg.orb(trange: List[str] = ['2017-03-27', '2017-03-28'], datatype: str = 'def', level: str = 'l2', model: str = 'op', suffix: str = '', get_support_data: bool = False, varformat: str | None = None, varnames: List[str] = [], downloadonly: bool = False, notplot: bool = False, no_update: bool = False, uname: str | None = None, passwd: str | None = None, time_clip: bool = False, version: str | None = None, ror: bool = True, force_download: bool = False) List[str][source]
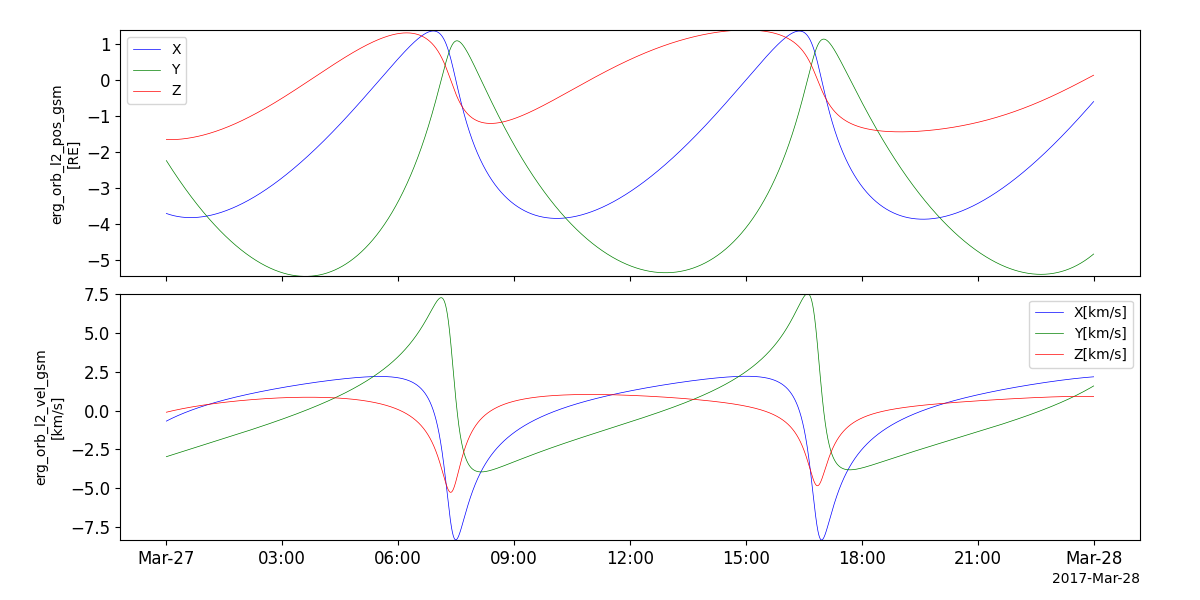
This function loads orbit data from the Arase mission
- Parameters:
trange (
listofstr) – time range of interest [starttime, endtime] with the format ‘YYYY-MM-DD’,’YYYY-MM-DD’] or to specify more or less than a day [‘YYYY-MM-DD/hh:mm:ss’,’YYYY-MM-DD/hh:mm:ss’] Default: [‘2017-03-27’, ‘2017-03-28’]datatype (
str) – Data type; Valid ‘l2’ options: “pre”, “spre”, “mpre”, “lpre”, “def” Default: ‘def’level (
str) – Data level; Valid options: ‘l2’, ‘l3’ Default: ‘l2’model (
str) – Field model to use for ‘l3’ data. Valid options: ‘op’, ‘t89’, ‘ts04’ Default: ‘op’suffix (
str) – The tplot variable names will be given this suffix. Default: Noneget_support_data (
bool) – If True, data with an attribute “VAR_TYPE” with a value of “support_data” will be loaded into tplot. Default: Falsevarformat (
str) – The file variable formats to load into tplot. Wildcard character “*” is accepted. By default, all variables are loaded in. Default: None (all variables loaded)varnames (
listofstr) – List of variable names to load. If list is empty or not specified, all data variables are loaded. Default: [] (all variables loaded)downloadonly (
bool) – Set this flag to download the CDF files, but not load them into tplot variables Default: Falsenotplot (
bool) – Return the data in hash tables instead of creating tplot variables Default: Falseno_update (
bool) – If set, only load data from your local cache Default: Falsetime_clip (
bool) – Time clip the variables to exactly the range specified in the trange keyword Default: Falseversion (
str) – Set this value to specify the version of cdf files (such as “v03”) Default: Falseror (
bool) – If true, print PI info and rules of the road. Default: Trueuname (
str) – User name. Default: Nonepassed (
str) – Password. Default: Noneforce_download (
bool) – Download file even if local version is more recent than server version Default: False
- Return type:
Listoftplot variables created.
Examples
>>> import pyspedas
>>> from pyspedas import tplot
>>> orb_vars = pyspedas.projects.erg.orb(trange=['2017-03-27', '2017-03-28'])
>>> tplot('erg_orb_l2_pos_gse')
Example
import pyspedas
from pyspedas import tplot
pyspedas.projects.erg.orb(trange=['2017-03-27', '2017-03-28'])
tplot(['erg_orb_l2_pos_gsm', 'erg_orb_l2_vel_gsm'])
Plasma Wave Experiment - Electric Field Detector (PWE-EFD)
- pyspedas.projects.erg.pwe_efd(trange: List[str] = ['2017-04-01', '2017-04-02'], datatype: str = 'E_spin', level: str = 'l2', suffix: str = '', coord: str = 'dsi', get_support_data: bool = False, varformat: str | None = None, varnames: List[str] = [], downloadonly: bool = False, notplot: bool = False, no_update: bool = False, uname: str | None = None, passwd: str | None = None, time_clip: bool = False, ror: bool = True, force_download: bool = False) List[str][source]
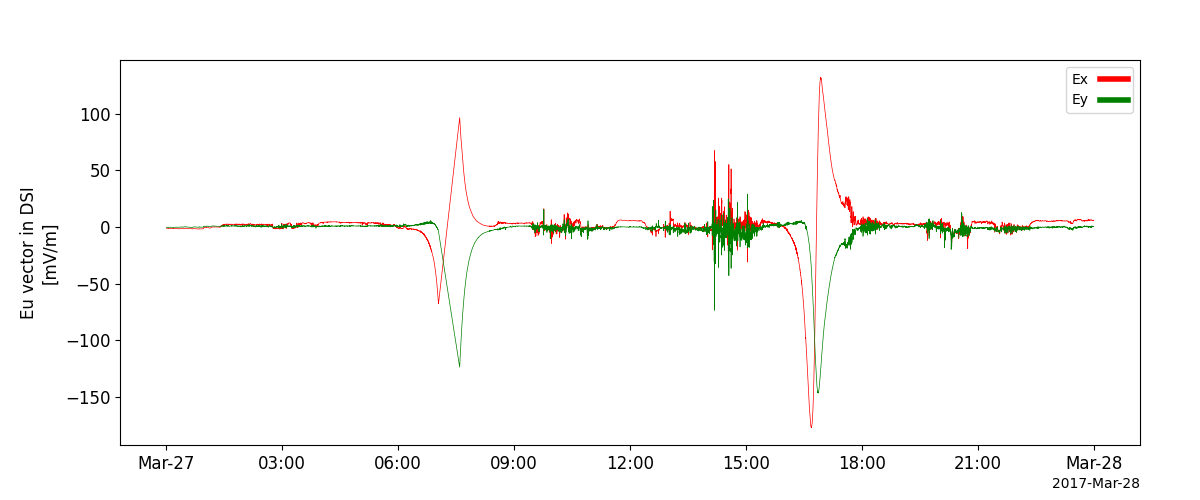
This function loads data from the PWE experiment from the Arase mission
- Parameters:
trange (
listofstr) – time range of interest [starttime, endtime] with the format ‘YYYY-MM-DD’,’YYYY-MM-DD’] or to specify more or less than a day [‘YYYY-MM-DD/hh:mm:ss’,’YYYY-MM-DD/hh:mm:ss’] Default: [‘2017-04-01’, ‘2017-04-02’]datatype (
str) – Data type; Valid options: ‘E256Hz’, ‘E64Hz’, ‘E_spin’, ‘pot’, ‘pot8Hz’, ‘spec’ Default: ‘E_spin’level (
str) – Data level; Valid options: ‘l2’ Default: ‘l2’coord (
str) – Coordinate system to use. Valid options: ‘dsi’, ‘wpt’ Default: ‘dsi’suffix (
str) – The tplot variable names will be given this suffix. Default: Noneget_support_data (
bool) – If True, data with an attribute “VAR_TYPE” with a value of “support_data” will be loaded into tplot. Default: Falsevarformat (
str) – The file variable formats to load into tplot. Wildcard character “*” is accepted. Default: None (all variables loaded)varnames (
listofstr) – List of variable names to load. If list is empty or not specified, all data variables are loaded. Default: [] (all variables loaded)downloadonly (
bool) – Set this flag to download the CDF files, but not load them into tplot variables. Default: Falsenotplot (
bool) – Return the data in hash tables instead of creating tplot variables Default: Falseno_update (
bool) – If set, only load data from your local cache Default: FAlsetime_clip (
bool) – Time clip the variables to exactly the range specified in the trange keyword Default: Falseror (
bool) – If set, print PI info and rules of the roaduname (
str) – User name. Default: Nonepasswd (
str) – Password. Default: Noneforce_download (
bool) – Download file even if local version is more recent than server version Default: False
- Return type:
Listoftplot variables created.
Examples
>>> import pyspedas
>>> from pyspedas import tplot
>>> pwe_efd_vars = pyspedas.projects.erg.pwe_efd(trange=['2017-03-27', '2017-03-28'])
>>> tplot('erg_pwe_efd_l2_E_spin_Eu_dsi')
Example
import pyspedas
from pyspedas import tplot

pwe_efd_vars = pyspedas.projects.erg.pwe_efd(trange=['2017-03-27', '2017-03-28'])
tplot('erg_pwe_efd_l2_E_spin_Eu_dsi')
Plasma Wave Experiment - High Frequency Analyzer (PWE-HFA)
- pyspedas.projects.erg.pwe_hfa(trange: List[str] = ['2017-04-01', '2017-04-02'], datatype: str = 'spec', mode: str = 'low', level: str = 'l2', suffix: str = '', get_support_data: bool = False, varformat: str | None = None, varnames: List[str] = [], downloadonly: bool = False, notplot: bool = False, no_update: bool = False, uname: str | None = None, passwd: str | None = None, time_clip: bool = False, ror: bool = True, force_download: bool = False) List[str][source]
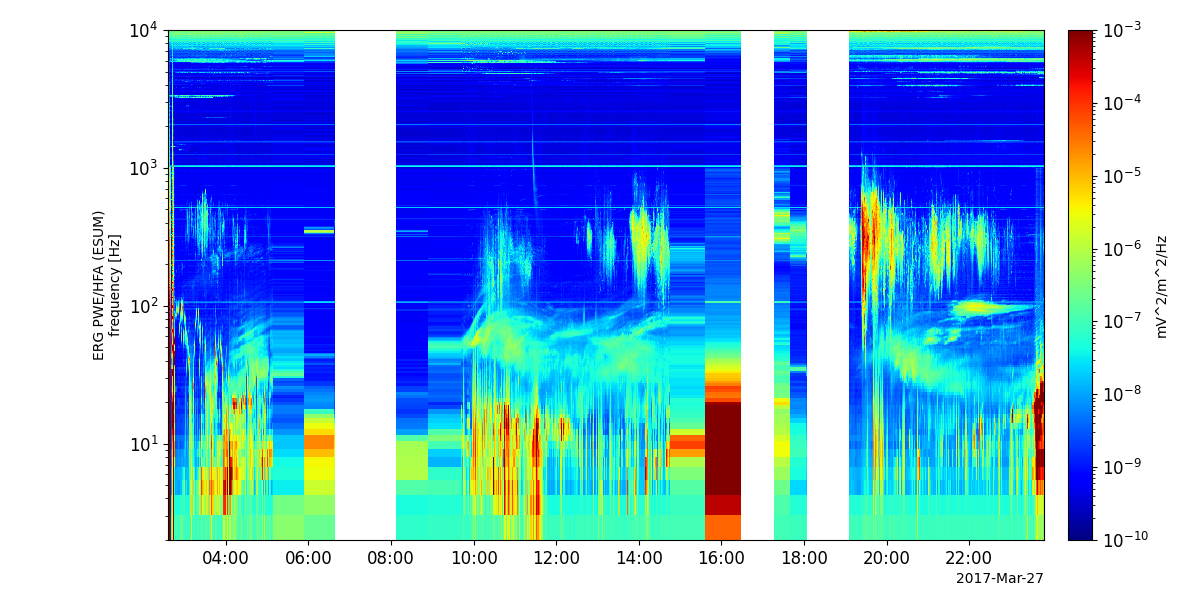
This function loads data from the PWE experiment from the Arase mission
- Parameters:
trange (
listofstr) – time range of interest [starttime, endtime] with the format ‘YYYY-MM-DD’,’YYYY-MM-DD’] or to specify more or less than a day [‘YYYY-MM-DD/hh:mm:ss’,’YYYY-MM-DD/hh:mm:ss’] Default: [‘2017-04-01’, ‘2017-04-02’]datatype (
str) – Data type; Valid ‘l2’ options: ‘spec’ Default: ‘spec’level (
str) – Data level; Valid options: ‘l2’, ‘l3’ Default: ‘l2’mode (
str) – Mode of ‘l2’ data to load. Valid options: ‘’high’, ‘low’, ‘monit’ Default: ‘low’suffix (
str) – The tplot variable names will be given this suffix. Default: Noneget_support_data (
bool) – If True, data with an attribute “VAR_TYPE” with a value of “support_data” will be loaded into tplot. Default: Falsevarformat (
str) – The file variable formats to load into tplot. Wildcard character “*” is accepted. Default: None (all variables loaded)varnames (
listofstr) – List of variable names to load. If list is empty or not specified, all data variables are loaded. Default: None (all variables loaded)downloadonly (
bool) – Set this flag to download the CDF files, but not load them into tplot variables. Default: Falsenotplot (
bool) – Return the data in hash tables instead of creating tplot variables Default: Falseno_update (
bool) – If set, only load data from your local cache Default: Falsetime_clip (
bool) – Time clip the variables to exactly the range specified in the trange keyword Default: Falseror (
bool) – If set, print PI info and rules of the road Default: Trueuname (
str) – User name. Default: Nonepasswd (
str) – Password. Default: None
- Return type:
Listoftplot variables created.
Examples
>>> import pyspedas
>>> from pyspedas import tplot
>>> pwe_hfa_vars = pyspedas.projects.erg.pwe_hfa(trange=['2017-03-27', '2017-03-28'])
>>> tplot('erg_pwe_hfa_l2_low_spectra_eu')
Example
import pyspedas
from pyspedas import tplot
pyspedas.projects.erg.pwe_hfa(trange=['2017-03-27', '2017-03-28'])
tplot('erg_pwe_hfa_l2_low_spectra_esum')
Plasma Wave Experiment - Onboard Frequency Analyzer (PWE-OFA)
- pyspedas.projects.erg.pwe_ofa(trange: List[str] = ['2017-04-01', '2017-04-02'], datatype: str = 'spec', level: str = 'l2', suffix: str = '', get_support_data: bool = False, varformat: str | None = None, varnames: List[str] = [], downloadonly: bool = False, notplot: bool = False, no_update: bool = False, uname: str | None = None, passwd: str | None = None, time_clip: bool = False, ror: bool = True, force_download: bool = False) List[str][source]
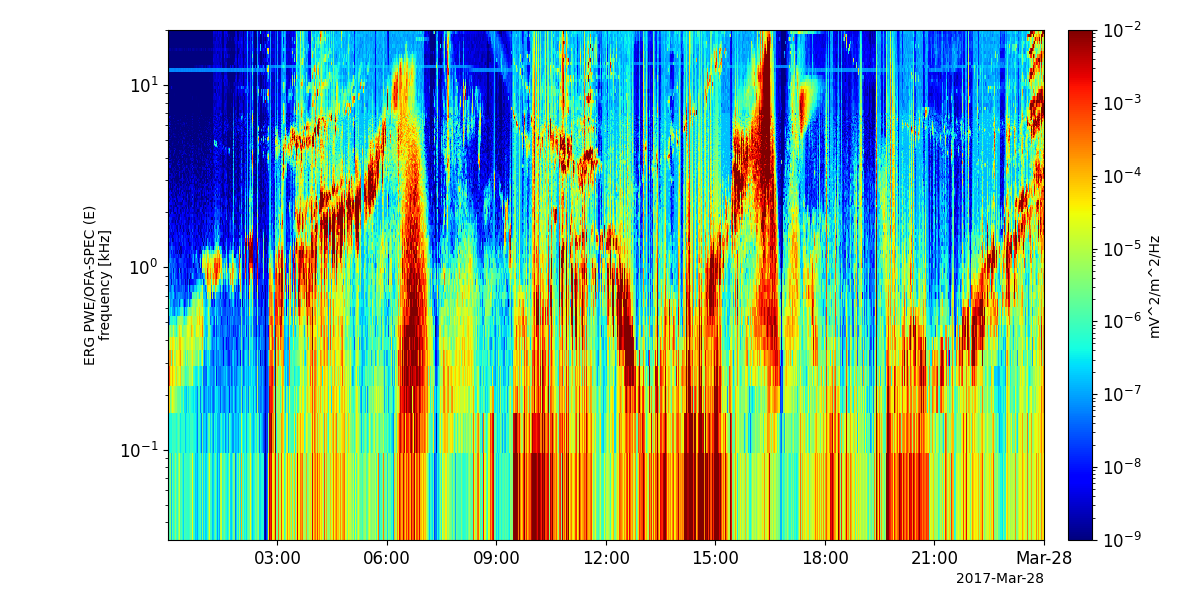
This function loads data from the PWE experiment from the Arase mission
- Parameters:
trange (
listofstr) – time range of interest [starttime, endtime] with the format ‘YYYY-MM-DD’,’YYYY-MM-DD’] or to specify more or less than a day [‘YYYY-MM-DD/hh:mm:ss’,’YYYY-MM-DD/hh:mm:ss’] Default: [‘2017-04-01’, ‘2017-04-02’]datatype (
str) – Data type; Valid ‘l2’ options: ‘complex’, ‘matrix’, ‘spec’. Valid ‘l3’ options: ‘property’ Default: ‘spec’level (
str) – Data level; Valid options: ‘l2’, ‘l3’ Default: ‘l2’suffix (
str) – The tplot variable names will be given this suffix. Default: Noneget_support_data (
bool) – If True, data with an attribute “VAR_TYPE” with a value of “support_data” will be loaded into tplot. Default: Falsevarformat (
str) – The file variable formats to load into tplot. Wildcard character “*” is accepted. Default: None (all variables loaded)varnames (
listofstr) – List of variable names to load. If list is empty or not specified, all data variables are loaded. Default: [] (all variables loaded)downloadonly (
bool) – Set this flag to download the CDF files, but not load them into tplot variables Default: Truenotplot (
bool) – Return the data in hash tables instead of creating tplot variables Default: Falseno_update (
bool) – If set, only load data from your local cache Default: Falsetime_clip (
bool) – Time clip the variables to exactly the range specified in the trange keyword Default: Falseror (
bool) – If set, print PI info and rules of the road Default: Trueuname (
str) – User name. Default: Nonepasswd (
str) – Password. Default: Noneforce_download (
bool) – Download file even if local version is more recent than server version Default: False
- Return type:
Listoftplot variables created.
Examples
>>> import pyspedas
>>> from pyspedas import tplot
>>> pwe_ofa_vars = pyspedas.projects.erg.pwe_ofa(trange=['2017-03-27', '2017-03-28'])
>>> tplot('erg_pwe_ofa_l2_spec_E_spectra_132')
Example
import pyspedas
from pyspedas import tplot
pyspedas.projects.erg.pwe_ofa(trange=['2017-03-27', '2017-03-28'])
tplot('erg_pwe_ofa_l2_spec_E_spectra_132')
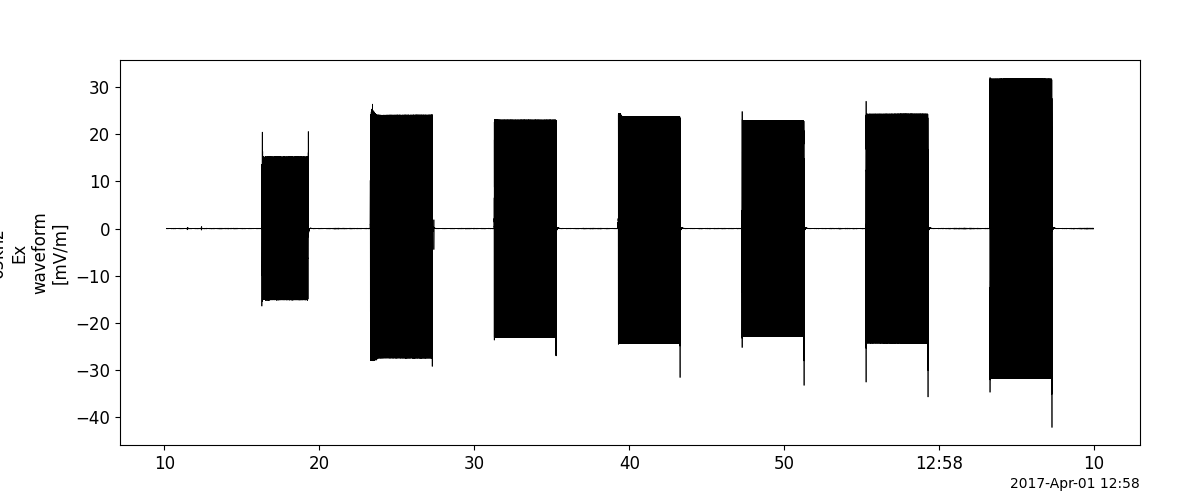
Plasma Wave Experiment - Waveform Capture (PWE-WFC)
- pyspedas.projects.erg.pwe_wfc(trange: List[str] = ['2017-04-01/12:00:00', '2017-04-01/13:00:00'], datatype: str = 'waveform', mode: str = '65khz', level: str = 'l2', suffix: str = '', coord: str = 'sgi', component: str = 'all', get_support_data: bool = False, varformat: str | None = None, varnames: List[str] = [], downloadonly: bool = False, notplot: bool = False, no_update: bool = False, uname: str | None = None, passwd: str | None = None, time_clip: bool = False, ror: bool = True, force_download: bool = False) List[str][source]
This function loads data from the PWE experiment from the Arase mission
- Parameters:
trange (
listofstr) – time range of interest [starttime, endtime] with the format ‘YYYY-MM-DD’,’YYYY-MM-DD’] or to specify more or less than a day [‘YYYY-MM-DD/hh:mm:ss’,’YYYY-MM-DD/hh:mm:ss’] Default: [‘2017-04-01/12:00:00’,’2017-04-01/13:00:00’]datatype (
str) – Data type; Valid ‘l2’ options: ‘waveform’, ‘spec’ Default: ‘waveform’level (
str) – Data level; Valid options: ‘l2’ Default: ‘l2’coord (
str) – Coordinate system to load. Valid options: ‘dsi’, ‘sgi’ Default: ‘sgi’mode (
str) – Mode of data to load. Valid options: ‘65khz’, ‘wp65khz’ Default: ‘65khz’component (
str) – Data components to load. Valid options: ‘all’, ‘e’, ‘b’ Default: ‘all’suffix (
str) – The tplot variable names will be given this suffix. Default: Noneget_support_data (
bool) – If Trye, data with an attribute “VAR_TYPE” with a value of “support_data” will be loaded into tplot. Default: Falsevarformat (
str) – The file variable formats to load into tplot. Wildcard character “*” is accepted. Default: None (all variables loaded)varnames (
listofstr) – List of variable names to load. If list is empty or not specified, all data variables are loaded. Default: [] (all variables loaded)downloadonly (
bool) – Set this flag to download the CDF files, but not load them into tplot variables. Default: Falsenotplot (
bool) – Return the data in hash tables instead of creating tplot variables Default: Falseno_update (
bool) – If set, only load data from your local cache Default: Falsetime_clip (
bool) – Time clip the variables to exactly the range specified in the trange keyword Default: Falseror (
bool) – If set, print PI info and rules of the road Default: Trueuname (
str) – User name. Default: Nonepasswd (
str) – Password. Default: Noneforce_download (
bool) – Download file even if local version is more recent than server version Default: False
- Return type:
Listoftplot variables created.
Examples
>>> import pyspedas
>>> from pyspedas import tplot
>>> pwe_wfc_vars = pyspedas.projects.erg.pwe_wfc(trange=['2017-04-01/12:00:00', '2017-04-01/13:00:00'])
>>> tplot('erg_pwe_wfc_l2_e_65khz_Ex_waveform')
Example
import pyspedas
from pyspedas import tplot

pwe_wfc_vars = pyspedas.projects.erg.pwe_wfc(trange=['2017-04-01/12:00:00', '2017-04-01/13:00:00'])
tplot('erg_pwe_wfc_l2_e_65khz_Ex_waveform')
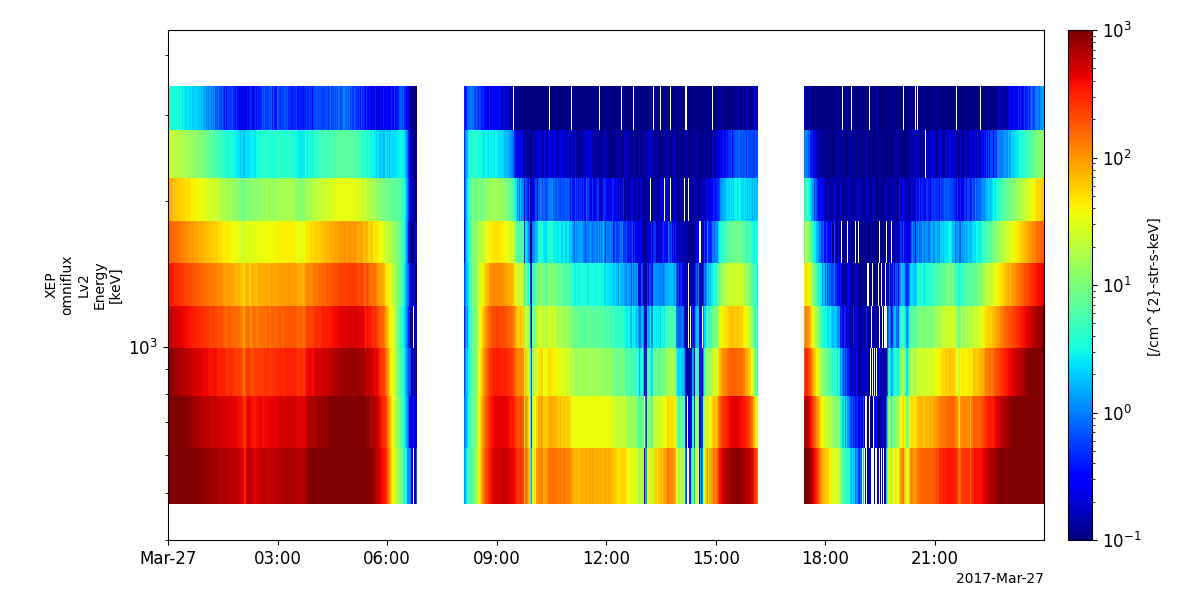
Extremely High-energy electrons (XEP-e)
- pyspedas.projects.erg.xep(trange: List[str] = ['2017-06-01', '2017-06-02'], datatype: str = 'omniflux', level: str = 'l2', suffix: str = '', get_support_data: bool = False, varformat: str | None = None, varnames: List[str] = [], downloadonly: bool = False, notplot: bool = False, no_update: bool = False, uname: str | None = None, passwd: str | None = None, time_clip: bool = False, ror: bool = True, force_download: bool = False) List[str][source]
This function loads data from the XEP-e experiment from the Arase mission
- Parameters:
trange (
listofstr) – time range of interest [starttime, endtime] with the format ‘YYYY-MM-DD’,’YYYY-MM-DD’] or to specify more or less than a day [‘YYYY-MM-DD/hh:mm:ss’,’YYYY-MM-DD/hh:mm:ss’] Default: [‘2017-06-01’, ‘2017-06-02’]datatype (
str) – Data type; Valid options: ‘omniflux’, ‘2dflux’ Default: ‘omniflux’level (
str) – Data level; Valid options: ‘l2’ Default: ‘l2’suffix (
str) – The tplot variable names will be given this suffix. Default: Noneget_support_data (
bool) – If True, data with an attribute “VAR_TYPE” with a value of “support_data” will be loaded into tplot. Default: Falsevarformat (
str) – The file variable formats to load into tplot. Wildcard character “*” is accepted. Default: None (all variables loaded)varnames (
listofstr) – List of variable names to load. If list is empty or not specified, all data variables are loaded. Default: [] (all variables loaded)downloadonly (
bool) – Set this flag to download the CDF files, but not load them into tplot variables. Default: Falsenotplot (
bool) – Return the data in hash tables instead of creating tplot variables Default: Falseno_update (
bool) – If set, only load data from your local cache Default: Falsetime_clip (
bool) – Time clip the variables to exactly the range specified in the trange keyword Default: Falseror (
bool) – If set, print PI info and rules of the road Default: Trueuname (
str) – User name. Default: Nonepasswd (
str) – Password. Default: Noneforce_download (
bool) – Download file even if local version is more recent than server version Default: False
- Return type:
Listoftplot variables created.
Examples
>>> import pyspedas
>>> from pyspedas import tplot
>>> xep_vars = pyspedas.projects.erg.xep(trange=['2017-03-27', '2017-03-28'])
>>> tplot('erg_xep_l2_FEDO_SSD')
import pyspedas
from pyspedas import tplot
pyspedas.projects.erg.xep(trange=['2017-03-27', '2017-03-28'])
tplot('erg_xep_l2_FEDO_SSD')
OMTI ASI cameras
- pyspedas.projects.erg.camera_omti_asi(trange: List[str] = ['2020-08-01', '2020-08-02'], suffix: str = '', site: str | List[str] = 'all', wavelength: int | List[int] | str | List[str] = [5577], get_support_data: bool = False, varformat: str | None = None, varnames: List[str] = [], downloadonly: bool = False, notplot: bool = False, no_update: bool = False, uname: str | None = None, passwd: str | None = None, time_clip: bool = False, ror: bool = True, force_download: bool = False) List[str][source]
Load data from OMTI all sky imagers
- Parameters:
trange (
listofstr) – time range of interest [starttime, endtime] with the format ‘YYYY-MM-DD’,’YYYY-MM-DD’] or to specify more or less than a day [‘YYYY-MM-DD/hh:mm:ss’,’YYYY-MM-DD/hh:mm:ss’] Default: [‘2020-08-01’, ‘2020-08-02’]suffix (
str) – The tplot variable names will be given this suffix. Default: ‘’site (
strorlistofstr) – The site or list of sites to load. Valid values: ‘abu’, ‘ath’, ‘drw’, ‘eur’, ‘gak’, ‘hlk’, ‘hus’, ‘isg’, ‘ist’, ‘ith’, ‘kap’, ‘ktb’,’mgd’, ‘nai’, ‘nyr’, ‘ptk’, ‘rik’, ‘rsb’, ‘sgk’, ‘sta’, ‘syo’, ‘trs’, ‘yng’, ‘all’ Default: ‘all’wavelength (
str,int,listofstr, orlistofint) – Valid values: [5577, 5725, 6300, 7200, 7774] Default: [5577]get_support_data (
bool) – If true, data with an attribute “VAR_TYPE” with a value of “support_data” or ‘data’ will be loaded into tplot. Default: Falsevarformat (
str) – The CDF file variable formats to load into tplot. Wildcard character “*” is accepted. Default: None (all variables will be loaded).varnames (
listofstr) – List of variable names to load. Default: [] (all variables will be loaded)downloadonly (
bool) – Set this flag to download the CDF files, but not load them into tplot variables. Default: Falsenotplot (
bool) – Return the data in hash tables instead of creating tplot variables. Default: Falseno_update (
bool) – If set, only load data from your local cache. Default: Falseuname (
str) – User name. Default: Nonepasswd (
str) – Password. Default: Nonetime_clip (
bool) – Time clip the variables to exactly the range specified in the trange keyword. Default: Falseror (
bool) – If set, print PI info and rules of the road. Default: Trueforce_download (
bool) – Download file even if local version is more recent than server version Default: False
- Return type:
Examples
>>> import pyspedas
>>> omti_vars=pyspedas.projects.erg.camera_omti_asi(site='ath', trange=['2020-01-20','2020-01-21'])
>>> print(omti_vars)
import pyspedas
omti_vars=pyspedas.projects.erg.camera_omti_asi(site='ath', trange=['2020-01-20','2020-01-21'])
print(omti_vars)
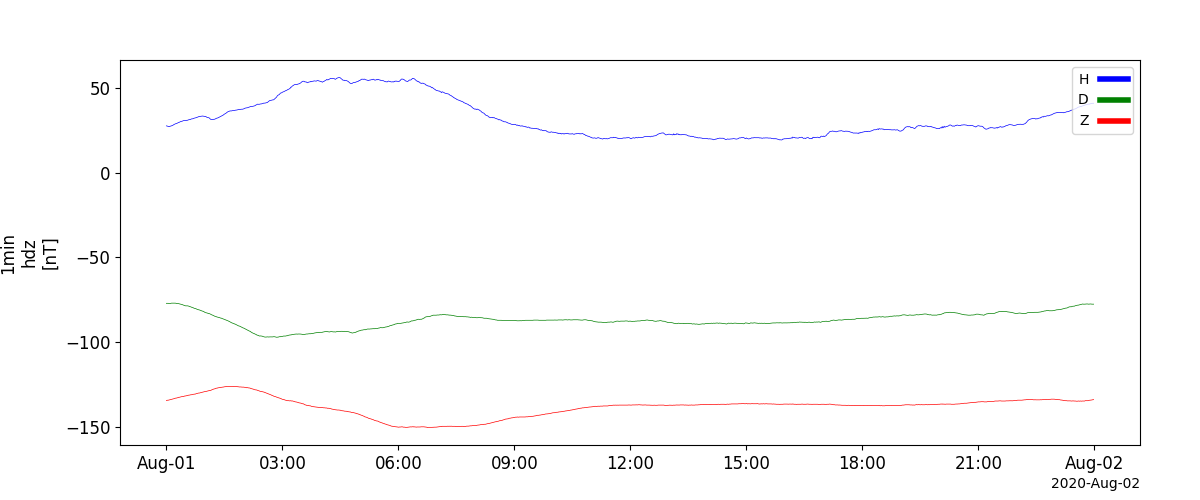
ISEE Fluxgate Magnetometers
- pyspedas.projects.erg.gmag_isee_fluxgate(trange: List[str] = ['2020-08-01', '2020-08-02'], suffix: str = '', site: str | List[str] = 'all', datatype: str | List[str] = 'all', get_support_data: bool = False, varformat: str | None = None, varnames: List[str] = [], downloadonly: bool = False, notplot: bool = False, no_update: bool = False, uname: str | None = None, passwd: str | None = None, time_clip: bool = False, ror: bool = True, force_download=False) Dict | None | List[str | Any][source]
Load data from ISEE Fluxgate Magnetometers
- Parameters:
trange (
listofstr) – time range of interest [starttime, endtime] with the format ‘YYYY-MM-DD’,’YYYY-MM-DD’] or to specify more or less than a day [‘YYYY-MM-DD/hh:mm:ss’,’YYYY-MM-DD/hh:mm:ss’] Default: [‘2020-08-01’, ‘2020-08-02’]suffix (
str) – The tplot variable names will be given this suffix. Default: ‘’site (
strorlistofstr) – The site or list of sites to load. Valid values: ‘msr’, ‘rik’, ‘kag’, ‘ktb’, ‘lcl’, ‘mdm’, ‘tew’, ‘all’ Default: [‘all’]datatype (
strorlistofstr) – The data types to load. Valid values: ‘64hz’, ‘1sec’, ‘1min’, ‘1h’, ‘all’ Default: ‘all’get_support_data (
bool) – If true, data with an attribute “VAR_TYPE” with a value of “support_data” or ‘data’ will be loaded into tplot. Default: Falsevarformat (
str) – The CDF file variable formats to load into tplot. Wildcard character “*” is accepted. Default: None (all variables will be loaded).varnames (
listofstr) – List of variable names to load. Default: [] (all variables will be loaded)downloadonly (
bool) – Set this flag to download the CDF files, but not load them into tplot variables. Default: Falsenotplot (
bool) – Return the data in hash tables instead of creating tplot variables. Default: Falseno_update (
bool) – If set, only load data from your local cache. Default: Falseuname (
str) – User name. Default: Nonepasswd (
str) – Password. Default: Nonetime_clip (
bool) – Time clip the variables to exactly the range specified in the trange keyword. Default: Falseror (
bool) – If set, print PI info and rules of the road. Default: Trueforce_download (
bool) – Download file even if local version is more recent than server version Default: False
Examples
>>> import pyspedas
>>> from pyspedas import tplot
>>> fluxgate_vars=pyspedas.projects.erg.gmag_isee_fluxgate(trange=['2020-08-01','2020-08-02'], site='all')
>>> tplot('isee_fluxgate_mag_ktb_1min_hdz')
import pyspedas
from pyspedas import tplot
fluxgate_vars=pyspedas.projects.erg.gmag_isee_fluxgate(trange=['2020-08-01','2020-08-02'], site='all')
tplot('isee_fluxgate_mag_ktb_1min_hdz')
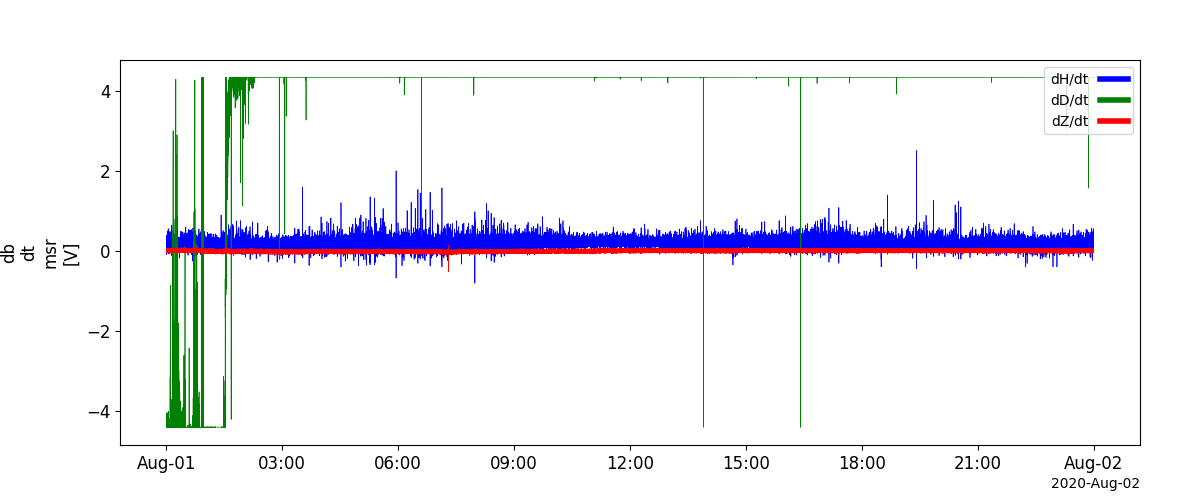
ISEE Induction Magnetometers
- pyspedas.projects.erg.gmag_isee_induction(trange: List[str] = ['2018-10-18/00:00:00', '2018-10-18/02:00:00'], suffix: str = '', site: str | List[str] = 'all', get_support_data: bool = False, varformat: str | None = None, varnames: List[str] = [], downloadonly: bool = False, notplot: bool = False, no_update: bool = False, uname: str | None = None, passwd: str | None = None, time_clip: bool = False, ror: bool = True, frequency_dependent: bool = False, force_download: bool = False) List[str][source]
Load data from ISEE Induction Magnetometers
- Parameters:
trange (
listofstr) – time range of interest [starttime, endtime] with the format ‘YYYY-MM-DD’,’YYYY-MM-DD’] or to specify more or less than a day [‘YYYY-MM-DD/hh:mm:ss’,’YYYY-MM-DD/hh:mm:ss’] Default: [‘2018-10-18/00:00:00’, ‘2018-10-18/02:00:00’]suffix (
str) – The tplot variable names will be given this suffix. Default: ‘’site (
strorlistofstr) – The site or list of sites to load. Valid values: “ath”, “gak”, “hus”, “kap”, “lcl”, “mgd”, “msr”, “nai”, “ptk”, “rik”, “sta”, “zgn”, “all” Default: [‘all’]get_support_data (
bool) – If true, data with an attribute “VAR_TYPE” with a value of “support_data” or ‘data’ will be loaded into tplot. Default: Falsevarformat (
str) – The CDF file variable formats to load into tplot. Wildcard character “*” is accepted. Default: None (all variables will be loaded).varnames (
listofstr) – List of variable names to load. Default: [] (all variables will be loaded)downloadonly (
bool) – Set this flag to download the CDF files, but not load them into tplot variables. Default: Falsenotplot (
bool) – Return the data in hash tables instead of creating tplot variables. Default: Falseno_update (
bool) – If set, only load data from your local cache. Default: Falseuname (
str) – User name. Default: Nonepasswd (
str) – Password. Default: Nonetime_clip (
bool) – Time clip the variables to exactly the range specified in the trange keyword. Default: Falseror (
bool) – If set, print PI info and rules of the road. Default: Truefrequency_dependent (
bool) – If set, load frequency dependent data. Default: Falseforce_download (
bool) – Download file even if local version is more recent than server version Default: False
Examples
>>> import pyspedas
>>> from pyspedas import tplot
>>> ind_vars=pyspedas.projects.erg.gmag_isee_induction(trange=['2020-08-01','2020-08-02'], site='all')
>>> tplot('isee_induction_db_dt_msr')
import pyspedas
from pyspedas import tplot
ind_vars=pyspedas.projects.erg.gmag_isee_induction(trange=['2020-08-01','2020-08-02'], site='all')
tplot('isee_induction_db_dt_msr')
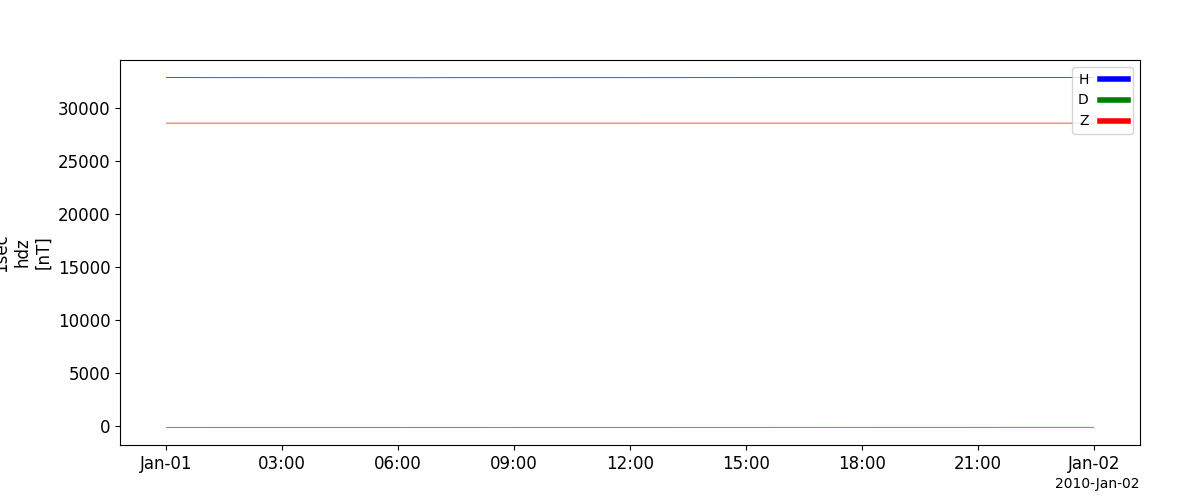
MAGDAS 1sec data
- pyspedas.projects.erg.gmag_magdas_1sec(trange: List[str] = ['2010-11-20/00:00:00', '2010-11-21/00:00:00'], suffix: str = '', site: str | List[str] = 'all', datatype: str | List[str] = '1sec', get_support_data: bool = False, varformat: str | None = None, varnames: List[str] = [], downloadonly: bool = False, notplot: bool = False, no_update: bool = False, uname: str | None = None, passwd: str | None = None, time_clip: bool = False, ror: bool = True, force_download: bool = False) List[str][source]
Load MAGDAS 1sec data from ERG Science Center
- Parameters:
trange (
listofstr) – time range of interest [starttime, endtime] with the format ‘YYYY-MM-DD’,’YYYY-MM-DD’] or to specify more or less than a day [‘YYYY-MM-DD/hh:mm:ss’,’YYYY-MM-DD/hh:mm:ss’] Default: [‘2010-11-20/00:00:00’, ‘2010-11-21/00:00:00’]suffix (
str) – The tplot variable names will be given this suffix. Default: ‘’site (
strorlistofstr) – The site or list of sites to load. Valid values: “ama”, “asb”, “daw”, “her”, “hln”, “hob”, “kuj”, “laq”, “mcq”, “mgd”, “mlb”, “mut”, “onw”, “ptk”, “wad”, “yap”, “all” Default: [‘all’]datatype (
strorlistofstr) – The data types to load. Valid values: ‘1s’, ‘1sec’, ‘all’ Default: ‘1sec’get_support_data (
bool) – If true, data with an attribute “VAR_TYPE” with a value of “support_data” or ‘data’ will be loaded into tplot. Default: Falsevarformat (
str) – The CDF file variable formats to load into tplot. Wildcard character “*” is accepted. Default: None (all variables will be loaded).varnames (
listofstr) – List of variable names to load. Default: [] (all variables will be loaded)downloadonly (
bool) – Set this flag to download the CDF files, but not load them into tplot variables. Default: Falsenotplot (
bool) – Return the data in hash tables instead of creating tplot variables. Default: Falseno_update (
bool) – If set, only load data from your local cache. Default: Falseuname (
str) – User name. Default: Nonepasswd (
str) – Password. Default: Nonetime_clip (
bool) – Time clip the variables to exactly the range specified in the trange keyword. Default: Falseror (
bool) – If set, print PI info and rules of the road. Default: Trueforce_download (
bool) – Download file even if local version is more recent than server version Default: False
Examples
>>> import pyspedas
>>> from pyspedas import tplot
>>> magdas_vars=pyspedas.projects.erg.gmag_magdas_1sec(trange=["2010-01-01", "2010-01-02"],site='ama')
>>> tplot('magdas_mag_ama_1sec_hdz')
import pyspedas
from pyspedas import tplot
magdas_vars=pyspedas.projects.erg.gmag_magdas_1sec(trange=["2010-01-01", "2010-01-02"],site='ama')
tplot('magdas_mag_ama_1sec_hdz')
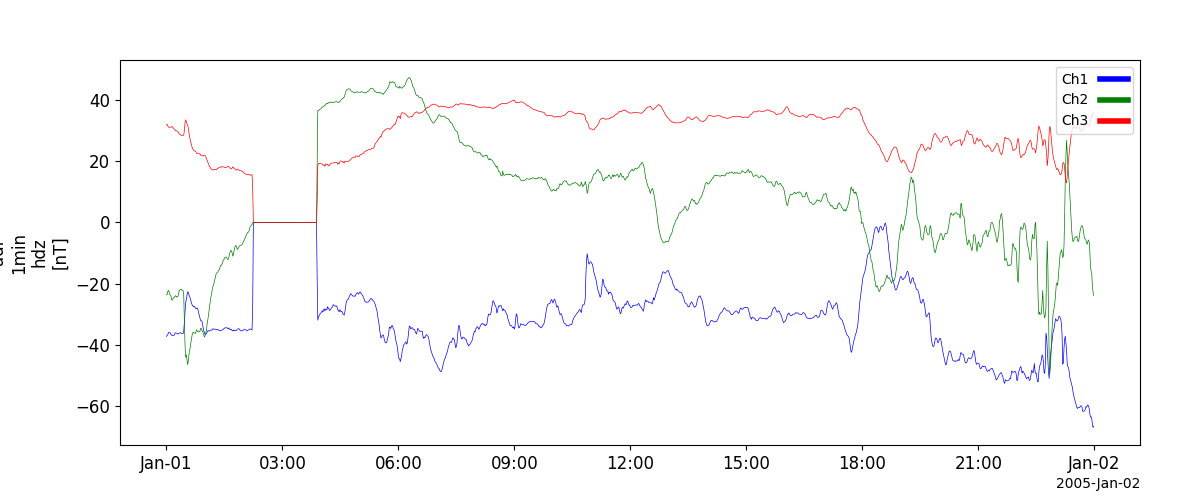
MM210 data
- pyspedas.projects.erg.gmag_mm210(trange: List[str] = ['2020-08-01', '2020-08-02'], suffix: str = '', site: str | List[str] = 'all', datatype: str | List[str] = 'all', get_support_data: bool = False, varformat: str | None = None, varnames: List[str] = [], downloadonly: bool = False, notplot: bool = False, no_update: bool = False, uname: str | None = None, passwd: str | None = None, time_clip: bool = False, ror: bool = True, force_download: bool = False) List[str][source]
Load mm210 data from ERG Science Center
- Parameters:
trange (
listofstr) – time range of interest [starttime, endtime] with the format ‘YYYY-MM-DD’,’YYYY-MM-DD’] or to specify more or less than a day [‘YYYY-MM-DD/hh:mm:ss’,’YYYY-MM-DD/hh:mm:ss’] Default: [‘2020-08-01’, ‘2020-08-02’]suffix (
str) – The tplot variable names will be given this suffix. Default: ‘’site (
strorlistofstr) – The site or list of sites to load. Valid values:‘tik’, ‘zgn’, ‘yak’, ‘irt’, ‘ppi’, ‘bji’, ‘lnp’, ‘mut’, ‘ptn’, ‘wtk’, ‘lmt’, ‘kat’, ‘ktn’, ‘chd’, ‘zyk’, ‘mgd’, ‘ptk’, ‘msr’, ‘rik’, ‘onw’, ‘kag’, ‘ymk’, ‘cbi’, ‘gua’, ‘yap’, ‘kor’, ‘ktb’, ‘bik’, ‘wew’, ‘daw’, ‘wep’, ‘bsv’, ‘dal’, ‘can’, ‘adl’, ‘kot’, ‘cst’, ‘ewa’, ‘asa’, ‘mcq’, ‘all’
Default: [‘all’]
datatype (
strorlistofstr) – The data types to load. Valid values: ‘1s’, ‘1sec’, ‘1m’, ‘1min’, ‘1h’, ‘1hr’, ‘all’ Default: ‘all’get_support_data (
bool) – If true, data with an attribute “VAR_TYPE” with a value of “support_data” or ‘data’ will be loaded into tplot. Default: Falsevarformat (
str) – The CDF file variable formats to load into tplot. Wildcard character “*” is accepted. Default: None (all variables will be loaded).varnames (
listofstr) – List of variable names to load. Default: [] (all variables will be loaded)downloadonly (
bool) – Set this flag to download the CDF files, but not load them into tplot variables. Default: Falsenotplot (
bool) – Return the data in hash tables instead of creating tplot variables. Default: Falseno_update (
bool) – If set, only load data from your local cache. Default: Falseuname (
str) – User name. Default: Nonepasswd (
str) – Password. Default: Nonetime_clip (
bool) – Time clip the variables to exactly the range specified in the trange keyword. Default: Falseror (
bool) – If set, print PI info and rules of the road. Default: Trueforce_download (
bool) – Download file even if local version is more recent than server version Default: False
Examples
>>> import pyspedas
>>> from pyspedas import tplot
>>> mm210_vars=pyspedas.projects.erg.gmag_mm210(trange=["2005-01-01", "2005-01-02"],site='adl',datatype='1min')
>>> tplot('mm210_mag_adl_1min_hdz')
import pyspedas
from pyspedas import tplot
mm210_vars=pyspedas.projects.erg.gmag_mm210(trange=["2005-01-01", "2005-01-02"],site='adl',datatype='1min')
tplot('mm210_mag_adl_1min_hdz')
STEL Fluxgate Magnetometers
- pyspedas.projects.erg.gmag_stel_fluxgate(trange: List[str] = ['2020-08-01', '2020-08-02'], suffix: str = '', site: str | List[str] = 'all', datatype: str | List[str] = 'all', get_support_data: bool = False, varformat: str | None = None, varnames: List[str] = [], downloadonly: bool = False, notplot: bool = False, no_update: bool = False, uname: str | None = None, passwd: str | None = None, time_clip: bool = False, ror: bool = True, force_download: bool = False) Dict | None | List[str | Any][source]
Load data from STEL Fluxgate Magnetometers (wrapper for gmag_isee_fluxgate)
- Parameters:
trange (
listofstr) – time range of interest [starttime, endtime] with the format ‘YYYY-MM-DD’,’YYYY-MM-DD’] or to specify more or less than a day [‘YYYY-MM-DD/hh:mm:ss’,’YYYY-MM-DD/hh:mm:ss’] Default: [‘2020-08-01’, ‘2020-08-02’]suffix (
str) – The tplot variable names will be given this suffix. Default: ‘’site (
strorlistofstr) – The site or list of sites to load. Valid values: ‘msr’, ‘rik’, ‘kag’, ‘ktb’, ‘lcl’, ‘mdm’, ‘tew’, ‘all’ Default: [‘all’]datatype (
strorlistofstr) – The data types to load. Valid values: ‘64hz’, ‘1sec’, ‘1min’, ‘1h’, ‘all’ Default: ‘all’get_support_data (
bool) – If true, data with an attribute “VAR_TYPE” with a value of “support_data” or ‘data’ will be loaded into tplot. Default: Falsevarformat (
str) – The CDF file variable formats to load into tplot. Wildcard character “*” is accepted. Default: None (all variables will be loaded).varnames (
listofstr) – List of variable names to load. Default: [] (all variables will be loaded)downloadonly (
bool) – Set this flag to download the CDF files, but not load them into tplot variables. Default: Falsenotplot (
bool) – Return the data in hash tables instead of creating tplot variables. Default: Falseno_update (
bool) – If set, only load data from your local cache. Default: Falseuname (
str) – User name. Default: Nonepasswd (
str) – Password. Default: Nonetime_clip (
bool) – Time clip the variables to exactly the range specified in the trange keyword. Default: Falseror (
bool) – If set, print PI info and rules of the road. Default: Trueforce_download (
bool) – Download file even if local version is more recent than server version Default: False
Examples
>>> import pyspedas
>>> from pyspedas import tplot
>>> fluxgate_vars=pyspedas.projects.erg.gmag_stel_fluxgate(trange=['2020-08-01','2020-08-02'], site='all')
>>> tplot('isee_fluxgate_mag_ktb_1min_hdz')
import pyspedas
from pyspedas import tplot
fluxgate_vars=pyspedas.projects.erg.gmag_stel_fluxgate(trange=['2020-08-01','2020-08-02'], site='ktb')
tplot('isee_fluxgate_mag_ktb_1min_hdz')

STEL Induction Magnetometers
- pyspedas.projects.erg.gmag_stel_induction(trange: List[str] = ['2018-10-18/00:00:00', '2018-10-18/02:00:00'], suffix: str = '', site: str | List[str] = 'all', get_support_data: bool = False, varformat: str | None = None, varnames: List[str] = [], downloadonly: bool = False, notplot: bool = False, no_update: bool = False, uname: str | None = None, passwd: str | None = None, time_clip: bool = False, ror: bool = True, frequency_dependent: bool = False, force_download: bool = False) List[str][source]
Load data from STEL Induction Magnetometers (wrapper for gmag_isee_induction)
- Parameters:
trange (
listofstr) – time range of interest [starttime, endtime] with the format [‘YYYY-MM-DD’,’YYYY-MM-DD’] or to specify more or less than a day [‘YYYY-MM-DD/hh:mm:ss’,’YYYY-MM-DD/hh:mm:ss’] Default: [‘2018-10-18/00:00:00’, ‘2018-10-18/02:00:00’]suffix (
str) – The tplot variable names will be given this suffix. Default: ‘’site (
strorlistofstr) – The site or list of sites to load. Valid values: “ath”, “gak”, “hus”, “kap”, “lcl”, “mgd”, “msr”, “nai”, “ptk”, “rik”, “sta”, “zgn”, “all” Default: [‘all’]get_support_data (
bool) – If true, data with an attribute “VAR_TYPE” with a value of “support_data” or ‘data’ will be loaded into tplot. Default: Falsevarformat (
str) – The CDF file variable formats to load into tplot. Wildcard character “*” is accepted. Default: None (all variables will be loaded).varnames (
listofstr) – List of variable names to load. Default: [] (all variables will be loaded)downloadonly (
bool) – Set this flag to download the CDF files, but not load them into tplot variables. Default: Falsenotplot (
bool) – Return the data in hash tables instead of creating tplot variables. Default: Falseno_update (
bool) – If set, only load data from your local cache. Default: Falseuname (
str) – User name. Default: Nonepasswd (
str) – Password. Default: Nonetime_clip (
bool) – Time clip the variables to exactly the range specified in the trange keyword. Default: Falseror (
bool) – If set, print PI info and rules of the road. Default: Truefrequency_dependent (
bool) – If set, load frequency dependent data. Default: Falseforce_download (
bool) – Download file even if local version is more recent than server version Default: False
Examples
>>> import pyspedas
>>> from pyspedas import tplot
>>> ind_vars=pyspedas.projects.erg.gmag_stel_induction(trange=['2020-08-01','2020-08-02'], site='all')
>>> tplot('isee_induction_db_dt_msr')
import pyspedas
from pyspedas import tplot
ind_vars=pyspedas.projects.erg.gmag_stel_induction(trange=['2020-08-01','2020-08-02'], site='msr')
tplot('isee_induction_db_dt_msr')

SuperDARN (radar)
- pyspedas.projects.erg.sd_fit(trange: List[str] = ['2018-10-18/00:00:00', '2018-10-18/02:00:00'], suffix: str = '', site: str | List[str] = 'all', get_support_data: bool = False, varformat: str | None = None, varnames: List[str] = [], downloadonly: bool = False, notplot: bool = False, no_update: bool = False, uname: str | None = None, passwd: str | None = None, time_clip: bool = False, ror: bool = True, compact: bool = False, force_download: bool = False) List[str][source]
Load SuperDARN data from ERG Science Center
- Parameters:
trange (
listofstr) – time range of interest [starttime, endtime] with the format ‘YYYY-MM-DD’,’YYYY-MM-DD’] or to specify more or less than a day [‘YYYY-MM-DD/hh:mm:ss’,’YYYY-MM-DD/hh:mm:ss’] Default: [‘2020-08-01’, ‘2020-08-02’]suffix (
str) – The tplot variable names will be given this suffix. Default: ‘’site (
strorlistofstr) – The site or list of sites to load. Valid values: ‘ade’, ‘adw’, ‘bks’, ‘bpk’, ‘cly’, ‘cve’, ‘cvw’, ‘dce’, ‘fhe’, ‘fhw’, ‘fir’, ‘gbr’, ‘hal’, ‘han’, ‘hok’, ‘hkw’, ‘inv’, ‘kap’, ‘ker’, ‘kod’, ‘ksr’, ‘mcm’, ‘pgr’, ‘pyk’, ‘rkn’, ‘san’, ‘sas’, ‘sps’, ‘sto’, ‘sye’, ‘sys’, ‘tig’, ‘unw’, ‘wal’, ‘zho’, ‘lyr’, ‘all Default: [‘all’]get_support_data (
bool) – If true, data with an attribute “VAR_TYPE” with a value of “support_data” or ‘data’ will be loaded into tplot. Default: Falsevarformat (
str) – The CDF file variable formats to load into tplot. Wildcard character “*” is accepted. Default: None (all variables will be loaded).varnames (
listofstr) – List of variable names to load. Default: [] (all variables will be loaded)downloadonly (
bool) – Set this flag to download the CDF files, but not load them into tplot variables. Default: Falsenotplot (
bool) – Return the data in hash tables instead of creating tplot variables. Default: Falseno_update (
bool) – If set, only load data from your local cache. Default: Falseuname (
str) – User name. Default: Nonepasswd (
str) – Password. Default: Nonetime_clip (
bool) – Time clip the variables to exactly the range specified in the trange keyword. Default: Falseror (
bool) – If set, print PI info and rules of the road. Default: Truecompact (
bool) – If True, leave only minimal set of the variables. Default: Falseforce_download (
bool) – Download file even if local version is more recent than server version Default: False
Examples
>>> import pyspedas
>>> sd_vars=pyspedas.projects.erg.sd_fit(trange=['2018-10-14/00:00:00','2018-10-14/02:00:00'],site='ade')
>>> print(sd_vars)
import pyspedas
sd_vars=pyspedas.projects.erg.sd_fit(trange=['2018-10-14/00:00:00','2018-10-14/02:00:00'],site='ade')
print(sd_vars)
ISEE BRIO (riometer)
- pyspedas.projects.erg.isee_brio(trange: List[str] = ['2020-08-01', '2020-08-02'], suffix: str = '', site: str | List[str] = 'all', get_support_data: bool = False, varformat: str | None = None, varnames: List[str] = [], downloadonly: bool = False, notplot: bool = False, no_update: bool = False, uname: str | None = None, passwd: str | None = None, time_clip: bool = False, ror: bool = True, force_download: bool = False) List[str][source]
Load isee_brio riometer data from ERG Science Center
- Parameters:
trange (
listofstr) – time range of interest [starttime, endtime] with the format ‘YYYY-MM-DD’,’YYYY-MM-DD’] or to specify more or less than a day [‘YYYY-MM-DD/hh:mm:ss’,’YYYY-MM-DD/hh:mm:ss’] Default: [‘2020-08-01’, ‘2020-08-02’]suffix (
str) – The tplot variable names will be given this suffix. Default: ‘’site (
strorlistofstr) – The site or list of sites to load. Valid values: ‘ath’, ‘kap’, ‘gak’, ‘hus’, ‘zgn’, ‘ist’, ‘all’ Default: [‘all’]get_support_data (
bool) – If true, data with an attribute “VAR_TYPE” with a value of “support_data” or ‘data’ will be loaded into tplot. Default: Falsevarformat (
str) – The CDF file variable formats to load into tplot. Wildcard character “*” is accepted. Default: None (all variables will be loaded).varnames (
listofstr) – List of variable names to load. Default: [] (all variables will be loaded)downloadonly (
bool) – Set this flag to download the CDF files, but not load them into tplot variables. Default: Falsenotplot (
bool) – Return the data in hash tables instead of creating tplot variables. Default: Falseno_update (
bool) – If set, only load data from your local cache. Default: Falseuname (
str) – User name. Default: Nonepasswd (
str) – Password. Default: Nonetime_clip (
bool) – Time clip the variables to exactly the range specified in the trange keyword. Default: Falseror (
bool) – If set, print PI info and rules of the road. Default: Trueforce_download (
bool) – Download file even if local version is more recent than server version Default: False
Examples
>>> import pyspedas
>>> brio_vars=pyspedas.projects.erg.isee_brio(trange=['2020-08-01', '2020-08-02'],site='ath')
>>> print(brio_vars)
import pyspedas
brio_vars=pyspedas.projects.erg.isee_brio(trange=['2020-08-01', '2020-08-02'],site='ath')
print(brio_vars)
ISEE VLF
- pyspedas.projects.erg.isee_vlf(trange: List[str] = ['2017-03-30/12:00:00', '2017-03-30/15:00:00'], suffix: str = '', site: str | List[str] = 'all', get_support_data: bool = False, varformat: str | None = None, varnames: List[str] = [], downloadonly: bool = False, notplot: bool = False, no_update: bool = False, uname: str | None = None, passwd: str | None = None, time_clip: bool = False, ror: bool = True, cal_gain: bool = False, force_download: bool = False)[source]
Load ISEE VLF data from ERG Science Center
- Parameters:
trange (
listofstr) – time range of interest [starttime, endtime] with the format ‘YYYY-MM-DD’,’YYYY-MM-DD’] or to specify more or less than a day [‘YYYY-MM-DD/hh:mm:ss’,’YYYY-MM-DD/hh:mm:ss’] Default: [‘2017-03-30/12:00:00’, ‘2017-03-30/15:00:00’]suffix (
str) – The tplot variable names will be given this suffix. Default: ‘’site (
strorlistofstr) – The site or list of sites to load. Valid values: ‘ath’, ‘gak’, ‘hus’, ‘ist’, ‘kap’, ‘mam’, ‘nai’, ‘all’ Default: [‘all’]get_support_data (
bool) – If true, data with an attribute “VAR_TYPE” with a value of “support_data” or ‘data’ will be loaded into tplot. Default: Falsevarformat (
str) – The CDF file variable formats to load into tplot. Wildcard character “*” is accepted. Default: None (all variables will be loaded).varnames (
listofstr) – List of variable names to load. Default: [] (all variables will be loaded)downloadonly (
bool) – Set this flag to download the CDF files, but not load them into tplot variables. Default: Falsenotplot (
bool) – Return the data in hash tables instead of creating tplot variables. Default: Falseno_update (
bool) – If set, only load data from your local cache. Default: Falseuname (
str) – User name. Default: Nonepasswd (
str) – Password. Default: Nonetime_clip (
bool) – Time clip the variables to exactly the range specified in the trange keyword. Default: Falseror (
bool) – If set, print PI info and rules of the road. Default: Truecal_gain (
bool) – If True, use calibration parameters in the CDF file to apply a gain calibration. Default: Falseforce_download (
bool) – Download file even if local version is more recent than server version Default: False
Examples
>>> import pyspedas
>>> vlf_vars=pyspedas.projects.erg.isee_vlf(trange=['2017-03-30/12:00:00', '2017-03-30/15:00:00'],site='ath')
>>> print(vlf_vars)
import pyspedas
vlf_vars=pyspedas.projects.erg.isee_vlf(trange=['2017-03-30/12:00:00', '2017-03-30/15:00:00'],site='ath')
print(vlf_vars)