Deep Space Climate Observatory (DSCOVR)
The routines in this module can be used to load data from the Deep Space Climate Observatory (DSCOVR) mission.
Magnetometer (MAG)
- pyspedas.projects.dscovr.mag(trange=['2018-10-16', '2018-10-17'], instrument='mag', prefix='', suffix='', get_support_data=False, varformat=None, varnames=[], downloadonly=False, notplot=False, no_update=False, time_clip=False, force_download=False)
Load DSCOVR data into tplot variables.
- Parameters:
trange (
listofstr, optional) – Time range of interest [starttime, endtime] with the format [‘YYYY-MM-DD’,’YYYY-MM-DD’] or to specify more or less than a day [‘YYYY-MM-DD/hh:mm:ss’,’YYYY-MM-DD/hh:mm:ss’]. Default is [‘2018-10-16’, ‘2018-10-17’].instrument (
strorlistofstr, optional) – Type of instrument. Values can be: ‘mag’, ‘fc’ or ‘faraday_cup’, ‘orbit’ or ‘orb’ or ‘pre_or’, ‘att’ or ‘def_at’, ‘pre_at’, ‘all’. If ‘all’ is specified, all instruments will be loaded. Default is ‘mag’.prefix (
str, optional) – The tplot variable names will be given this prefix. Default is ‘’. In all cases a suitable prefix will be given depending on the instrument.suffix (
str, optional) – The tplot variable names will be given this suffix. Default is no suffix is added.get_support_data (
bool, optional) – Data with an attribute “VAR_TYPE” with a value of “support_data” will be loaded into tplot. Default is False; only loads in data with a “VAR_TYPE” attribute of “data”.varformat (
str, optional) – The file variable formats to load into tplot. Wildcard character “*” is accepted. Default is all variables are loaded in.varnames (
listofstr, optional) – List of variable names to load. Default is all data variables are loaded.downloadonly (
bool, optional) – Set this flag to download the CDF files, but not load them into tplot variables. Default is False.notplot (
bool, optional) – Return the data in hash tables instead of creating tplot variables. Default is False.no_update (
bool, optional) – If set, only load data from your local cache. Default is False.time_clip (
bool, optional) – Time clip the variables to exactly the range specified in the trange keyword. Default is False.force_download (
bool, optional) – Download file even if local version is more recent than server version. Default is False.
- Returns:
List of tplot variables created. If downloadonly is set to True, returns a list of the downloaded files. If notplot is set to True, returns a dictionary of the data loaded.
- Return type:
listofstr/dictionary
Examples
>>> import pyspedas
>>> from pyspedas import tplot
>>> mag_vars = pyspedas.projects.dscovr.mag(trange=['2018-11-5', '2018-11-6'])
>>> tplot('dsc_h0_mag_B1GSE')
Example
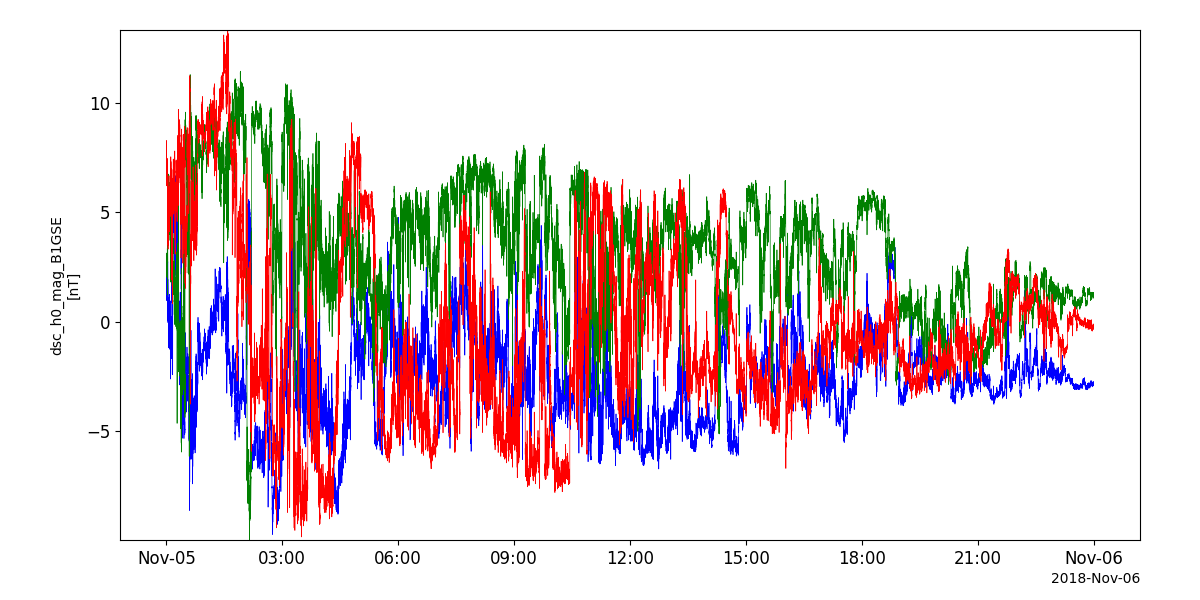
import pyspedas
from pyspedas import tplot
mag_vars = pyspedas.projects.dscovr.mag(trange=['2018-11-5', '2018-11-6'])
tplot('dsc_h0_mag_B1GSE')
Faraday cup (FC)
- pyspedas.projects.dscovr.fc(trange=['2018-10-16', '2018-10-17'], instrument='mag', prefix='', suffix='', get_support_data=False, varformat=None, varnames=[], downloadonly=False, notplot=False, no_update=False, time_clip=False, force_download=False)
Load DSCOVR data into tplot variables.
- Parameters:
trange (
listofstr, optional) – Time range of interest [starttime, endtime] with the format [‘YYYY-MM-DD’,’YYYY-MM-DD’] or to specify more or less than a day [‘YYYY-MM-DD/hh:mm:ss’,’YYYY-MM-DD/hh:mm:ss’]. Default is [‘2018-10-16’, ‘2018-10-17’].instrument (
strorlistofstr, optional) – Type of instrument. Values can be: ‘mag’, ‘fc’ or ‘faraday_cup’, ‘orbit’ or ‘orb’ or ‘pre_or’, ‘att’ or ‘def_at’, ‘pre_at’, ‘all’. If ‘all’ is specified, all instruments will be loaded. Default is ‘mag’.prefix (
str, optional) – The tplot variable names will be given this prefix. Default is ‘’. In all cases a suitable prefix will be given depending on the instrument.suffix (
str, optional) – The tplot variable names will be given this suffix. Default is no suffix is added.get_support_data (
bool, optional) – Data with an attribute “VAR_TYPE” with a value of “support_data” will be loaded into tplot. Default is False; only loads in data with a “VAR_TYPE” attribute of “data”.varformat (
str, optional) – The file variable formats to load into tplot. Wildcard character “*” is accepted. Default is all variables are loaded in.varnames (
listofstr, optional) – List of variable names to load. Default is all data variables are loaded.downloadonly (
bool, optional) – Set this flag to download the CDF files, but not load them into tplot variables. Default is False.notplot (
bool, optional) – Return the data in hash tables instead of creating tplot variables. Default is False.no_update (
bool, optional) – If set, only load data from your local cache. Default is False.time_clip (
bool, optional) – Time clip the variables to exactly the range specified in the trange keyword. Default is False.force_download (
bool, optional) – Download file even if local version is more recent than server version. Default is False.
- Returns:
List of tplot variables created. If downloadonly is set to True, returns a list of the downloaded files. If notplot is set to True, returns a dictionary of the data loaded.
- Return type:
listofstr/dictionary
Examples
>>> import pyspedas
>>> from pyspedas import tplot
>>> mag_vars = pyspedas.projects.dscovr.mag(trange=['2018-11-5', '2018-11-6'])
>>> tplot('dsc_h0_mag_B1GSE')
Example
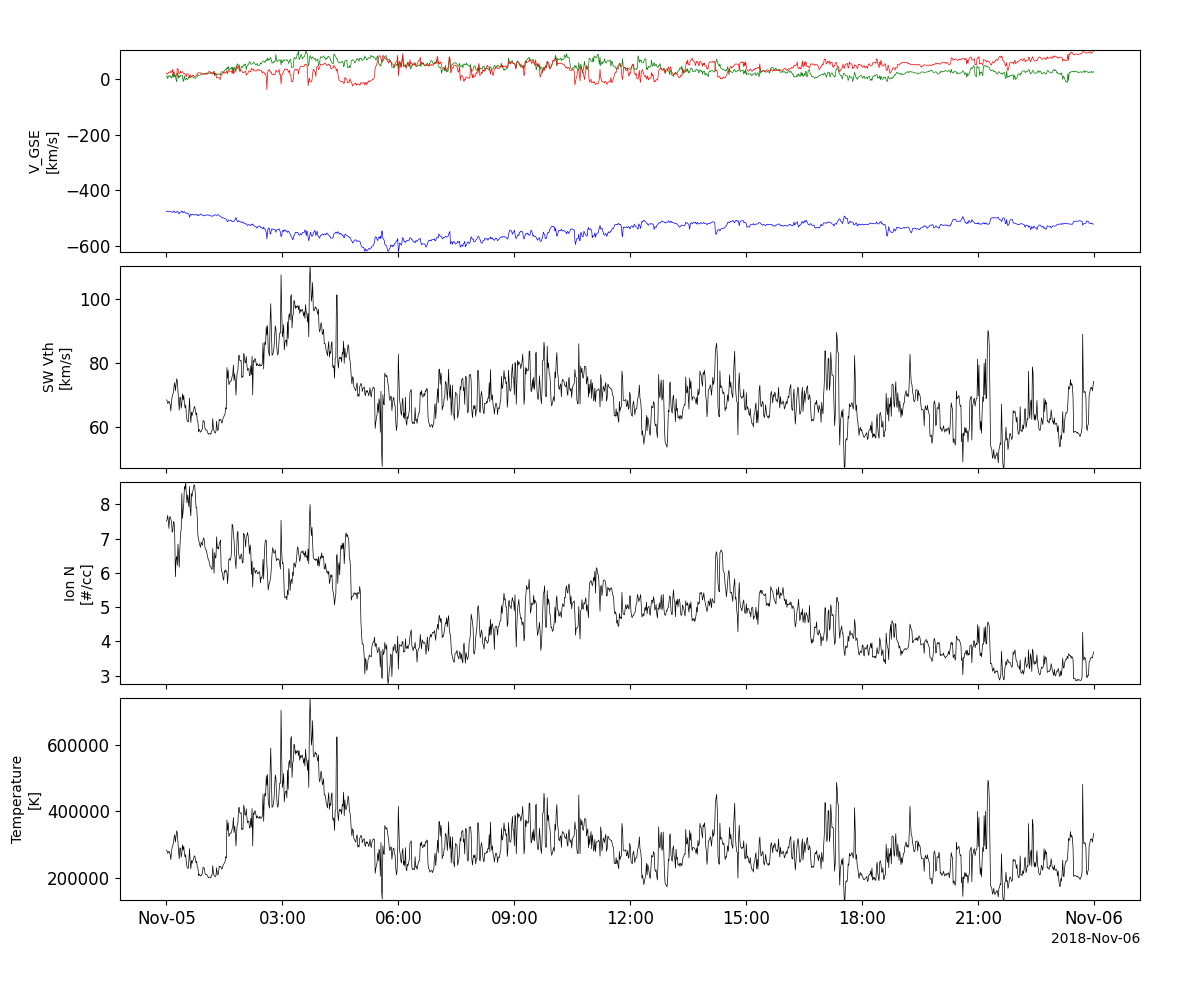
import pyspedas
from pyspedas import tplot
fc_vars = pyspedas.projects.dscovr.fc(trange=['2018-11-5', '2018-11-6'])
tplot(['dsc_h1_fc_V_GSE', 'dsc_h1_fc_THERMAL_SPD', 'dsc_h1_fc_Np', 'dsc_h1_fc_THERMAL_TEMP'])
Orbit data
- pyspedas.projects.dscovr.orb(trange=['2018-10-16', '2018-10-17'], instrument='mag', prefix='', suffix='', get_support_data=False, varformat=None, varnames=[], downloadonly=False, notplot=False, no_update=False, time_clip=False, force_download=False)
Load DSCOVR data into tplot variables.
- Parameters:
trange (
listofstr, optional) – Time range of interest [starttime, endtime] with the format [‘YYYY-MM-DD’,’YYYY-MM-DD’] or to specify more or less than a day [‘YYYY-MM-DD/hh:mm:ss’,’YYYY-MM-DD/hh:mm:ss’]. Default is [‘2018-10-16’, ‘2018-10-17’].instrument (
strorlistofstr, optional) – Type of instrument. Values can be: ‘mag’, ‘fc’ or ‘faraday_cup’, ‘orbit’ or ‘orb’ or ‘pre_or’, ‘att’ or ‘def_at’, ‘pre_at’, ‘all’. If ‘all’ is specified, all instruments will be loaded. Default is ‘mag’.prefix (
str, optional) – The tplot variable names will be given this prefix. Default is ‘’. In all cases a suitable prefix will be given depending on the instrument.suffix (
str, optional) – The tplot variable names will be given this suffix. Default is no suffix is added.get_support_data (
bool, optional) – Data with an attribute “VAR_TYPE” with a value of “support_data” will be loaded into tplot. Default is False; only loads in data with a “VAR_TYPE” attribute of “data”.varformat (
str, optional) – The file variable formats to load into tplot. Wildcard character “*” is accepted. Default is all variables are loaded in.varnames (
listofstr, optional) – List of variable names to load. Default is all data variables are loaded.downloadonly (
bool, optional) – Set this flag to download the CDF files, but not load them into tplot variables. Default is False.notplot (
bool, optional) – Return the data in hash tables instead of creating tplot variables. Default is False.no_update (
bool, optional) – If set, only load data from your local cache. Default is False.time_clip (
bool, optional) – Time clip the variables to exactly the range specified in the trange keyword. Default is False.force_download (
bool, optional) – Download file even if local version is more recent than server version. Default is False.
- Returns:
List of tplot variables created. If downloadonly is set to True, returns a list of the downloaded files. If notplot is set to True, returns a dictionary of the data loaded.
- Return type:
listofstr/dictionary
Examples
>>> import pyspedas
>>> from pyspedas import tplot
>>> mag_vars = pyspedas.projects.dscovr.mag(trange=['2018-11-5', '2018-11-6'])
>>> tplot('dsc_h0_mag_B1GSE')
Example
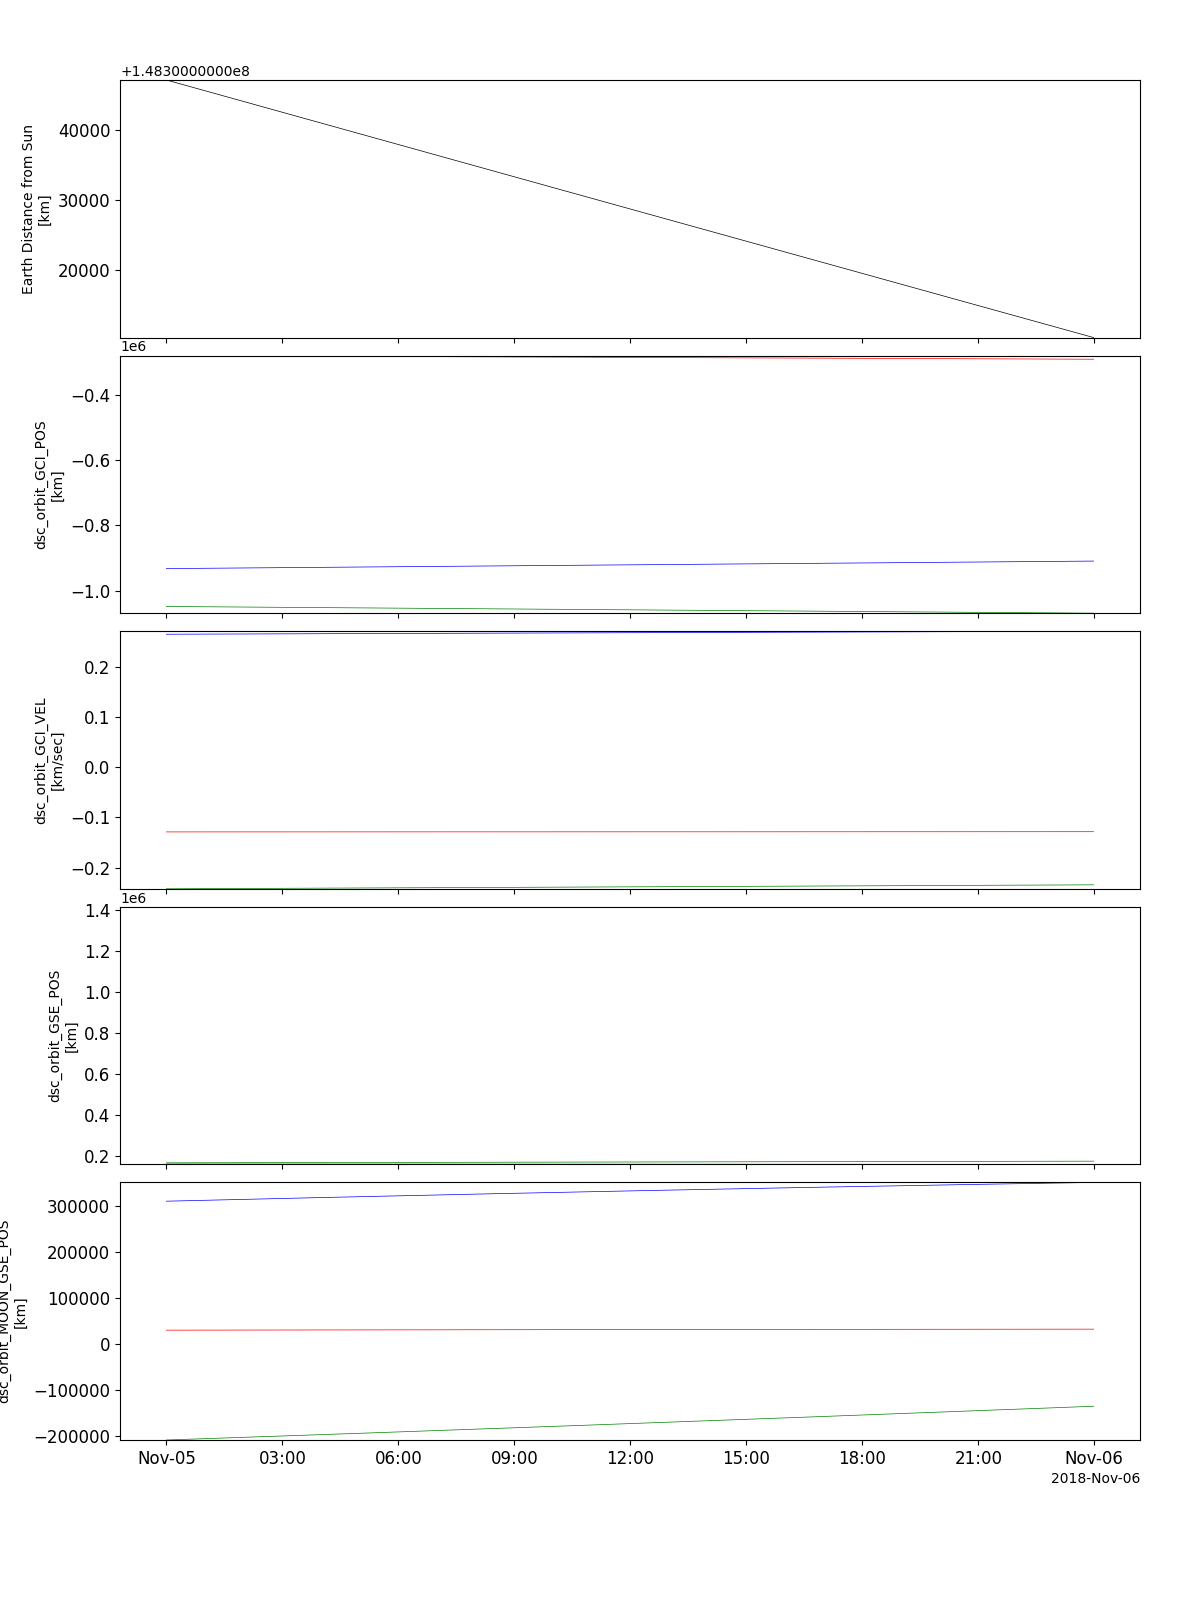
import pyspedas
from pyspedas import tplot
orb_vars = pyspedas.projects.dscovr.orb(trange=['2018-11-5', '2018-11-6'])
tplot(['dsc_orbit_SUN_R', 'dsc_orbit_GCI_POS', 'dsc_orbit_GCI_VEL', 'dsc_orbit_GSE_POS', 'dsc_orbit_MOON_GSE_POS'])
Attitude data
- pyspedas.projects.dscovr.att(trange=['2018-10-16', '2018-10-17'], instrument='mag', prefix='', suffix='', get_support_data=False, varformat=None, varnames=[], downloadonly=False, notplot=False, no_update=False, time_clip=False, force_download=False)
Load DSCOVR data into tplot variables.
- Parameters:
trange (
listofstr, optional) – Time range of interest [starttime, endtime] with the format [‘YYYY-MM-DD’,’YYYY-MM-DD’] or to specify more or less than a day [‘YYYY-MM-DD/hh:mm:ss’,’YYYY-MM-DD/hh:mm:ss’]. Default is [‘2018-10-16’, ‘2018-10-17’].instrument (
strorlistofstr, optional) – Type of instrument. Values can be: ‘mag’, ‘fc’ or ‘faraday_cup’, ‘orbit’ or ‘orb’ or ‘pre_or’, ‘att’ or ‘def_at’, ‘pre_at’, ‘all’. If ‘all’ is specified, all instruments will be loaded. Default is ‘mag’.prefix (
str, optional) – The tplot variable names will be given this prefix. Default is ‘’. In all cases a suitable prefix will be given depending on the instrument.suffix (
str, optional) – The tplot variable names will be given this suffix. Default is no suffix is added.get_support_data (
bool, optional) – Data with an attribute “VAR_TYPE” with a value of “support_data” will be loaded into tplot. Default is False; only loads in data with a “VAR_TYPE” attribute of “data”.varformat (
str, optional) – The file variable formats to load into tplot. Wildcard character “*” is accepted. Default is all variables are loaded in.varnames (
listofstr, optional) – List of variable names to load. Default is all data variables are loaded.downloadonly (
bool, optional) – Set this flag to download the CDF files, but not load them into tplot variables. Default is False.notplot (
bool, optional) – Return the data in hash tables instead of creating tplot variables. Default is False.no_update (
bool, optional) – If set, only load data from your local cache. Default is False.time_clip (
bool, optional) – Time clip the variables to exactly the range specified in the trange keyword. Default is False.force_download (
bool, optional) – Download file even if local version is more recent than server version. Default is False.
- Returns:
List of tplot variables created. If downloadonly is set to True, returns a list of the downloaded files. If notplot is set to True, returns a dictionary of the data loaded.
- Return type:
listofstr/dictionary
Examples
>>> import pyspedas
>>> from pyspedas import tplot
>>> mag_vars = pyspedas.projects.dscovr.mag(trange=['2018-11-5', '2018-11-6'])
>>> tplot('dsc_h0_mag_B1GSE')
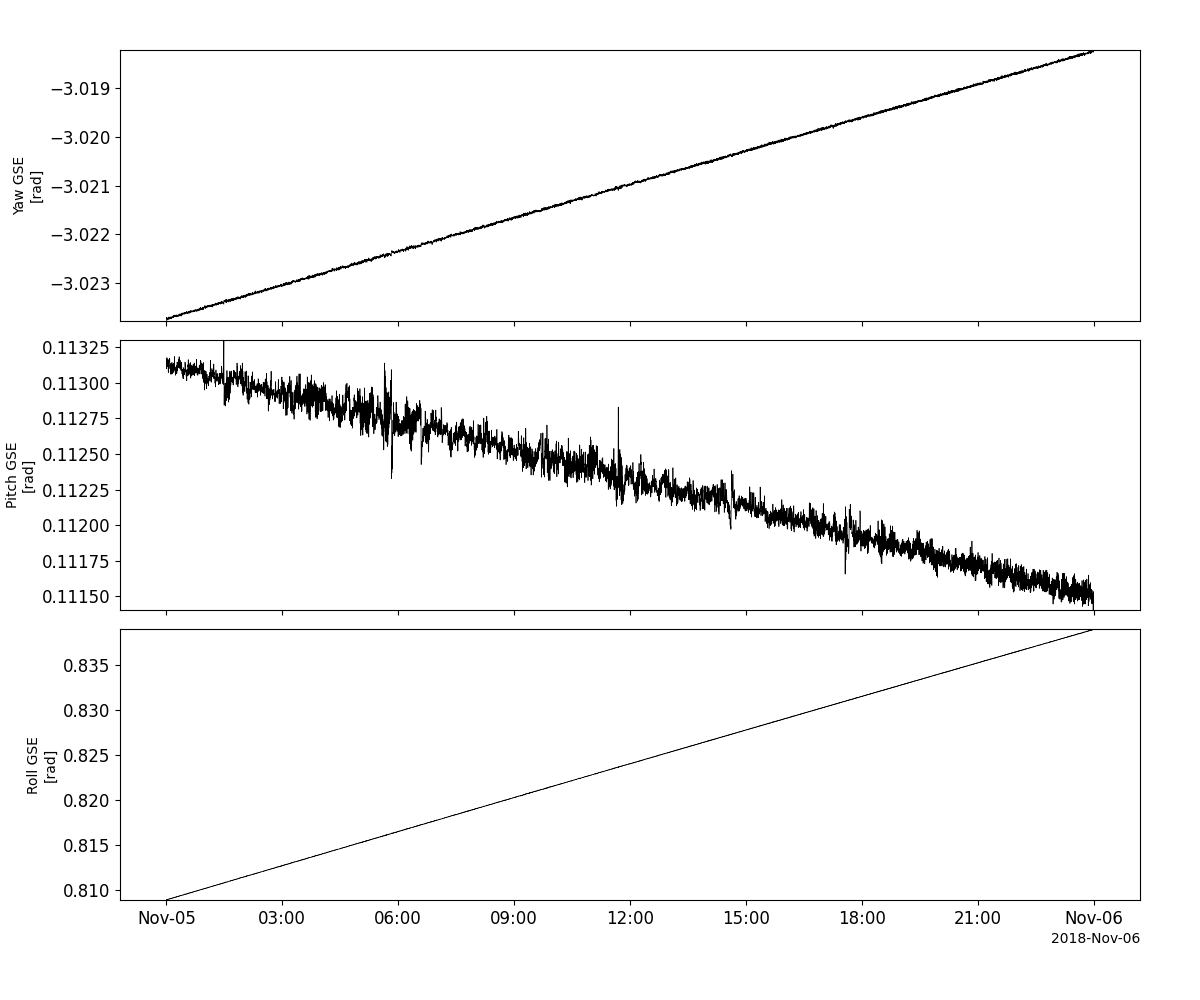
Example
import pyspedas
from pyspedas import tplot
att_vars = pyspedas.projects.dscovr.att(trange=['2018-11-5', '2018-11-6'])
tplot(['dsc_att_GSE_Yaw', 'dsc_att_GSE_Pitch', 'dsc_att_GSE_Roll'])
Load all data at once
- pyspedas.projects.dscovr.all(trange=['2018-10-16', '2018-10-17'], instrument='mag', prefix='', suffix='', get_support_data=False, varformat=None, varnames=[], downloadonly=False, notplot=False, no_update=False, time_clip=False, force_download=False)
Load DSCOVR data into tplot variables.
- Parameters:
trange (
listofstr, optional) – Time range of interest [starttime, endtime] with the format [‘YYYY-MM-DD’,’YYYY-MM-DD’] or to specify more or less than a day [‘YYYY-MM-DD/hh:mm:ss’,’YYYY-MM-DD/hh:mm:ss’]. Default is [‘2018-10-16’, ‘2018-10-17’].instrument (
strorlistofstr, optional) – Type of instrument. Values can be: ‘mag’, ‘fc’ or ‘faraday_cup’, ‘orbit’ or ‘orb’ or ‘pre_or’, ‘att’ or ‘def_at’, ‘pre_at’, ‘all’. If ‘all’ is specified, all instruments will be loaded. Default is ‘mag’.prefix (
str, optional) – The tplot variable names will be given this prefix. Default is ‘’. In all cases a suitable prefix will be given depending on the instrument.suffix (
str, optional) – The tplot variable names will be given this suffix. Default is no suffix is added.get_support_data (
bool, optional) – Data with an attribute “VAR_TYPE” with a value of “support_data” will be loaded into tplot. Default is False; only loads in data with a “VAR_TYPE” attribute of “data”.varformat (
str, optional) – The file variable formats to load into tplot. Wildcard character “*” is accepted. Default is all variables are loaded in.varnames (
listofstr, optional) – List of variable names to load. Default is all data variables are loaded.downloadonly (
bool, optional) – Set this flag to download the CDF files, but not load them into tplot variables. Default is False.notplot (
bool, optional) – Return the data in hash tables instead of creating tplot variables. Default is False.no_update (
bool, optional) – If set, only load data from your local cache. Default is False.time_clip (
bool, optional) – Time clip the variables to exactly the range specified in the trange keyword. Default is False.force_download (
bool, optional) – Download file even if local version is more recent than server version. Default is False.
- Returns:
List of tplot variables created. If downloadonly is set to True, returns a list of the downloaded files. If notplot is set to True, returns a dictionary of the data loaded.
- Return type:
listofstr/dictionary
Examples
>>> import pyspedas
>>> from pyspedas import tplot
>>> mag_vars = pyspedas.projects.dscovr.mag(trange=['2018-11-5', '2018-11-6'])
>>> tplot('dsc_h0_mag_B1GSE')
Example
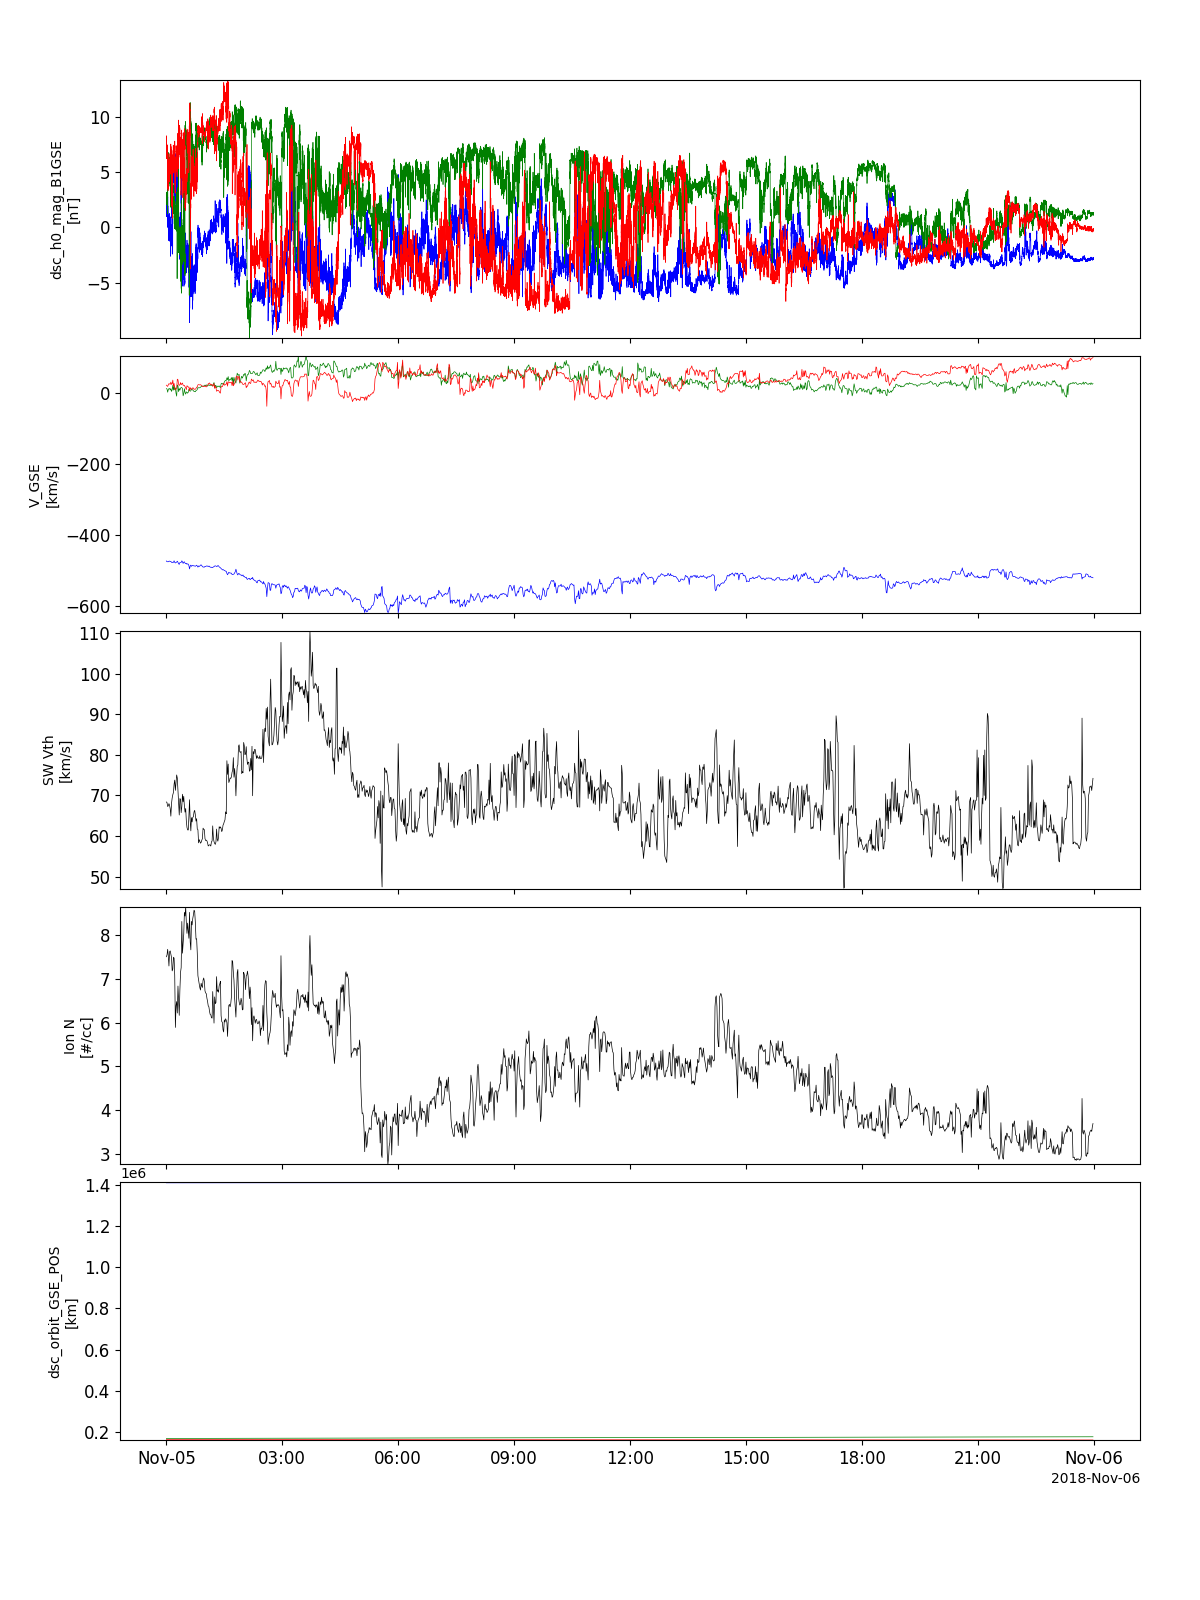
import pyspedas
from pyspedas import tplot
all_vars = pyspedas.projects.dscovr.all(trange=['2018-11-5', '2018-11-6'])
tplot(['dsc_h0_mag_B1GSE', 'dsc_h1_fc_V_GSE', 'dsc_h1_fc_THERMAL_SPD', 'dsc_h1_fc_Np', 'dsc_orbit_GSE_POS'])