Equator-S
The routines in this module can be used to load data from the Equator-S mission.
Fluxgate magnetometer (MAM)
- pyspedas.projects.equator_s.mam(trange=['1998-04-06', '1998-04-07'], instrument='mam', datatype='pp', prefix='', suffix='', get_support_data=False, varformat=None, varnames=[], downloadonly=False, notplot=False, no_update=False, time_clip=False, force_download=False)
Load data from the Equator-S mission.
- Parameters:
trange (
listofstr, optional) – Time range of interest [starttime, endtime] with the format [‘YYYY-MM-DD’,’YYYY-MM-DD’] or to specify more or less than a day [‘YYYY-MM-DD/hh:mm:ss’,’YYYY-MM-DD/hh:mm:ss’]. Default is [‘1998-04-06’, ‘1998-04-07’].instrument (
str,listofstr, optional) – Type of instrument. Valid values: ‘aux’, ‘edi’, ‘epi’, ‘ici’, ‘mam’, ‘pcd’, ‘sfd’, ‘all’. Default is ‘mam’. If ‘all’ is specified, all instruments will be loaded.datatype (
str, optional) – Type of data. Default is ‘pp’. Valid values: – ‘pp’ for instruments: ‘aux’, ‘edi’, ‘epi’, ‘ici’, ‘mam’, ‘pcd’ – ‘sp’ for instruments: ‘sfd’, ‘edi’ Instrument ‘edi’ has both ‘pp’ and ‘sp’ data; for all other instruments, datatype is ignored.prefix (
str, optional) – The tplot variable names will be given this prefix. Default is ‘’.suffix (
str, optional) – The tplot variable names will be given this suffix. Default is ‘’.get_support_data (
bool, optional) – Data with an attribute “VAR_TYPE” with a value of “support_data” will be loaded into tplot. Default is False, only loads in data with a “VAR_TYPE” attribute of “data”.varformat (
str, optional) – The file variable formats to load into tplot. Wildcard character “*” is accepted. Default is None, all variables are loaded in.varnames (
listofstr, optional) – List of variable names to load. Default is [], all data variables are loaded.downloadonly (
bool, optional) – Set this flag to download the CDF files, but not load them into tplot variables. Default is False.notplot (
bool, optional) – Return the data in hash tables instead of creating tplot variables. Default is False.no_update (
bool, optional) – If set, only load data from your local cache. Default is False.time_clip (
bool, optional) – Time clip the variables to exactly the range specified in the trange keyword. Default is False.force_download (
bool, optional) – Download file even if local version is more recent than server version. Default is False.
- Returns:
List of tplot variables created. If downloadonly is set to True, returns a list of the downloaded files. If notplot is set to True, returns a dictionary of the data loaded.
- Return type:
listofstr/dictionary
Examples
>>> import pyspedas
>>> from pyspedas import tplot
>>> edi_vars = pyspedas.projects.equator_s.edi(trange=['1998-04-06', '1998-04-07'])
>>> print(edi_vars)
['V_ed_xyz_gse%eq_pp_edi', 'E_xyz_gse%eq_pp_edi']
>>> tplot(edi_vars)
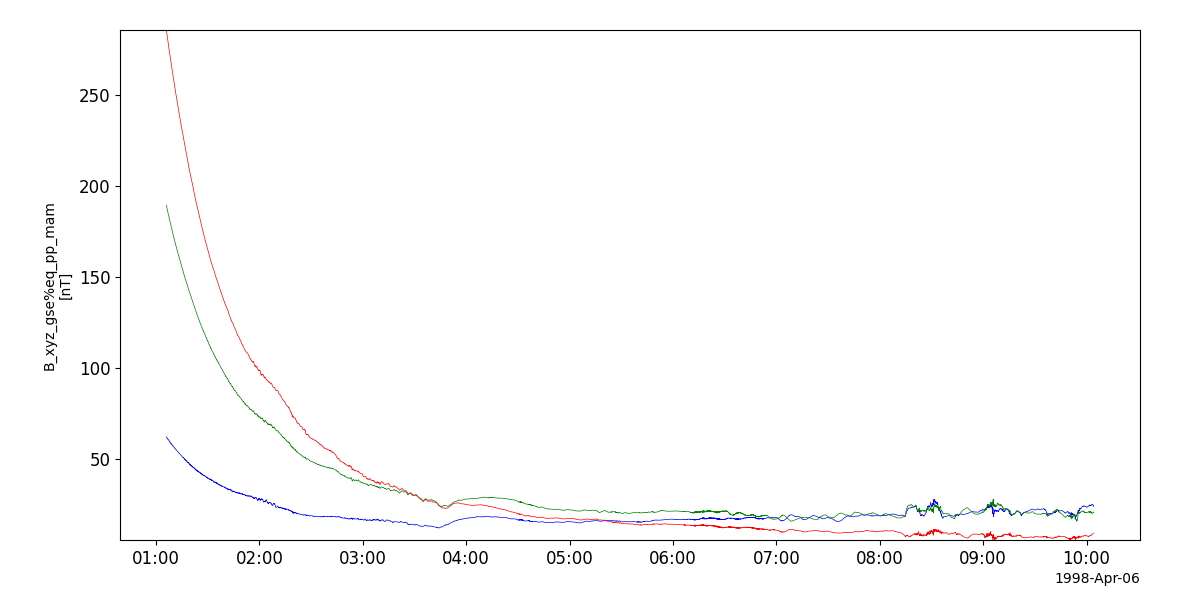
Example
import pyspedas
from pyspedas import tplot
mam_vars = pyspedas.projects.equator_s.mam(trange=['1998-04-06', '1998-04-07'])
tplot('B_xyz_gse%eq_pp_mam')
Electron beam sensing instrument (EDI)
- pyspedas.projects.equator_s.edi(trange=['1998-04-06', '1998-04-07'], instrument='mam', datatype='pp', prefix='', suffix='', get_support_data=False, varformat=None, varnames=[], downloadonly=False, notplot=False, no_update=False, time_clip=False, force_download=False)
Load data from the Equator-S mission.
- Parameters:
trange (
listofstr, optional) – Time range of interest [starttime, endtime] with the format [‘YYYY-MM-DD’,’YYYY-MM-DD’] or to specify more or less than a day [‘YYYY-MM-DD/hh:mm:ss’,’YYYY-MM-DD/hh:mm:ss’]. Default is [‘1998-04-06’, ‘1998-04-07’].instrument (
str,listofstr, optional) – Type of instrument. Valid values: ‘aux’, ‘edi’, ‘epi’, ‘ici’, ‘mam’, ‘pcd’, ‘sfd’, ‘all’. Default is ‘mam’. If ‘all’ is specified, all instruments will be loaded.datatype (
str, optional) – Type of data. Default is ‘pp’. Valid values: – ‘pp’ for instruments: ‘aux’, ‘edi’, ‘epi’, ‘ici’, ‘mam’, ‘pcd’ – ‘sp’ for instruments: ‘sfd’, ‘edi’ Instrument ‘edi’ has both ‘pp’ and ‘sp’ data; for all other instruments, datatype is ignored.prefix (
str, optional) – The tplot variable names will be given this prefix. Default is ‘’.suffix (
str, optional) – The tplot variable names will be given this suffix. Default is ‘’.get_support_data (
bool, optional) – Data with an attribute “VAR_TYPE” with a value of “support_data” will be loaded into tplot. Default is False, only loads in data with a “VAR_TYPE” attribute of “data”.varformat (
str, optional) – The file variable formats to load into tplot. Wildcard character “*” is accepted. Default is None, all variables are loaded in.varnames (
listofstr, optional) – List of variable names to load. Default is [], all data variables are loaded.downloadonly (
bool, optional) – Set this flag to download the CDF files, but not load them into tplot variables. Default is False.notplot (
bool, optional) – Return the data in hash tables instead of creating tplot variables. Default is False.no_update (
bool, optional) – If set, only load data from your local cache. Default is False.time_clip (
bool, optional) – Time clip the variables to exactly the range specified in the trange keyword. Default is False.force_download (
bool, optional) – Download file even if local version is more recent than server version. Default is False.
- Returns:
List of tplot variables created. If downloadonly is set to True, returns a list of the downloaded files. If notplot is set to True, returns a dictionary of the data loaded.
- Return type:
listofstr/dictionary
Examples
>>> import pyspedas
>>> from pyspedas import tplot
>>> edi_vars = pyspedas.projects.equator_s.edi(trange=['1998-04-06', '1998-04-07'])
>>> print(edi_vars)
['V_ed_xyz_gse%eq_pp_edi', 'E_xyz_gse%eq_pp_edi']
>>> tplot(edi_vars)
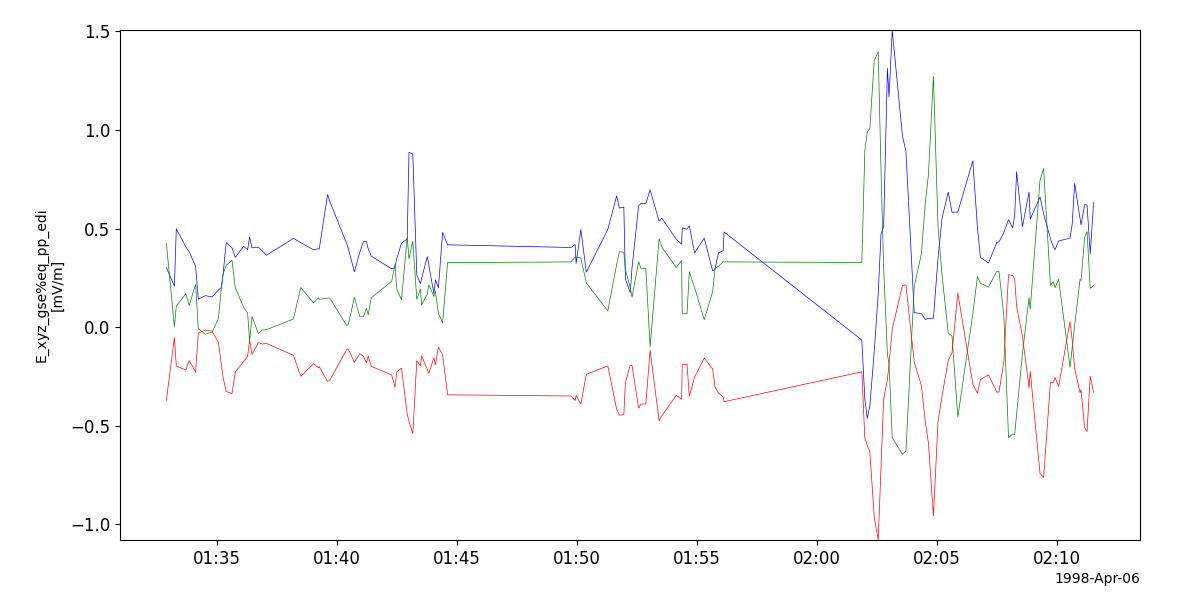
Example
import pyspedas
from pyspedas import tplot
edi_vars = pyspedas.projects.equator_s.edi(trange=['1998-04-06', '1998-04-07'])
tplot('E_xyz_gse%eq_pp_edi')
Solid state detector (EPI)
- pyspedas.projects.equator_s.epi(trange=['1998-04-06', '1998-04-07'], instrument='mam', datatype='pp', prefix='', suffix='', get_support_data=False, varformat=None, varnames=[], downloadonly=False, notplot=False, no_update=False, time_clip=False, force_download=False)
Load data from the Equator-S mission.
- Parameters:
trange (
listofstr, optional) – Time range of interest [starttime, endtime] with the format [‘YYYY-MM-DD’,’YYYY-MM-DD’] or to specify more or less than a day [‘YYYY-MM-DD/hh:mm:ss’,’YYYY-MM-DD/hh:mm:ss’]. Default is [‘1998-04-06’, ‘1998-04-07’].instrument (
str,listofstr, optional) – Type of instrument. Valid values: ‘aux’, ‘edi’, ‘epi’, ‘ici’, ‘mam’, ‘pcd’, ‘sfd’, ‘all’. Default is ‘mam’. If ‘all’ is specified, all instruments will be loaded.datatype (
str, optional) – Type of data. Default is ‘pp’. Valid values: – ‘pp’ for instruments: ‘aux’, ‘edi’, ‘epi’, ‘ici’, ‘mam’, ‘pcd’ – ‘sp’ for instruments: ‘sfd’, ‘edi’ Instrument ‘edi’ has both ‘pp’ and ‘sp’ data; for all other instruments, datatype is ignored.prefix (
str, optional) – The tplot variable names will be given this prefix. Default is ‘’.suffix (
str, optional) – The tplot variable names will be given this suffix. Default is ‘’.get_support_data (
bool, optional) – Data with an attribute “VAR_TYPE” with a value of “support_data” will be loaded into tplot. Default is False, only loads in data with a “VAR_TYPE” attribute of “data”.varformat (
str, optional) – The file variable formats to load into tplot. Wildcard character “*” is accepted. Default is None, all variables are loaded in.varnames (
listofstr, optional) – List of variable names to load. Default is [], all data variables are loaded.downloadonly (
bool, optional) – Set this flag to download the CDF files, but not load them into tplot variables. Default is False.notplot (
bool, optional) – Return the data in hash tables instead of creating tplot variables. Default is False.no_update (
bool, optional) – If set, only load data from your local cache. Default is False.time_clip (
bool, optional) – Time clip the variables to exactly the range specified in the trange keyword. Default is False.force_download (
bool, optional) – Download file even if local version is more recent than server version. Default is False.
- Returns:
List of tplot variables created. If downloadonly is set to True, returns a list of the downloaded files. If notplot is set to True, returns a dictionary of the data loaded.
- Return type:
listofstr/dictionary
Examples
>>> import pyspedas
>>> from pyspedas import tplot
>>> edi_vars = pyspedas.projects.equator_s.edi(trange=['1998-04-06', '1998-04-07'])
>>> print(edi_vars)
['V_ed_xyz_gse%eq_pp_edi', 'E_xyz_gse%eq_pp_edi']
>>> tplot(edi_vars)
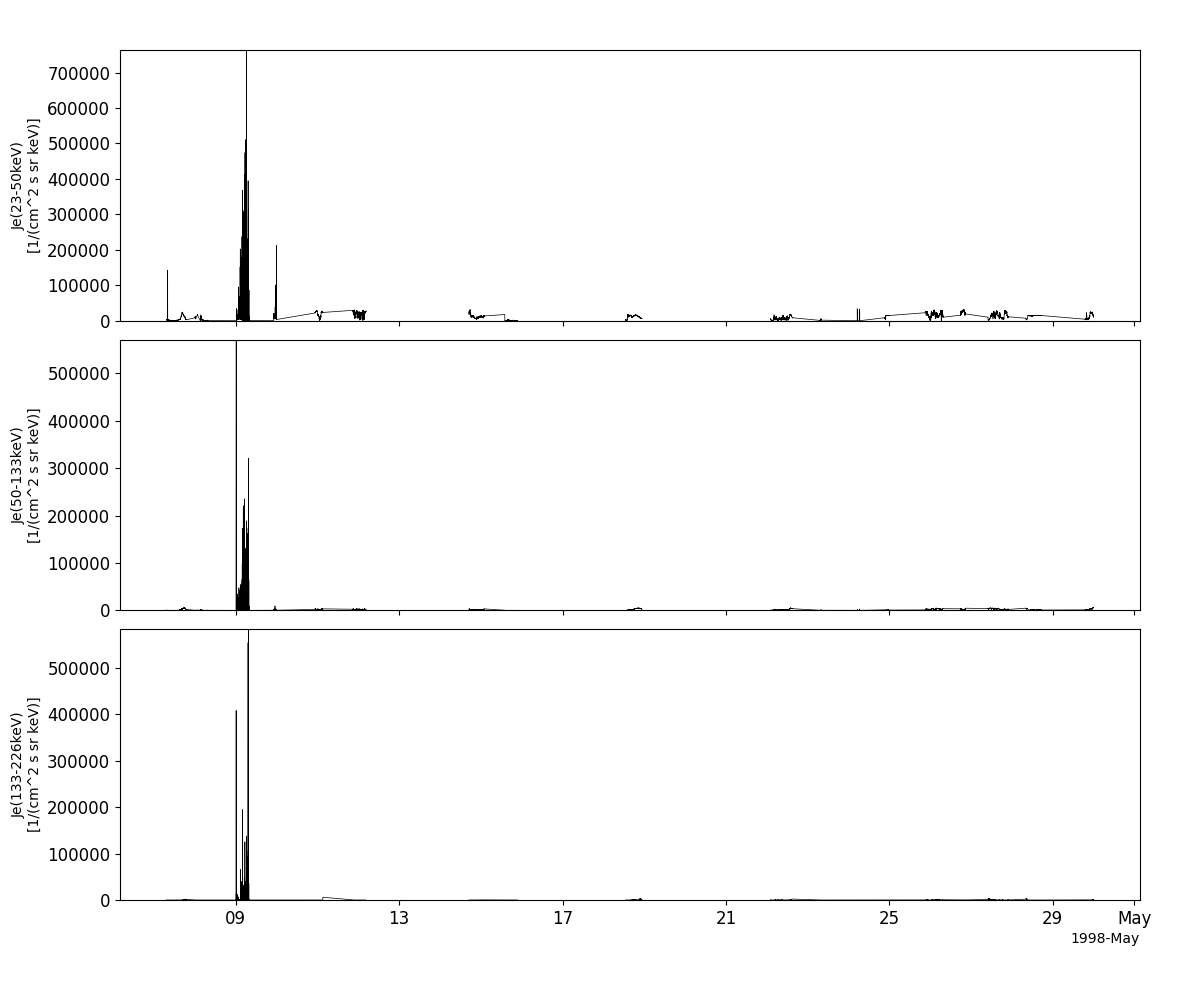
Example
import pyspedas
from pyspedas import tplot
epi_vars = pyspedas.projects.equator_s.epi(trange=['1998-04-06', '1998-04-30'])
tplot(['J_e_1%eq_pp_epi', 'J_e_2%eq_pp_epi', 'J_e_3%eq_pp_epi'])
Time-of-fight spectrometer (ICI)
- pyspedas.projects.equator_s.ici(trange=['1998-04-06', '1998-04-07'], instrument='mam', datatype='pp', prefix='', suffix='', get_support_data=False, varformat=None, varnames=[], downloadonly=False, notplot=False, no_update=False, time_clip=False, force_download=False)
Load data from the Equator-S mission.
- Parameters:
trange (
listofstr, optional) – Time range of interest [starttime, endtime] with the format [‘YYYY-MM-DD’,’YYYY-MM-DD’] or to specify more or less than a day [‘YYYY-MM-DD/hh:mm:ss’,’YYYY-MM-DD/hh:mm:ss’]. Default is [‘1998-04-06’, ‘1998-04-07’].instrument (
str,listofstr, optional) – Type of instrument. Valid values: ‘aux’, ‘edi’, ‘epi’, ‘ici’, ‘mam’, ‘pcd’, ‘sfd’, ‘all’. Default is ‘mam’. If ‘all’ is specified, all instruments will be loaded.datatype (
str, optional) – Type of data. Default is ‘pp’. Valid values: – ‘pp’ for instruments: ‘aux’, ‘edi’, ‘epi’, ‘ici’, ‘mam’, ‘pcd’ – ‘sp’ for instruments: ‘sfd’, ‘edi’ Instrument ‘edi’ has both ‘pp’ and ‘sp’ data; for all other instruments, datatype is ignored.prefix (
str, optional) – The tplot variable names will be given this prefix. Default is ‘’.suffix (
str, optional) – The tplot variable names will be given this suffix. Default is ‘’.get_support_data (
bool, optional) – Data with an attribute “VAR_TYPE” with a value of “support_data” will be loaded into tplot. Default is False, only loads in data with a “VAR_TYPE” attribute of “data”.varformat (
str, optional) – The file variable formats to load into tplot. Wildcard character “*” is accepted. Default is None, all variables are loaded in.varnames (
listofstr, optional) – List of variable names to load. Default is [], all data variables are loaded.downloadonly (
bool, optional) – Set this flag to download the CDF files, but not load them into tplot variables. Default is False.notplot (
bool, optional) – Return the data in hash tables instead of creating tplot variables. Default is False.no_update (
bool, optional) – If set, only load data from your local cache. Default is False.time_clip (
bool, optional) – Time clip the variables to exactly the range specified in the trange keyword. Default is False.force_download (
bool, optional) – Download file even if local version is more recent than server version. Default is False.
- Returns:
List of tplot variables created. If downloadonly is set to True, returns a list of the downloaded files. If notplot is set to True, returns a dictionary of the data loaded.
- Return type:
listofstr/dictionary
Examples
>>> import pyspedas
>>> from pyspedas import tplot
>>> edi_vars = pyspedas.projects.equator_s.edi(trange=['1998-04-06', '1998-04-07'])
>>> print(edi_vars)
['V_ed_xyz_gse%eq_pp_edi', 'E_xyz_gse%eq_pp_edi']
>>> tplot(edi_vars)
Example
import pyspedas
from pyspedas import tplot
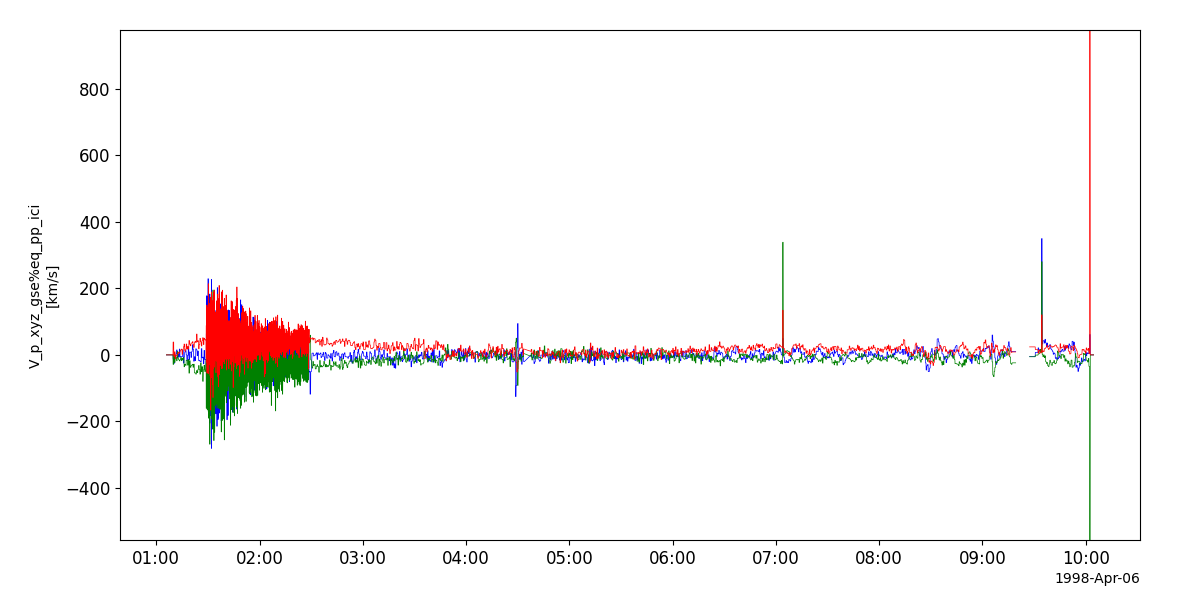
ici_vars = pyspedas.projects.equator_s.ici(trange=['1998-04-06', '1998-04-07'])
tplot('V_p_xyz_gse%eq_pp_ici')
Ion emitter (PCD)
- pyspedas.projects.equator_s.pcd(trange=['1998-04-06', '1998-04-07'], instrument='mam', datatype='pp', prefix='', suffix='', get_support_data=False, varformat=None, varnames=[], downloadonly=False, notplot=False, no_update=False, time_clip=False, force_download=False)
Load data from the Equator-S mission.
- Parameters:
trange (
listofstr, optional) – Time range of interest [starttime, endtime] with the format [‘YYYY-MM-DD’,’YYYY-MM-DD’] or to specify more or less than a day [‘YYYY-MM-DD/hh:mm:ss’,’YYYY-MM-DD/hh:mm:ss’]. Default is [‘1998-04-06’, ‘1998-04-07’].instrument (
str,listofstr, optional) – Type of instrument. Valid values: ‘aux’, ‘edi’, ‘epi’, ‘ici’, ‘mam’, ‘pcd’, ‘sfd’, ‘all’. Default is ‘mam’. If ‘all’ is specified, all instruments will be loaded.datatype (
str, optional) – Type of data. Default is ‘pp’. Valid values: – ‘pp’ for instruments: ‘aux’, ‘edi’, ‘epi’, ‘ici’, ‘mam’, ‘pcd’ – ‘sp’ for instruments: ‘sfd’, ‘edi’ Instrument ‘edi’ has both ‘pp’ and ‘sp’ data; for all other instruments, datatype is ignored.prefix (
str, optional) – The tplot variable names will be given this prefix. Default is ‘’.suffix (
str, optional) – The tplot variable names will be given this suffix. Default is ‘’.get_support_data (
bool, optional) – Data with an attribute “VAR_TYPE” with a value of “support_data” will be loaded into tplot. Default is False, only loads in data with a “VAR_TYPE” attribute of “data”.varformat (
str, optional) – The file variable formats to load into tplot. Wildcard character “*” is accepted. Default is None, all variables are loaded in.varnames (
listofstr, optional) – List of variable names to load. Default is [], all data variables are loaded.downloadonly (
bool, optional) – Set this flag to download the CDF files, but not load them into tplot variables. Default is False.notplot (
bool, optional) – Return the data in hash tables instead of creating tplot variables. Default is False.no_update (
bool, optional) – If set, only load data from your local cache. Default is False.time_clip (
bool, optional) – Time clip the variables to exactly the range specified in the trange keyword. Default is False.force_download (
bool, optional) – Download file even if local version is more recent than server version. Default is False.
- Returns:
List of tplot variables created. If downloadonly is set to True, returns a list of the downloaded files. If notplot is set to True, returns a dictionary of the data loaded.
- Return type:
listofstr/dictionary
Examples
>>> import pyspedas
>>> from pyspedas import tplot
>>> edi_vars = pyspedas.projects.equator_s.edi(trange=['1998-04-06', '1998-04-07'])
>>> print(edi_vars)
['V_ed_xyz_gse%eq_pp_edi', 'E_xyz_gse%eq_pp_edi']
>>> tplot(edi_vars)
Example
import pyspedas
from pyspedas import tplot
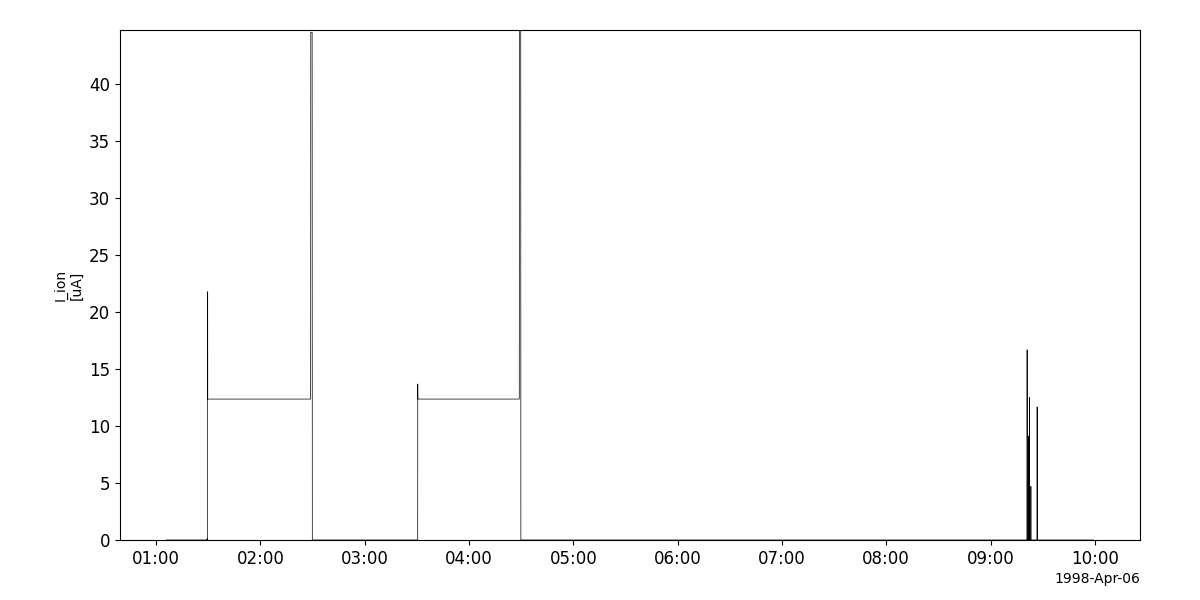
pcd_vars = pyspedas.projects.equator_s.pcd(trange=['1998-04-06', '1998-04-07'])
tplot('I_ion%eq_pp_pcd')
Scintillating fiber detector (SFD)
- pyspedas.projects.equator_s.sfd(trange=['1998-04-06', '1998-04-07'], instrument='mam', datatype='pp', prefix='', suffix='', get_support_data=False, varformat=None, varnames=[], downloadonly=False, notplot=False, no_update=False, time_clip=False, force_download=False)
Load data from the Equator-S mission.
- Parameters:
trange (
listofstr, optional) – Time range of interest [starttime, endtime] with the format [‘YYYY-MM-DD’,’YYYY-MM-DD’] or to specify more or less than a day [‘YYYY-MM-DD/hh:mm:ss’,’YYYY-MM-DD/hh:mm:ss’]. Default is [‘1998-04-06’, ‘1998-04-07’].instrument (
str,listofstr, optional) – Type of instrument. Valid values: ‘aux’, ‘edi’, ‘epi’, ‘ici’, ‘mam’, ‘pcd’, ‘sfd’, ‘all’. Default is ‘mam’. If ‘all’ is specified, all instruments will be loaded.datatype (
str, optional) – Type of data. Default is ‘pp’. Valid values: – ‘pp’ for instruments: ‘aux’, ‘edi’, ‘epi’, ‘ici’, ‘mam’, ‘pcd’ – ‘sp’ for instruments: ‘sfd’, ‘edi’ Instrument ‘edi’ has both ‘pp’ and ‘sp’ data; for all other instruments, datatype is ignored.prefix (
str, optional) – The tplot variable names will be given this prefix. Default is ‘’.suffix (
str, optional) – The tplot variable names will be given this suffix. Default is ‘’.get_support_data (
bool, optional) – Data with an attribute “VAR_TYPE” with a value of “support_data” will be loaded into tplot. Default is False, only loads in data with a “VAR_TYPE” attribute of “data”.varformat (
str, optional) – The file variable formats to load into tplot. Wildcard character “*” is accepted. Default is None, all variables are loaded in.varnames (
listofstr, optional) – List of variable names to load. Default is [], all data variables are loaded.downloadonly (
bool, optional) – Set this flag to download the CDF files, but not load them into tplot variables. Default is False.notplot (
bool, optional) – Return the data in hash tables instead of creating tplot variables. Default is False.no_update (
bool, optional) – If set, only load data from your local cache. Default is False.time_clip (
bool, optional) – Time clip the variables to exactly the range specified in the trange keyword. Default is False.force_download (
bool, optional) – Download file even if local version is more recent than server version. Default is False.
- Returns:
List of tplot variables created. If downloadonly is set to True, returns a list of the downloaded files. If notplot is set to True, returns a dictionary of the data loaded.
- Return type:
listofstr/dictionary
Examples
>>> import pyspedas
>>> from pyspedas import tplot
>>> edi_vars = pyspedas.projects.equator_s.edi(trange=['1998-04-06', '1998-04-07'])
>>> print(edi_vars)
['V_ed_xyz_gse%eq_pp_edi', 'E_xyz_gse%eq_pp_edi']
>>> tplot(edi_vars)
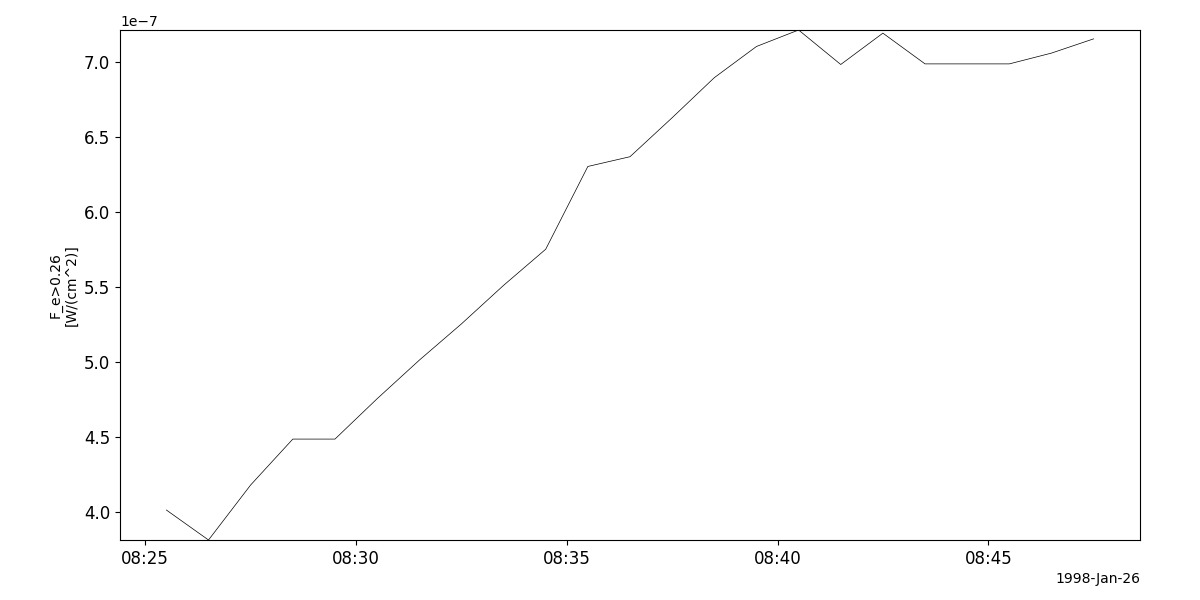
Example
import pyspedas
from pyspedas import tplot
sfd_vars = pyspedas.projects.equator_s.sfd()
tplot('F_e>0.26%eq_sp_sfd')