Magnetospheric Multiscale (MMS)
The routines in this module can be used to load data from the Magnetospheric Multiscale (MMS) mission.
Each of the MMS load routines has a short name, which is just the instrument name without the mms_load prefix.
Fluxgate Magnetometer (FGM)
Short name: pyspedas.projects.mms.fgm
- pyspedas.projects.mms.mms_load_fgm(trange=['2015-10-16', '2015-10-17'], probe='1', data_rate='srvy', level='l2', instrument='fgm', datatype='', varformat=None, exclude_format='*rdeltahalf*', varnames=[], suffix='', keep_flagged=False, get_support_data=True, time_clip=False, no_update=False, available=False, notplot=False, latest_version=False, major_version=False, min_version=None, cdf_version=None, spdf=False, always_prompt=False, no_split_vars=False, get_fgm_ephemeris=False)[source]
Load MMS fluxgate magnetometer data
- Parameters:
trange (
listofstr) – time range of interest [start time, end time] with the format ‘YYYY-MM-DD’,’YYYY-MM-DD’] or to specify more or less than a day [‘YYYY-MM-DD/hh:mm:ss’,’YYYY-MM-DD/hh:mm:ss’] Default: [‘2015-10-16’, ‘2015-10-17’]probe (
strorlistofstr) – list of probes, valid values for MMS probes are [‘1’,’2’,’3’,’4’]. Default: ‘1’data_rate (
strorlistofstr) – instrument data rates for FGM include ‘brst’ ‘fast’ ‘slow’ ‘srvy’. The default is ‘srvy’. Default: ‘srvy’level (
str) – indicates level of data processing. the default if no level is specified is ‘l2’ Default: ‘l2’datatype (
strorlistofstr) – Do not use: defined only for consistency with other load routines. All FGM data will be loaded. Default: ‘’get_support_data (
bool) – Data with an attribute “VAR_TYPE” with a value of “support_data” will be loaded into tplot. Default: Truetime_clip (
bool) – Data will be clipped to the exact trange specified by the trange keyword. Default: Falsevarformat (
str) – The file variable formats to load into tplot. Wildcard character “*” is accepted. Default: None (all variables are loaded)exclude_format (
str) – Variables matching this pattern will not be processed while loading the CDFs. Wildcard character “*” is allowed. Default: ‘rdeltahalf’varnames (
listofstr) – List of variable names to load. If list is empty or not specified, all data variables are loaded. Default: []suffix (
str) – The tplot variable names will be given this suffix. Default: Nonenotplot (
bool) – If True, then data are returned in a hash table instead of being stored in tplot variables (useful for debugging, and access to multidimensional data products) Default: Falseavailable (
bool) – If True, simply return the available data files (without downloading) for the requested parameters Default: Falseno_update (
bool) – Set this flag to preserve the original data. if not set and newer data is found the existing data will be overwritten Default: Falsecdf_version (
str) – Specify a specific CDF version # to load (e.g., cdf_version=’4.3.0’) Default: Nonemin_version (
str) – Specify a minimum CDF version # to load Default: Nonelatest_version (
bool) – Only grab the latest CDF version in the requested time interval Default: Falsemajor_version (
bool) – Only open the latest major CDF version (e.g., X in vX.Y.Z) in the requested time interval Default: Falsekeep_flagged (
bool) – If True, don’t remove flagged data (flagged data are set to NaNs by default, this keyword turns this off) Default: Falsealways_prompt (
bool) – Set this keyword to always prompt for the user’s username and password; useful if you accidentally save an incorrect password, or if your SDC password has changed Default: Falsespdf (
bool) – If True, download the data from the SPDF instead of the SDC Default: Falseget_fgm_ephemeris (
bool) – Keep the ephemeris variables in the FGM files Default: False
- Returns:
List of tplot variables created.
- Return type:
Example
>>> import pyspedas
>>> from pyspedas import tplot
>>> fgm_vars = pyspedas.projects.mms.mms_load_fgm(trange=['2015-10-16', '2015-10-17'])
>>> tplot('mms1_fgm_b_gsm_srvy_l2')
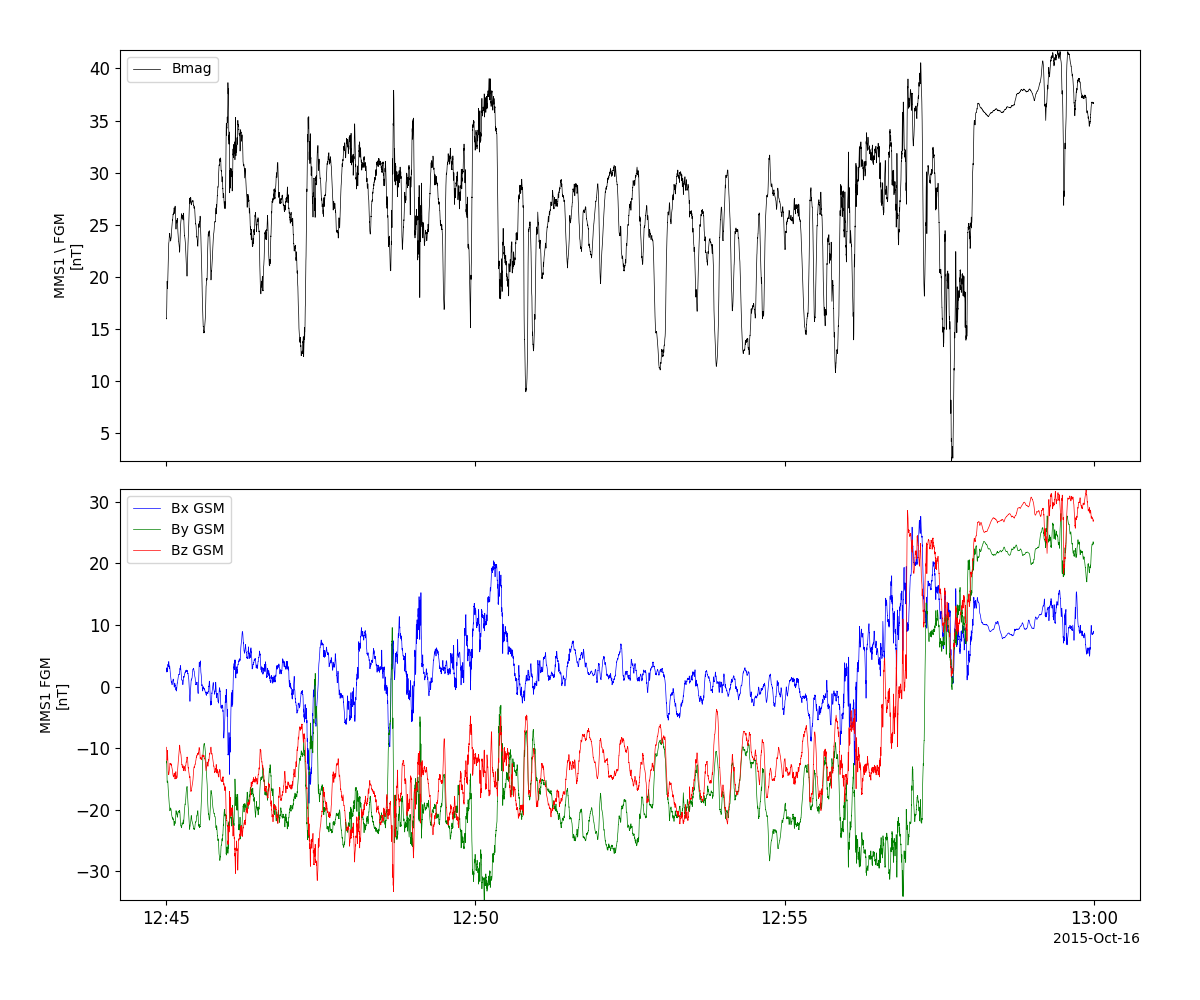
FGM Example
import pyspedas
from pyspedas import tplot
pyspedas.projects.mms.fgm(trange=['2015-10-16/12:45', '2015-10-16/13:00'], time_clip=True)
tplot(['mms1_fgm_b_gsm_srvy_l2_btot', 'mms1_fgm_b_gsm_srvy_l2_bvec'])
Search-coil Magnetometer (SCM)
Short name: pyspedas.projects.mms.scm
- pyspedas.projects.mms.mms_load_scm(trange=['2015-10-16', '2015-10-17'], probe='1', data_rate='srvy', level='l2', datatype='', varformat=None, varnames=[], suffix='', get_support_data=False, time_clip=True, no_update=False, available=False, notplot=False, latest_version=False, major_version=False, min_version=None, cdf_version=None, spdf=False, always_prompt=False)[source]
Load data from the MMS Search Coil Magnetometer (SCM)
- Parameters:
trange (
listofstr) – time range of interest [start time, end time] with the format ‘YYYY-MM-DD’,’YYYY-MM-DD’] or to specify more or less than a day [‘YYYY-MM-DD/hh:mm:ss’,’YYYY-MM-DD/hh:mm:ss’] Default: [‘2015-10-16’, ‘2015-10-17’]probe (
strorlistofstr) – list of probes, valid values for MMS probes are [‘1’,’2’,’3’,’4’]. Default: ‘1’data_rate (
strorlistofstr) – instrument data rates for SCM include [‘brst’ ‘fast’ ‘slow’ ‘srvy’]. Default: ‘srvy’level (
str) – indicates level of data processing. the default if no level is specified is ‘l2’ Default: ‘l2’datatype (
strorlistofstr) – Valid datatypes for SCM are: [‘scsrvy’, ‘cal’, ‘scb’, ‘scf’, ‘schb’, ‘scm’, ‘scs’] Default is ‘scsrvy’ for srvy data, and ‘scb’ for brst data.get_support_data (
bool) – Data with an attribute “VAR_TYPE” with a value of “support_data” will be loaded into tplot. By default, only loads in data with a “VAR_TYPE” attribute of “data”. Default: Falsetime_clip (
bool) – Data will be clipped to the exact trange specified by the trange keyword. Default: Truevarformat (
str) – The file variable formats to load into tplot. Wildcard character “*” is accepted. By default, all variables are loaded in. Default: None (all variables are loaded)varnames (
listofstr) – List of variable names to load. If list is empty or not specified, all data variables are loaded Default: [] (all variables are loaded)suffix (
str) – The tplot variable names will be given this suffix. Default: Nonenotplot (
bool) – If True, then data are returned in a hash table instead of being stored in tplot variables (useful for debugging, and access to multidimensional data products) Default: Falseavailable (
bool) – If True, simply return the available data files (without downloading) for the requested parameters Default: Falseno_update (
bool) – Set this flag to preserve the original data. if not set and newer data is found the existing data will be overwritten Default: Falsecdf_version (
str) – Specify a specific CDF version # to load (e.g., cdf_version=’4.3.0’) Default: Nonemin_version (
str) – Specify a minimum CDF version # to load Default: Nonelatest_version (
bool) – Only grab the latest CDF version in the requested time interval Default: Falsemajor_version (
bool) – Only open the latest major CDF version (e.g., X in vX.Y.Z) in the requested time interval Default: Falsealways_prompt (
bool) – Set this keyword to always prompt for the user’s username and password; useful if you accidentally save an incorrect password, or if your SDC password has changed Default: Falsespdf (
bool) – If True, download the data from the SPDF instead of the SDC
- Returns:
List of tplot variables created.
- Return type:
Example
>>> import pyspedas
>>> from pyspedas import tplot
>>> scm_vars = pyspedas.projects.mms.mms_load_scm(trange=['2015-10-16', '2015-10-17'])
>>> tplot('mms1_scm_acb_gse_scsrvy_srvy_l2')
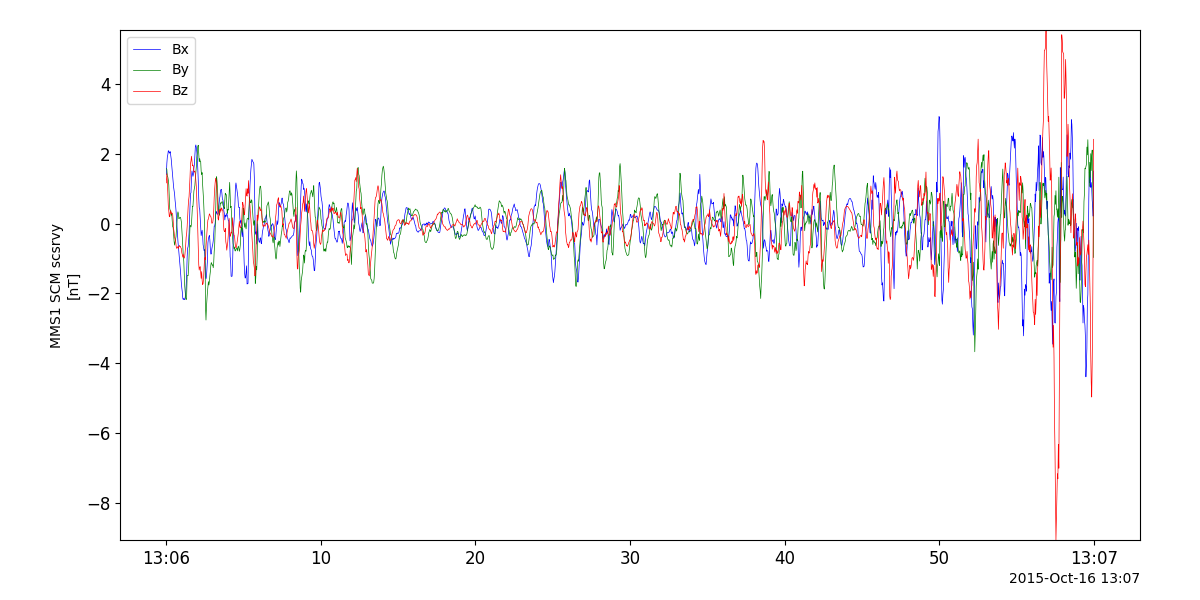
SCM Example
import pyspedas
from pyspedas import tplot
pyspedas.projects.mms.scm(trange=['2015-10-16/13:06', '2015-10-16/13:07'], time_clip=True)
tplot('mms1_scm_acb_gse_scsrvy_srvy_l2')
Level 3 FGM+SCM Data (FSM)
Short name: pyspedas.projects.mms.fsm
- pyspedas.projects.mms.mms_load_fsm(trange=['2015-10-16/05:59', '2015-10-16/06;01'], probe='1', data_rate='brst', level='l3', datatype='8khz', get_support_data=False, time_clip=False, no_update=False, available=False, varformat=None, varnames=[], notplot=False, suffix='', latest_version=False, major_version=False, min_version=None, cdf_version=None, spdf=False, always_prompt=False)[source]
This function loads MMS FSM (FGM + SCM) data into tplot variables
- Parameters:
trange (
listofstr) – time range of interest [start time, end time] with the format ‘YYYY-MM-DD’,’YYYY-MM-DD’] or to specify more or less than a day [‘YYYY-MM-DD/hh:mm:ss’,’YYYY-MM-DD/hh:mm:ss’] Default: [‘2015-10-16/05:59’, ‘2015-10-16/06:01’]probe (
strorlistofstr) – list of probes, valid values for MMS probes are [‘1’,’2’,’3’,’4’]. Default: ‘1’data_rate (
strorlistofstr) – Valid values: ‘brst’ Default: ‘brst’level (
str) – indicates level of data processing. Default: ‘l3’datatype (
strorlistofstr) – Valid datatype for FSM is: 8khz Default: ‘8khz’get_support_data (
bool) – Data with an attribute “VAR_TYPE” with a value of “support_data” will be loaded into tplot. By default, only loads in data with a “VAR_TYPE” attribute of “data”. Default: Falsetime_clip (
bool) – Data will be clipped to the exact trange specified by the trange keyword. Default: Falsevarformat (
str) – The file variable formats to load into tplot. Wildcard character “*” is accepted. By default, all variables are loaded in. Default: None (all variables are loaded)varnames (
listofstr) – List of variable names to load (if not specified, all data variables are loaded) Default: [] (all variables are loaded)suffix (
str) – The tplot variable names will be given this suffix. By default, no suffix is added. Default: Nonenotplot (
bool) – If True, then data are returned in a hash table instead of being stored in tplot variables (useful for debugging, and access to multidimensional data products) Default: Falseavailable (
bool) – If True, simply return the available data files (without downloading) for the requested parameters Default: Falseno_update (
bool) – Set this flag to preserve the original data. if not set and newer data is found the existing data will be overwritten Default: Falsecdf_version (
str) – Specify a specific CDF version # to load (e.g., cdf_version=’4.3.0’) Default: Nonemin_version (
str) – Specify a minimum CDF version # to load Default: Nonelatest_version (
bool) – Only grab the latest CDF version in the requested time interval Default: Falsemajor_version (
bool) – Only open the latest major CDF version (e.g., X in vX.Y.Z) in the requested time interval Default: Falsealways_prompt (
bool) – Set this keyword to always prompt for the user’s username and password; useful if you accidentally save an incorrect password, or if your SDC password has changed Default: Falsespdf (
bool) – If True, download the data from the SPDF instead of the SDC Default: False
- Returns:
List of tplot variables created.
- Return type:
Example
>>> import pyspedas
>>> from pyspedas import tplot
>>> fsm_data = pyspedas.projects.mms.mms_load_fsm(trange=['2015-10-16/05:59', '2015-10-16/06:01'])
>>> tplot(['mms1_fsm_b_mag_brst_l3','mms1_fsm_b_gse_brst_l3','mms1_fsm_r_gse_brst_l3'])
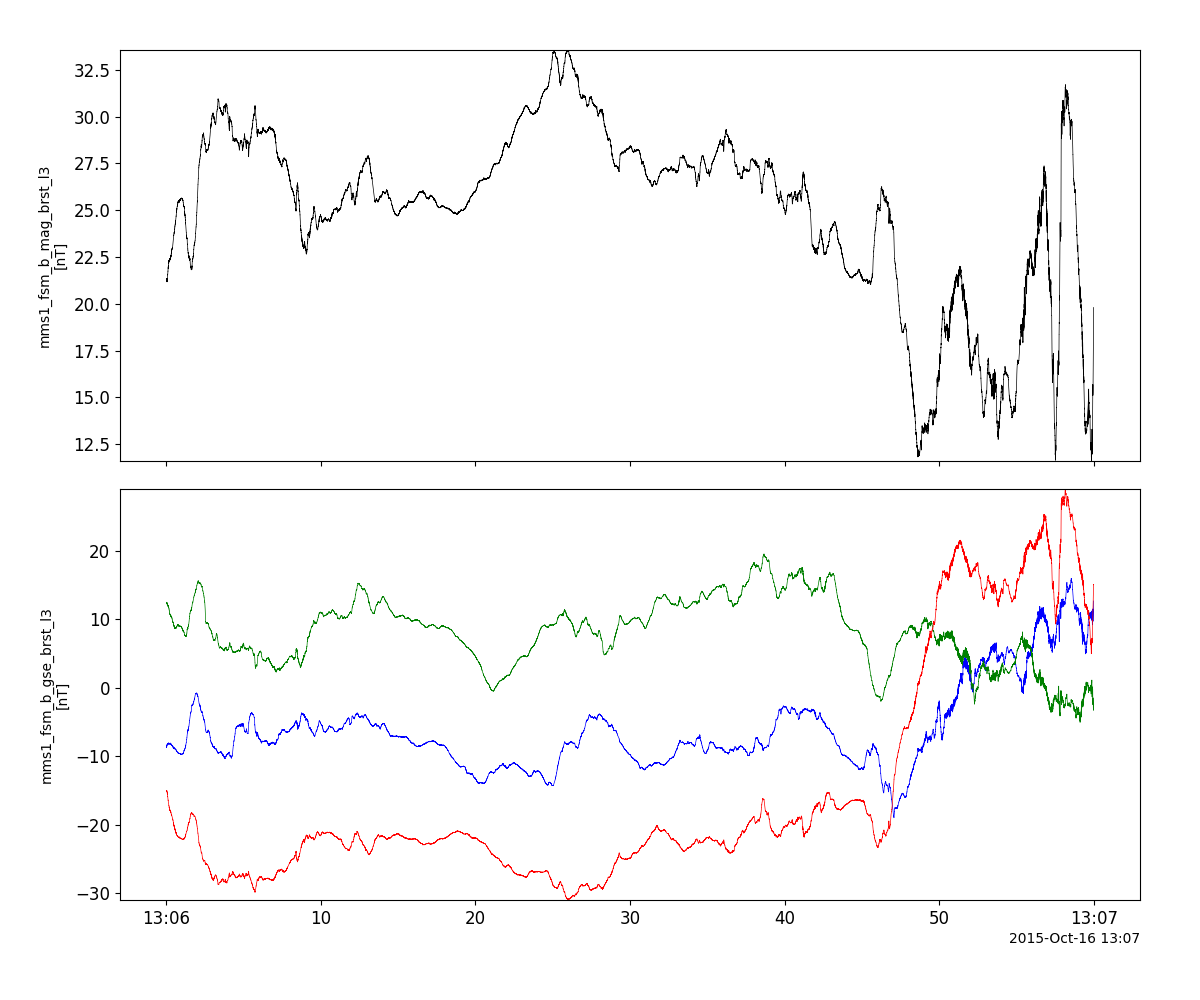
FSM Example
import pyspedas
from pyspedas import tplot
pyspedas.projects.mms.fsm(trange=['2015-10-16/13:06', '2015-10-16/13:07'], time_clip=True)
tplot(['mms1_fsm_b_mag_brst_l3', 'mms1_fsm_b_gse_brst_l3'])
Electric field Double Probe (EDP)
Short name: pyspedas.projects.mms.edp
- pyspedas.projects.mms.edp(trange=['2015-10-16', '2015-10-17'], probe='1', data_rate='fast', level='l2', datatype='dce', varformat=None, varnames=[], get_support_data=False, suffix='', time_clip=True, no_update=False, available=False, notplot=False, latest_version=False, major_version=False, min_version=None, cdf_version=None, spdf=False, always_prompt=False)
Load data from the MMS Electric field Double Probes (EDP) instrument
- Parameters:
trange (
listofstr) – time range of interest [start time, end time] with the format ‘YYYY-MM-DD’,’YYYY-MM-DD’] or to specify more or less than a day [‘YYYY-MM-DD/hh:mm:ss’,’YYYY-MM-DD/hh:mm:ss’] Default: [‘2015-10-16’, ‘2015-10-17’]probe (
strorlistofstr) – list of probes, valid values for MMS probes are [‘1’,’2’,’3’,’4’]. Default: ‘1’data_rate (
strorlistofstr) – instrument data rates for EDP include [‘brst’, ‘fast’, ‘slow’, ‘srvy’]. Default: ‘fast’level (
str) – indicates level of data processing. Default: ‘l2’datatype (
strorlistofstr) – Valid datatypes for EDP are: [‘dce’, ‘dcv’, ‘ace’, ‘hmfe’] Default: ‘dce’get_support_data (
bool) – Data with an attribute “VAR_TYPE” with a value of “support_data” will be loaded into tplot. By default, only loads in data with a “VAR_TYPE” attribute of “data”. Default: Falsetime_clip (
bool) – Data will be clipped to the exact trange specified by the trange keyword. Default: Falsevarformat (
str) – The file variable formats to load into tplot. Wildcard character “*” is accepted. Default: None (all variables are loaded)varnames (
listofstr) – List of variable names to load. If list is empty or not specified, all data variables are loaded) Default: []suffix (
str) – The tplot variable names will be given this suffix. By default, no suffix is added. Default: Nonenotplot (
bool) – If True, then data are returned in a hash table instead of being stored in tplot variables (useful for debugging, and access to multidimensional data products) Default: Falseavailable (
bool) – If True, simply return the available data files (without downloading) for the requested parameters Default: Falseno_update (
bool) – Set this flag to preserve the original data. if not set and newer data is found the existing data will be overwritten Default: Falsecdf_version (
str) – Specify a specific CDF version # to load (e.g., cdf_version=’4.3.0’) Default: Nonemin_version (
str) – Specify a minimum CDF version # to load Default: Nonelatest_version (
bool) – Only grab the latest CDF version in the requested time interval Default: Falsemajor_version (
bool) – Only open the latest major CDF version (e.g., X in vX.Y.Z) in the requested time interval Default: Falsealways_prompt (
bool) – Set this keyword to always prompt for the user’s username and password; useful if you accidentally save an incorrect password, or if your SDC password has changed Default: Falsespdf (
bool) – If True, download the data from the SPDF instead of the SDC Default: False
- Returns:
List of tplot variables created.
- Return type:
Example
>>> import pyspedas
>>> from pyspedas import tplot
>>> edp_vars = pyspedas.projects.mms.mms_load_edp(trange=['2015-10-16', '2015-10-17'], probe='1')
>>> tplot('mms1_edp_dce_gse_fast_l2')
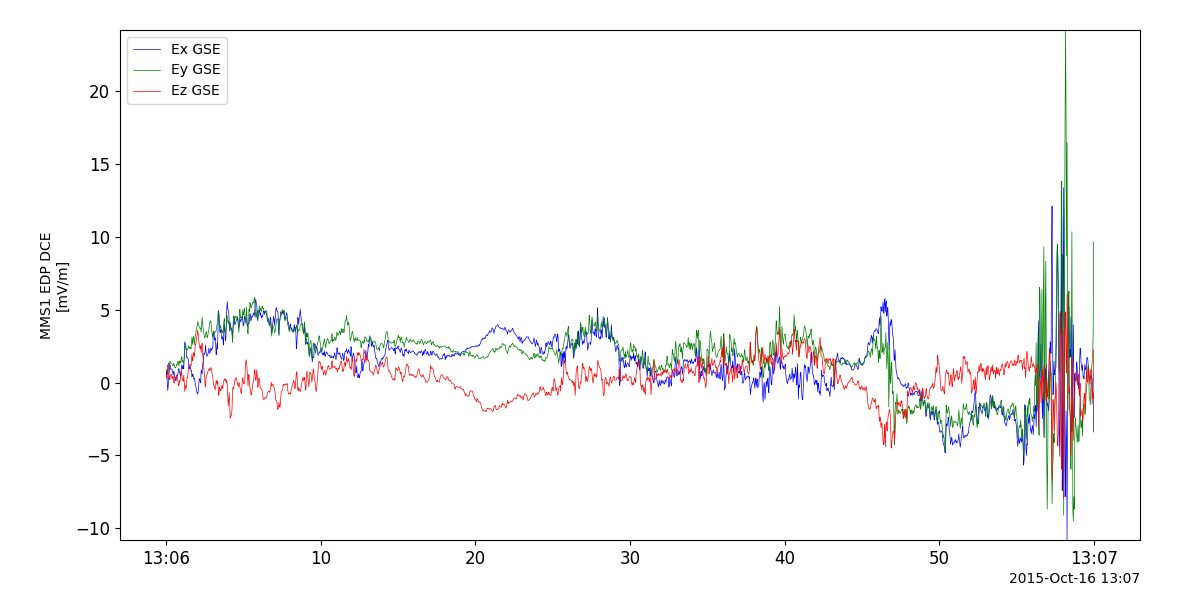
EDP Example
import pyspedas
from pyspedas import tplot
pyspedas.projects.mms.edp(trange=['2015-10-16/13:06', '2015-10-16/13:07'], time_clip=True)
tplot('mms1_edp_dce_gse_fast_l2')
Electron Drift Instrument (EDI)
Short name: pyspedas.projects.mms.edi
- pyspedas.projects.mms.mms_load_edi(trange=['2016-10-16', '2016-10-17'], probe='1', data_rate='srvy', level='l2', datatype='efield', varformat=None, varnames=[], get_support_data=False, suffix='', time_clip=False, no_update=False, available=False, notplot=False, latest_version=False, major_version=False, min_version=None, cdf_version=None, spdf=False, always_prompt=False)[source]
Load data from the MMS Electron Drift Instrument (EDI)
- Parameters:
trange (
listofstr) – time range of interest [start time, end time] with the format ‘YYYY-MM-DD’,’YYYY-MM-DD’] or to specify more or less than a day [‘YYYY-MM-DD/hh:mm:ss’,’YYYY-MM-DD/hh:mm:ss’] Default: [‘2015-10-16’, ‘2015-10-17’]probe (
strorlistofstr) – list of probes, valid values for MMS probes are [‘1’,’2’,’3’,’4’]. Default: ‘1’data_rate (
strorlistofstr) – instrument data rates for EDI include [‘brst’, ‘fast’, ‘slow’, ‘srvy’]. Default: ‘srvy’level (
str) – indicates level of data processing. Default: ‘l2’datatype (
strorlistofstr) – Valid datatypes for EDI are: [‘efield’, ‘amb’] Default: ‘efield’get_support_data (
bool) – Data with an attribute “VAR_TYPE” with a value of “support_data” will be loaded into tplot. Default: Falsetime_clip (
bool) – Data will be clipped to the exact trange specified by the trange keyword. Default: Falsevarformat (
str) – The file variable formats to load into tplot. Wildcard characters* and ?are accepted. Default: None (all variables are loaded)varnames (
listofstr) – List of variable names to load If list is empty or not specified, all data variables are loaded Default: []suffix (
str) – The tplot variable names will be given this suffix. Default: Nonenotplot (
bool) – If True, then data are returned in a hash table instead of being stored in tplot variables (useful for debugging, and access to multidimensional data products) Default: Falseavailable (
bool) – If True, simply return the available data files (without downloading) for the requested parameters Default: Falseno_update (
bool) – Set this flag to preserve the original data. if not set and newer data is found the existing data will be overwritten Default: Falsecdf_version (
str) – Specify a specific CDF version number to load (e.g., cdf_version=’4.3.0’) Default: Nonemin_version (
str) – Specify a minimum CDF version number to load Default: Nonelatest_version (
bool) – Only grab the latest CDF version in the requested time interval Default: Falsemajor_version (
bool) – Only open the latest major CDF version (e.g., X in vX.Y.Z) in the requested time interval Default: Falsealways_prompt (
bool) – Set this keyword to always prompt for the user’s username and password; useful if you accidentally save an incorrect password, or if your SDC password has changed Default: Falsespdf (
bool) – If True, download the data from the SPDF instead of the SDC Default: False
- Returns:
List of tplot variables created.
- Return type:
Example
>>> import pyspedas
>>> from pyspedas import tplot
>>> edi_vars = pyspedas.projects.mms.mms_load_edi(trange=['2016-10-16', '2016-10-17'], probe='1')
>>> tplot('mms1_edi_e_gse_srvy_l2')
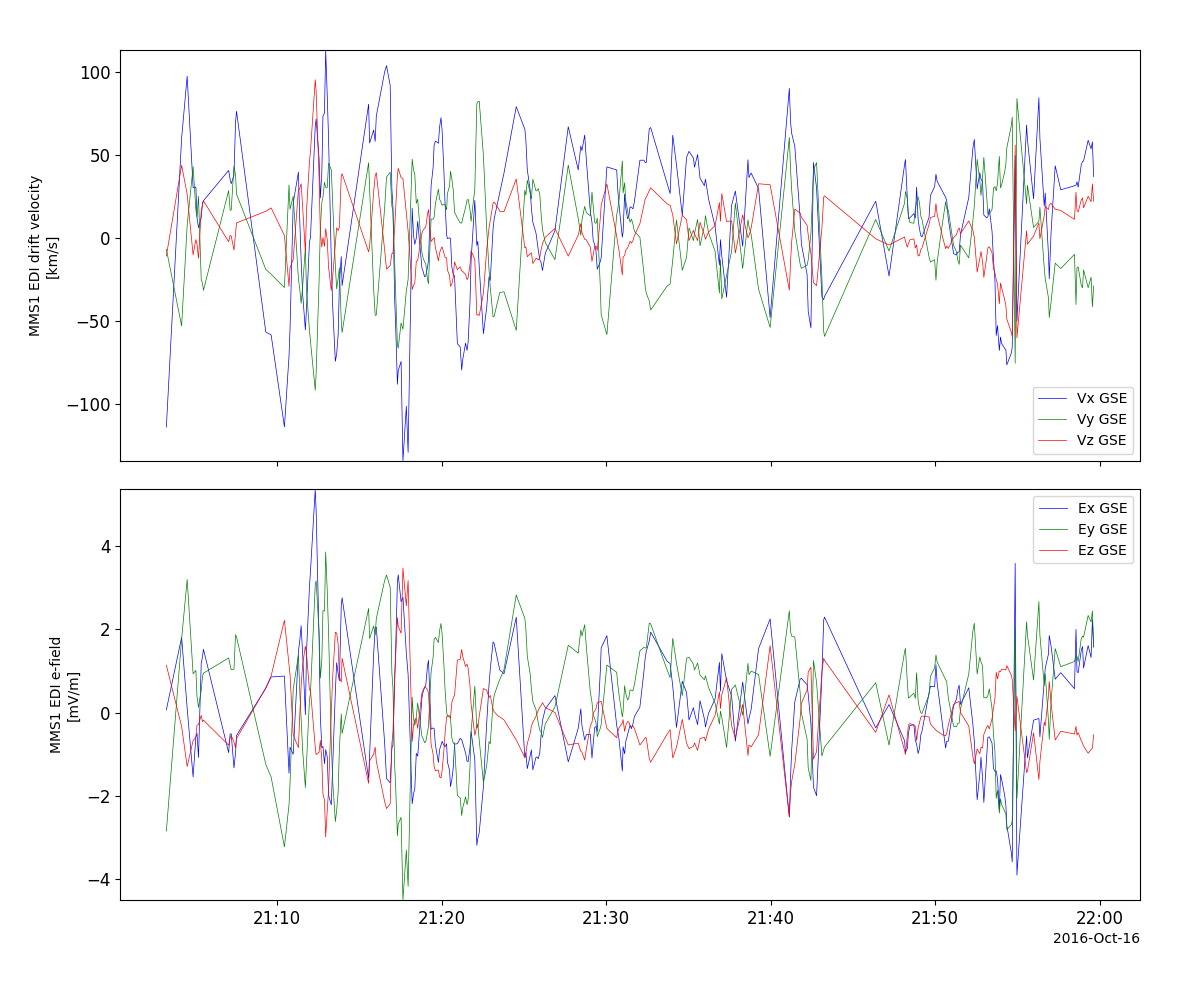
EDI Example
import pyspedas
from pyspedas import tplot
pyspedas.projects.mms.edi(trange=['2016-10-16/21:00', '2016-10-16/22:00'], time_clip=True)
tplot(['mms1_edi_vdrift_gse_srvy_l2', 'mms1_edi_e_gse_srvy_l2'])
Fly’s Eye Energetic Particle Sensor (FEEPS)
Short name: pyspedas.projects.mms.feeps
- pyspedas.projects.mms.mms_load_feeps(trange=['2015-10-16', '2015-10-17'], probe='1', data_rate='srvy', level='l2', datatype='electron', varformat=None, varnames=[], get_support_data=True, suffix='', time_clip=False, no_update=False, available=False, notplot=False, no_flatfield_corrections=False, data_units=['count_rate', 'intensity'], latest_version=False, major_version=False, min_version=None, cdf_version=None, spdf=False, always_prompt=False, filter_recvary_warnings=True, quality_flag=3, get_err=False)[source]
Load data from the MMS Fly’s Eye Energetic Particle Sensor (FEEPS)
- Parameters:
trange (
listofstr) – time range of interest [start time, end time] with the format ‘YYYY-MM-DD’,’YYYY-MM-DD’] or to specify more or less than a day [‘YYYY-MM-DD/hh:mm:ss’,’YYYY-MM-DD/hh:mm:ss’] Default: [‘2015-10-16’,’2015-10-17’]probe (
strorlistofstr) – list of probes, valid values for MMS probes are [‘1’,’2’,’3’,’4’]. Default: ‘1’data_rate (
strorlistofstr) – instrument data rates for FEEPS include [‘brst’, ‘srvy’]. Default: ‘srvy’level (
str) – indicates level of data processing. the default if no level is specified is ‘l2’ Default: ‘l2’datatype (
strorlistofstr) –Valid datatypes for FEEPS are:
L2, L1b: ['electron', 'ion']
L1a: ['electron-bottom', 'electron-top', 'ion-bottom', 'ion-top']
Default: ‘electron’
data_units (
strorlistofstr) – Unit types to be loaded, options are ‘count_rate’, ‘intensity’ Default: [‘count_rate’, ‘intensity’]no_flatfield_corrections (
bool) – If True, no flatfield corrections are performed. Default: Falseget_support_data (
bool) – Data with an attribute “VAR_TYPE” with a value of “support_data” will be loaded into tplot. Default: Truetime_clip (
bool) – Data will be clipped to the exact trange specified by the trange keyword. Default: Falsevarformat (
str) – The file variable formats to load into tplot. Wildcard character “*” is accepted. Default: None (all variables are loaded)varnames (
listofstr) – List of variable names to load. If list is empty or not specified, all data variables are loaded. Default: []suffix (
str) – The tplot variable names will be given this suffix. By default, no suffix is added. Default: Nonenotplot (
bool) – If True, then data are returned in a hash table instead of being stored in tplot variables (useful for debugging, and access to multidimensional data products) Default: Falseavailable (
bool) – If True, simply return the available data files (without downloading) for the requested parameters Default: Falseno_update (
bool) – Set this flag to preserve the original data. if not set and newer data is found the existing data will be overwritten Default: Falsecdf_version (
str) – Specify a specific CDF version # to load (e.g., cdf_version=’4.3.0’) Default: Nonemin_version (
str) – Specify a minimum CDF version # to load Default: Nonelatest_version (
bool) – Only grab the latest CDF version in the requested time intervalmajor_version (
bool) – Only open the latest major CDF version (e.g., X in vX.Y.Z) in the requested time intervalalways_prompt (
bool) – Set this keyword to always prompt for the user’s username and password; useful if you accidentally save an incorrect password, or if your SDC password has changedspdf (
bool) – If True, download the data from the SPDF instead of the SDCfilter_recvary_warnings (
bool) – If True, capture warnings from cdf_to_tplot and filter out the ones complaining about non-record-varying support data with timestampsquality_flag (
int) – Value can range from 2-4. Determines which eyes to use to calculate omnidirectional flux at a given time based on how many sectors were masked for sunlight. For BRST or RAW:Green (Quality Indicator = 0): No contaminated or masked spin sectors (best data quality) Red (Quality Indicator = 3): Contaminated spin sector is associated with BURST and RAW data (this data is not recommended for scientific use) Grey (Quality Indicator = 4): FEEPS calibration data (this data is generated by the instrument itself and is not recommended for scientific use)
For data in SURVEY mode, there are 5 possible quality indicators:
Green (Quality Indicator = 0): No contaminated or masked spin sectors (best data quality)
Yellow (Quality Indicator = 1): Among the spin sectors used to create a SURVEY aggregate
     spin sector, onboard masking is successfully applied to a minimum of 1 and a maximum of 7
     spin sectors and there is no contamination in any of the individual spin sectors. Note that
     since this indicator applies only when onboard masking is applied, some sectors are not
     observed.
Orange (Quality Indicator = 2): There is contamination of between 0 and 50% of the notmasked sectors. Warning: this data contains contamination.
Red (Quality Indicator = 3): Same as orange except that there is contamination of 50% or
     more of the not-masked sectors. IN ADDITION, this indicator applies to the case where
     onboard masking is applied to all 8 spin sectors in the aggregate sector.
Grey (Quality Indicator = 4): FEEPS calibration data (this data is generated by the instrument
     itself and is not recommended for scientific use)
get_err (
bool) – Gets the error in the omnidirectional l2 intensity. Default: False. User MUST run mms_load_feeps for the l1b counts data FIRST to use this function. (Note: the FEEPS l1b data needed for this switch is restricted to MMS team members at present.)
- Returns:
List of tplot variables created.
- Return type:
Example
>>> import pyspedas
>>> from pyspedas import tplot
>>> feeps_data = pyspedas.projects.mms.mms_load_feeps(trange=['2015-10-16', '2015-10-17'], probe='1', datatype='electron')
>>> tplot(['mms1_epd_feeps_srvy_l2_electron_intensity_omni_spin', 'mms1_epd_feeps_srvy_l2_electron_intensity_omni'])
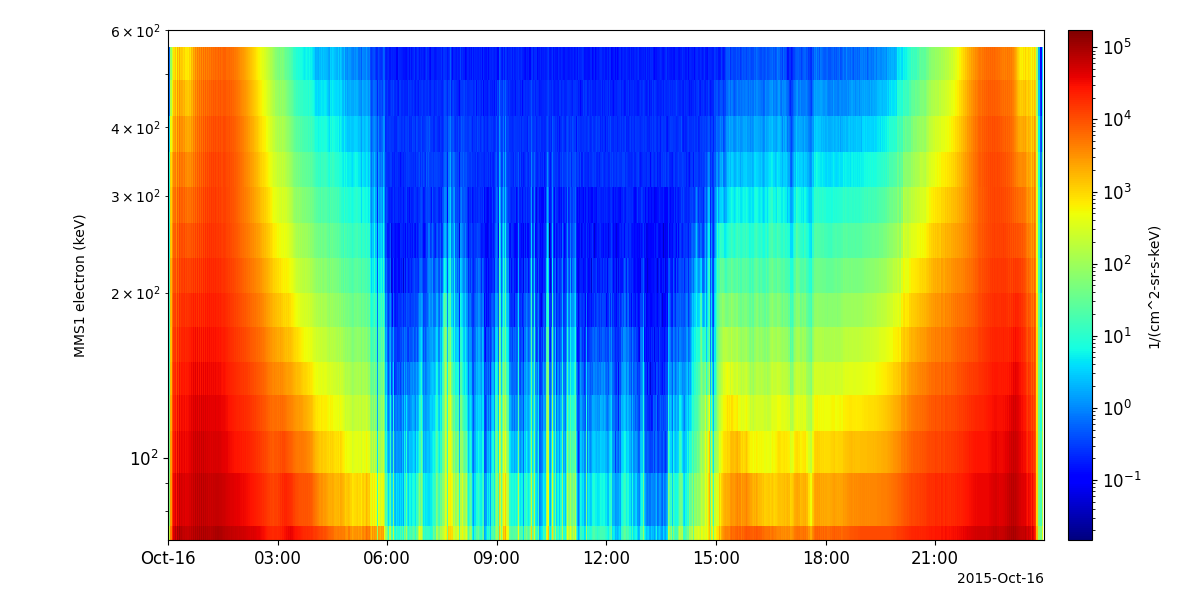
FEEPS Example
import pyspedas
from pyspedas import tplot
pyspedas.projects.mms.feeps(trange=['2015-10-16', '2015-10-17'])
tplot('mms1_epd_feeps_srvy_l2_electron_intensity_omni_spin')
Energetic Ion Spectrometer (EIS)
Short name: pyspedas.projects.mms.eis
- pyspedas.projects.mms.mms_load_eis(trange=['2015-10-16', '2015-10-17'], probe='1', data_rate='srvy', level='l2', datatype='extof', varformat=None, varnames=[], get_support_data=True, suffix='', time_clip=False, no_update=False, available=False, notplot=False, latest_version=False, major_version=False, min_version=None, cdf_version=None, spdf=False, always_prompt=False)[source]
Load data from the MMS Energetic Ion Spectrometer (EIS)
- Parameters:
trange (
listofstr) – time range of interest [start time, end time] with the format ‘YYYY-MM-DD’,’YYYY-MM-DD’] or to specify more or less than a day [‘YYYY-MM-DD/hh:mm:ss’,’YYYY-MM-DD/hh:mm:ss’] Default: [‘2015-10-16’, ‘2015-10-17’]probe (
strorlistofstr) – list of probes, valid values for MMS probes are [‘1’,’2’,’3’,’4’]. Default: ‘1’data_rate (
strorlistofstr) – instrument data rates for EIS include [‘brst’, ‘srvy’]. Default: ‘srvy’level (
str) – indicates level of data processing. Default: ‘l2’datatype (
strorlistofstr) – Valid datatypes for EIS are: [‘extof’, ‘phxtof’, and ‘electronenergy’] Default: ‘extof’get_support_data (
bool) – Data with an attribute “VAR_TYPE” with a value of “support_data” will be loaded into tplot. Default: ‘True’time_clip (
bool) – Data will be clipped to the exact trange specified by the trange keyword. Default: ‘False’varformat (
str) – The file variable formats to load into tplot. Wildcard character “*” is accepted. Default: None (all variables are loaded)varnames (
listofstr) – List of variable names to load. If list is empty or not specified, all data variables are loaded. Default: []suffix (
str) – The tplot variable names will be given this suffix. Default: Nonenotplot (
bool) – If True, then data are returned in a hash table instead of being stored in tplot variables (useful for debugging, and access to multidimensional data products) Default: Falseavailable (
bool) – If True, simply return the available data files (without downloading) for the requested parameters Default: Falseno_update (
bool) – Set this flag to preserve the original data. if not set and newer data is found the existing data will be overwritten Default: Falsecdf_version (
str) – Specify a specific CDF version # to load (e.g., cdf_version=’4.3.0’) Default: Nonemin_version (
str) – Specify a minimum CDF version # to load Default: Nonelatest_version (
bool) – Only grab the latest CDF version in the requested time interval Default: Falsemajor_version (
bool) – Only open the latest major CDF version (e.g., X in vX.Y.Z) in the requested time interval Default: Falsealways_prompt (
bool) – Set this keyword to always prompt for the user’s username and password; useful if you accidentally save an incorrect password, or if your SDC password has changed Default: Falsespdf (
bool) – If True, download the data from the SPDF instead of the SDC Default: False
- Returns:
List of tplot variables created.
- Return type:
Example
>>> import pyspedas
>>> from pyspedas import tplot
>>> eis_vars = pyspedas.projects.mms.mms_load_eis(trange=['2015-10-16', '2015-10-17'], probe='1', datatype=['phxtof', 'extof'])
>>> # plot the non-spin averaged flux
>>> tplot(['mms1_epd_eis_srvy_l2_extof_proton_flux_omni', 'mms1_epd_eis_srvy_l2_phxtof_proton_flux_omni'])
>>> # plot the spin averaged flux
>>> tplot(['mms1_epd_eis_srvy_l2_extof_proton_flux_omni_spin', 'mms1_epd_eis_srvy_l2_phxtof_proton_flux_omni_spin'])
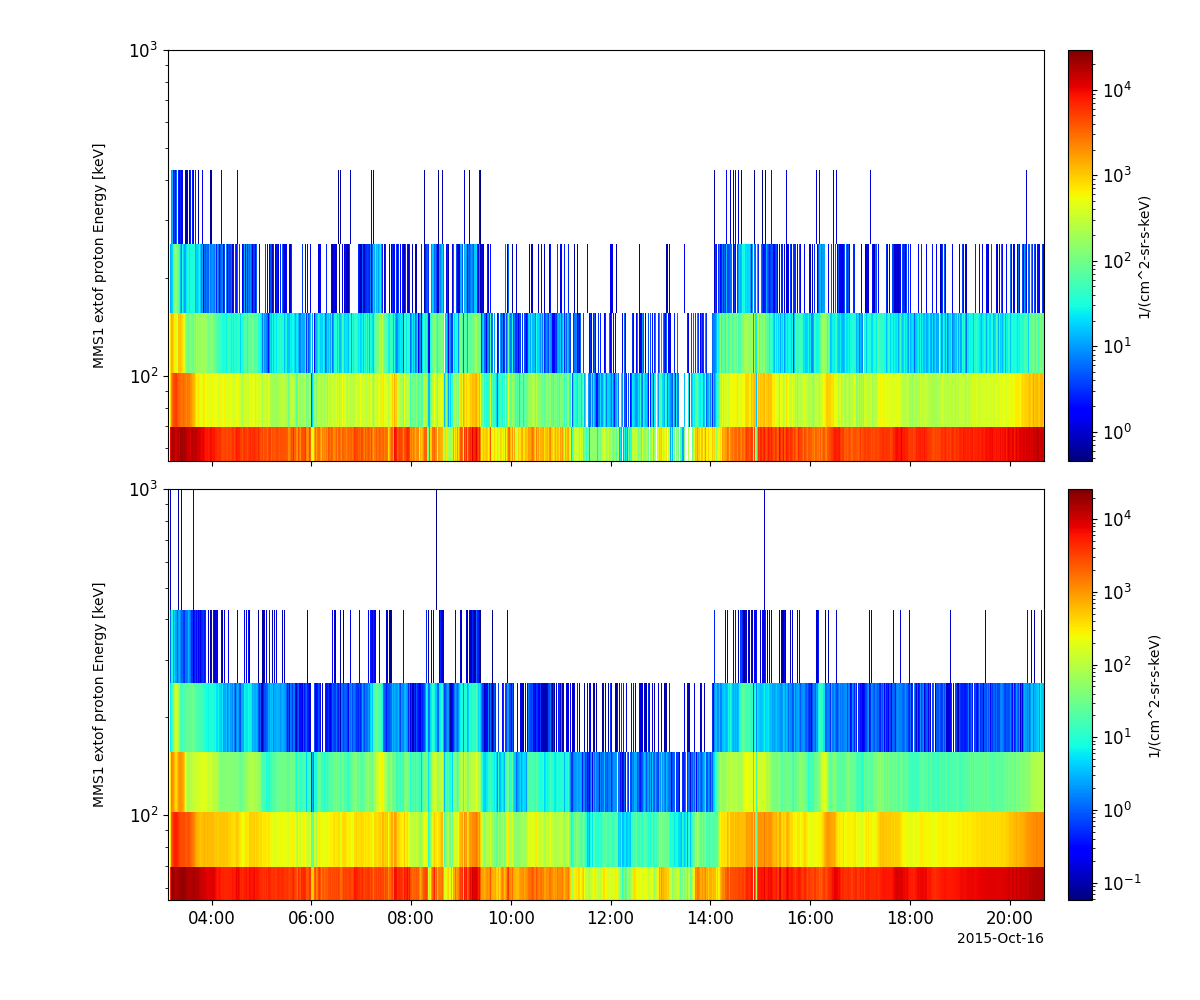
EIS Example
import pyspedas
from pyspedas import tplot
pyspedas.projects.mms.eis(trange=['2015-10-16', '2015-10-17'])
tplot(['mms1_epd_eis_srvy_l2_extof_proton_flux_omni', 'mms1_epd_eis_srvy_l2_extof_proton_flux_omni_spin'])
Active Spacecraft Potential Control (ASPOC)
Short name: pyspedas.projects.mms.aspoc
- pyspedas.projects.mms.mms_load_aspoc(trange=['2015-10-16', '2015-10-17'], probe='1', data_rate='srvy', level='l2', datatype='', varformat=None, varnames=[], get_support_data=False, suffix='', time_clip=False, no_update=False, available=False, notplot=False, latest_version=False, major_version=False, min_version=None, cdf_version=None, spdf=False, always_prompt=False)[source]
Load data from the MMS Active Spacecraft Potential Control (ASPOC)
- Parameters:
trange (
listofstr) – time range of interest [start time, end time] with the format ‘YYYY-MM-DD’,’YYYY-MM-DD’] or to specify more or less than a day [‘YYYY-MM-DD/hh:mm:ss’,’YYYY-MM-DD/hh:mm:ss’] Default: [‘2015-10-16’, ‘2015-10-17’]probe (
strorlistofstr) – list of probes, valid values for MMS probes are [‘1’,’2’,’3’,’4’]. Default: 1data_rate (
strorlistofstr) – instrument data rates for ASPOC include ‘srvy’, ‘sitl’. Default: ‘srvy’.level (
str) – indicates level of data processing. Default: ‘l2’datatype (
strorlistofstr) – Do not use: defined only for consistency with other load routines. All ASPOC data will be loaded.get_support_data (
bool) – Data with an attribute “VAR_TYPE” with a value of “support_data” will be loaded into tplot. Default: Falsetime_clip (
bool) – Data will be clipped to the exact trange specified by the trange keyword. Default: Falsevarformat (
str) – The file variable formats to load into tplot. Wildcard character “*” is accepted. Default: None (all variables are loaded in)varnames (
listofstr) – List of variable names to load. If list is empty or unspecified, all data variables are loaded. Default: empty list (all data variables are loaded)suffix (
str) – The tplot variable names will be given this suffix. Default: Nonenotplot (
bool) – If True, then data are returned in a hash table instead of being stored in tplot variables (useful for debugging, and access to multidimensional data products) Default: Falseavailable (
bool) – If True, simply return the available data files (without downloading) for the requested parameters Default: Falseno_update (
bool) – Set this flag to preserve the original data. if not set and newer data is found the existing data will be overwritten Default: Falsecdf_version (
str) – Specify a specific CDF version # to load (e.g., cdf_version=’4.3.0’) Default: Nonemin_version (
str) – Specify a minimum CDF version # to load Default: Nonelatest_version (
bool) – Only grab the latest CDF version in the requested time interval Default: Falsemajor_version (
bool) – Only open the latest major CDF version (e.g., X in vX.Y.Z) in the requested time interval Default: Falsealways_prompt (
bool) – Set this keyword to always prompt for the user’s username and password; useful if you accidentally save an incorrect password, or if your SDC password has changed Default: Falsespdf (
bool) – If True, download the data from the SPDF instead of the SDC Default: False
- Returns:
List of tplot variables created.
- Return type:
Examples
>>> import pyspedas
>>> from pyspedas import tplot
>>> asp_data = pyspedas.projects.mms.mms_load_aspoc(trange=['2015-10-16', '2015-10-17'], probe='1')
>>> tplot('mms1_aspoc_ionc_l2')
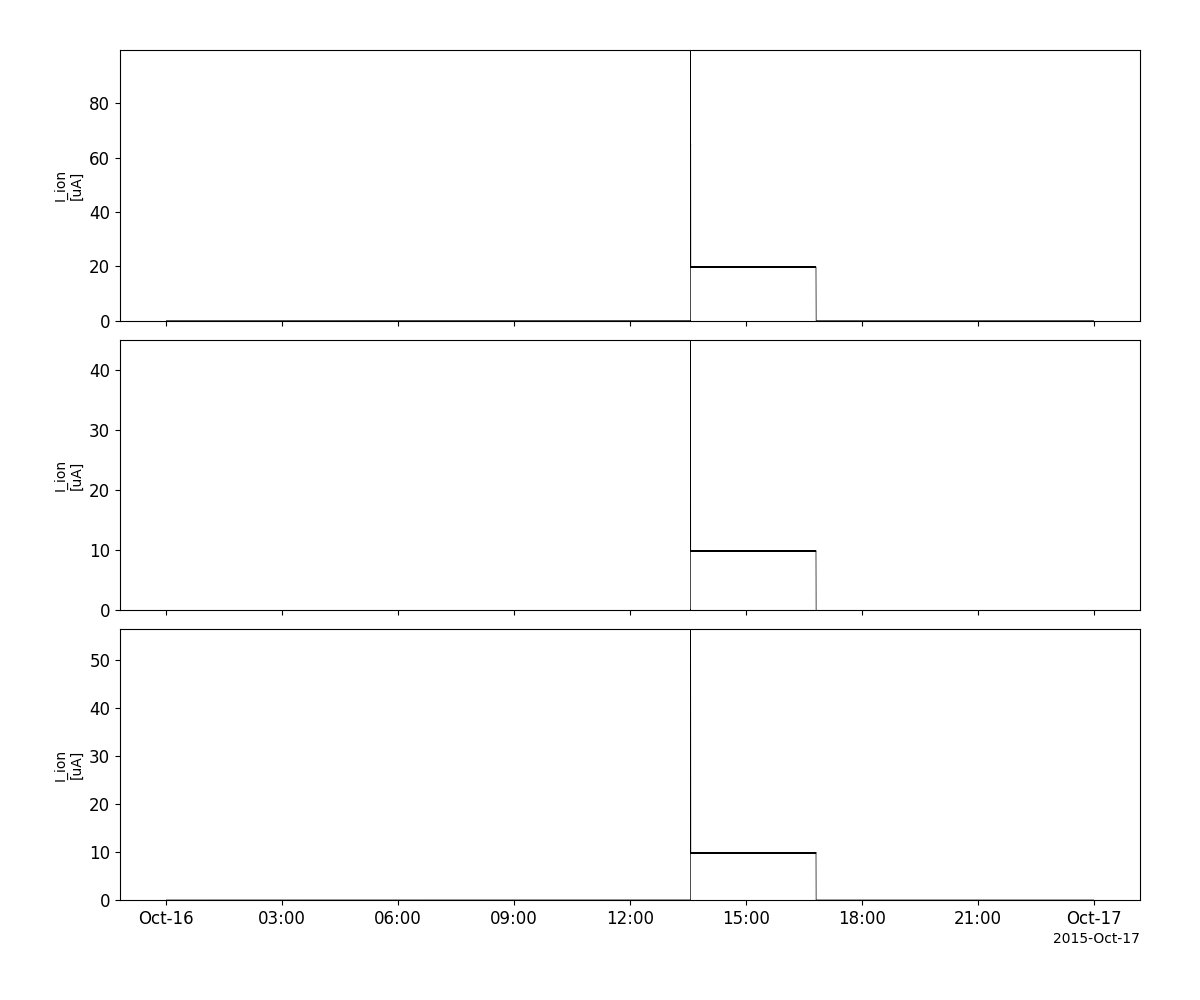
ASPOC Example
import pyspedas
from pyspedas import tplot
pyspedas.projects.mms.aspoc(trange=['2015-10-16', '2015-10-17'])
tplot(['mms1_aspoc_ionc_l2', 'mms1_asp1_ionc_l2', 'mms1_asp2_ionc_l2'])
Fast Plasma Investigation (FPI)
Short name: pyspedas.projects.mms.fpi
- pyspedas.projects.mms.mms_load_fpi(trange=['2015-10-16', '2015-10-17'], probe='1', data_rate='fast', level='l2', datatype='*', varformat=None, varnames=[], suffix='', get_support_data=False, time_clip=False, no_update=False, center_measurement=False, available=False, notplot=False, latest_version=False, major_version=False, min_version=None, cdf_version=None, spdf=False, always_prompt=False)[source]
Load data from the MMS Fast Plasma Investigation (FPI)
- Parameters:
trange (
listofstr) – time range of interest [start time, end time] with the format ‘YYYY-MM-DD’,’YYYY-MM-DD’] or to specify more or less than a day [‘YYYY-MM-DD/hh:mm:ss’,’YYYY-MM-DD/hh:mm:ss’] Default: [‘2015-10-16’, ‘2015-10-17’]probe (
strorlistofstr) – list of probes, valid values for MMS probes are [‘1’,’2’,’3’,’4’]. Default: ‘1’data_rate (
strorlistofstr) – instrument data rates for FPI include ‘brst’, ‘fast’. Default: ‘fast’level (
str) – indicates level of data processing. Valid options: ‘l2’, ‘ql’ Default: ‘l2’datatype (
strorlistofstr) –- Valid datatypes for FPI are:
‘des-moms’, ‘dis-moms’, ‘des-momsaux’, ‘dis-momsaux’, ‘des-partmoms’, ‘dis-partmoms’, ‘des-dist’, ‘dis-dist’, ‘des’, ‘dis’ Defaults: [‘des-moms’, ‘dis-moms’, ‘des-dist’ , ‘dis-dist’, ‘des-momsaux’, ‘dis-momsaux’] (for level != ‘ql’ or unspecified) [‘des’, ‘dis’] (for level == ‘ql’)
get_support_data (
bool) – Data with an attribute “VAR_TYPE” with a value of “support_data” will be loaded into tplot. Default: Falsetime_clip (
bool) – Data will be clipped to the exact trange specified by the trange keyword. Default: Falsevarformat (
str) – The file variable formats to load into tplot. Wildcard character “*” is accepted. Default: None (All variables are loaded)varnames (
listofstr) – List of variable names to load. If list is empty or not specified, all data variables are loaded Default: [] (all variables are loaded)suffix (
str) – The tplot variable names will be given this suffix. Default: Nonecenter_measurement (
bool) – If True, the CDF epoch variables are time-shifted to the middle of the accumulation interval by their DELTA_PLUS_VAR and DELTA_MINUS_VAR variable attributes Default: Falsenotplot (
bool) – If True, then data are returned in a hash table instead of being stored in tplot variables (useful for debugging, and access to multidimensional data products) Default: Falseavailable (
bool) – If True, simply return the available data files (without downloading) for the requested parameters Default: Falseno_update (
bool) – Set this flag to preserve the original data. if not set and newer data is found the existing data will be overwritten Default: Falsecdf_version (
str) – Specify a specific CDF version # to load (e.g., cdf_version=’4.3.0’) Default: Nonemin_version (
str) – Specify a minimum CDF version # to load Default: Nonelatest_version (
bool) – Only grab the latest CDF version in the requested time interval Default: Falsemajor_version (
bool) – Only open the latest major CDF version (e.g., X in vX.Y.Z) in the requested time interval Default: Falsealways_prompt (
bool) – Set this keyword to always prompt for the user’s username and password; useful if you accidentally save an incorrect password, or if your SDC password has changed Default: Falsespdf (
bool) – If True, download the data from the SPDF instead of the SDC Default: False
- Returns:
List of tplot variables created.
- Return type:
Example
>>> import pyspedas
>>> from pyspedas import tplot
>>> fpi_vars = pyspedas.projects.mms.mms_load_fpi(trange=['2015-10-16', '2015-10-17'], datatype='dis-moms')
>>> tplot(['mms1_dis_bulkv_gse_fast', 'mms1_dis_numberdensity_fast'])
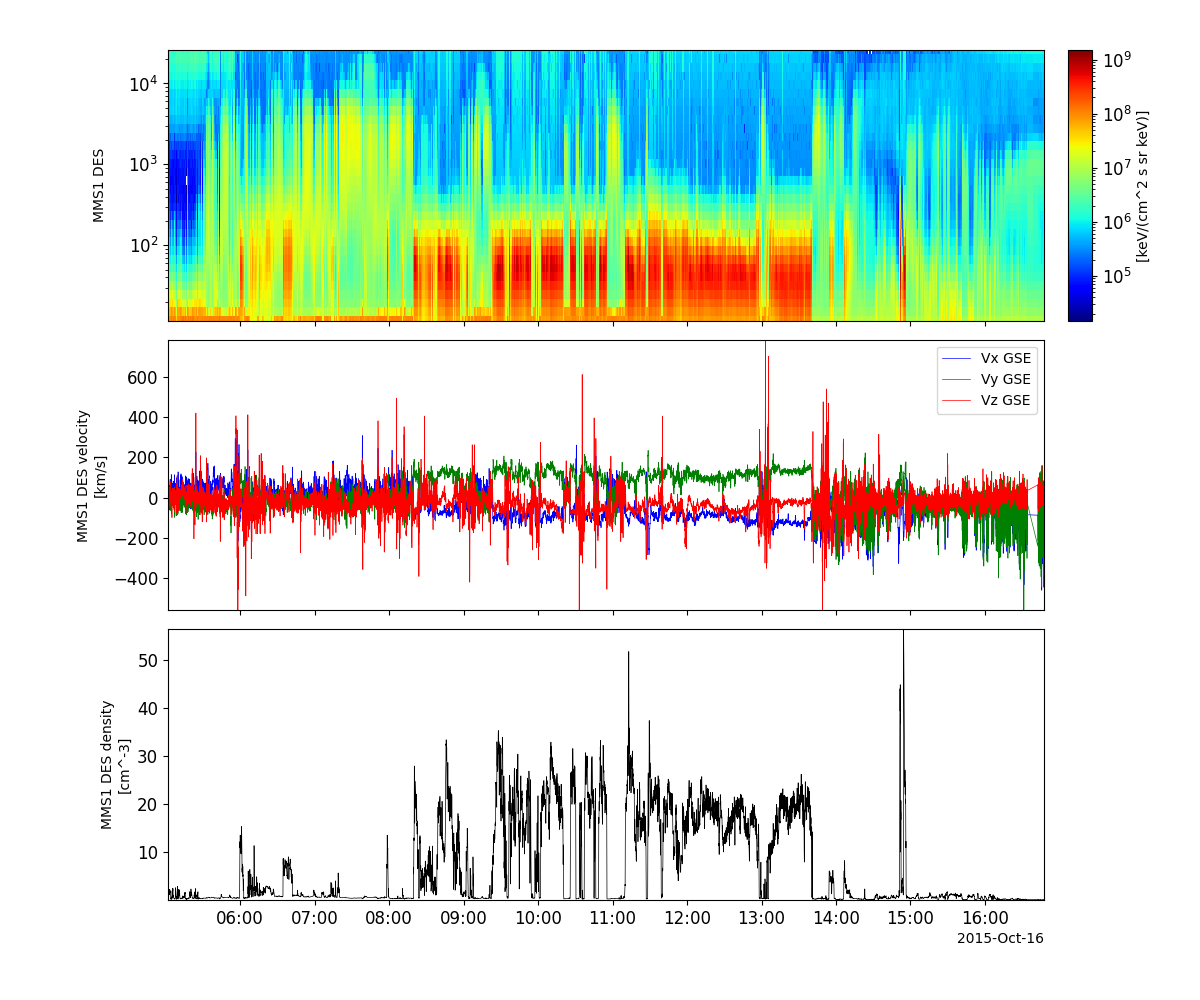
FPI Example
import pyspedas
from pyspedas import tplot
pyspedas.projects.mms.fpi(trange=['2015-10-16', '2015-10-17'], datatype='des-moms')
tplot(['mms1_des_energyspectr_omni_fast', 'mms1_des_bulkv_gse_fast', 'mms1_des_numberdensity_fast'])
Hot Plasma Composition Analyzer (HPCA)
Short name: pyspedas.projects.mms.hpca
- pyspedas.projects.mms.mms_load_hpca(trange=['2015-10-16', '2015-10-17'], probe='1', data_rate='srvy', level='l2', datatype='moments', get_support_data=True, time_clip=False, no_update=False, varformat=None, varnames=[], suffix='', center_measurement=False, available=False, notplot=False, latest_version=False, major_version=False, min_version=None, cdf_version=None, spdf=False, always_prompt=False)[source]
Load data from the MMS Hot Plasma Composition Analyzer (HPCA)
- Parameters:
trange (
listofstr) – time range of interest [start time, end time] with the format ‘YYYY-MM-DD’,’YYYY-MM-DD’] or to specify more or less than a day [‘YYYY-MM-DD/hh:mm:ss’,’YYYY-MM-DD/hh:mm:ss’] Default: [‘2015-10-16’, ‘2015-10-17’]probe (
strorlistofstr) – list of probes, valid values for MMS probes are [‘1’,’2’,’3’,’4’]. Default: ‘1’data_rate (
strorlistofstr) – instrument data rates for HPCA include ‘brst’, ‘srvy’. Default: ‘srvy’level (
str) – indicates level of data processing Default: ‘l2’datatype (
strorlistofstr) – Valid datatypes for HPCA are ‘moments’ and ‘ion’ Default: ‘moments’get_support_data (
bool) – Data with an attribute “VAR_TYPE” with a value of “support_data” will be loaded into tplot. Default: Truevarformat (
str) – The file variable formats to load into tplot. Wildcard character “*” is accepted. Default: None (all variables are loaded)varnames (
listofstr) – List of variable names to load. If list is empty or not specified, all data variables are loaded) Default: [] (all variables are loaded)time_clip (
bool) – Data will be clipped to the exact trange specified by the trange keyword. Default: Falsesuffix (
str) – The tplot variable names will be given this suffix. Default: Nonecenter_measurement (
bool) – If True, the CDF epoch variables are time-shifted to the middle of the accumulation interval by their DELTA_PLUS_VAR and DELTA_MINUS_VAR variable attributes Default: Falsenotplot (
bool) – If True, then data are returned in a hash table instead of being stored in tplot variables (useful for debugging, and access to multidimensional data products) Default: Falseavailable (
bool) – If True, simply return the available data files (without downloading) for the requested parameters Default: Falseno_update (
bool) – Set this flag to preserve the original data. if not set and newer data is found the existing data will be overwritten Default: Falsecdf_version (
str) – Specify a specific CDF version # to load (e.g., cdf_version=’4.3.0’) Default: Nonemin_version (
str) – Specify a minimum CDF version # to load Default: Nonelatest_version (
bool) – Only grab the latest CDF version in the requested time interval Default: Falsemajor_version (
bool) – Only open the latest major CDF version (e.g., X in vX.Y.Z) in the requested time interval Default: Falsealways_prompt (
bool) – Set this keyword to always prompt for the user’s username and password; useful if you accidentally save an incorrect password, or if your SDC password has changed Default: Falsespdf (
bool) – If True, download the data from the SPDF instead of the SDC Default: False
- Returns:
List of tplot variables created.
- Return type:
Example
>>> import pyspedas
>>> from pyspedas import tplot
>>> mom_vars = pyspedas.projects.mms.mms_load_hpca(trange=['2015-10-16', '2015-10-17'], datatype='moments')
>>> tplot(['mms1_hpca_hplus_number_density', 'mms1_hpca_hplus_ion_bulk_velocity'])
>>> # load the ion data (support data, fluxes, phase space densities, all ion data samples are n x m arrays
>>> ion_vars = pyspedas.projects.mms.mms_load_hpca(trange=['2016-10-16', '2016-10-17'], datatype='ion')
Short name: pyspedas.projects.mms.hpca
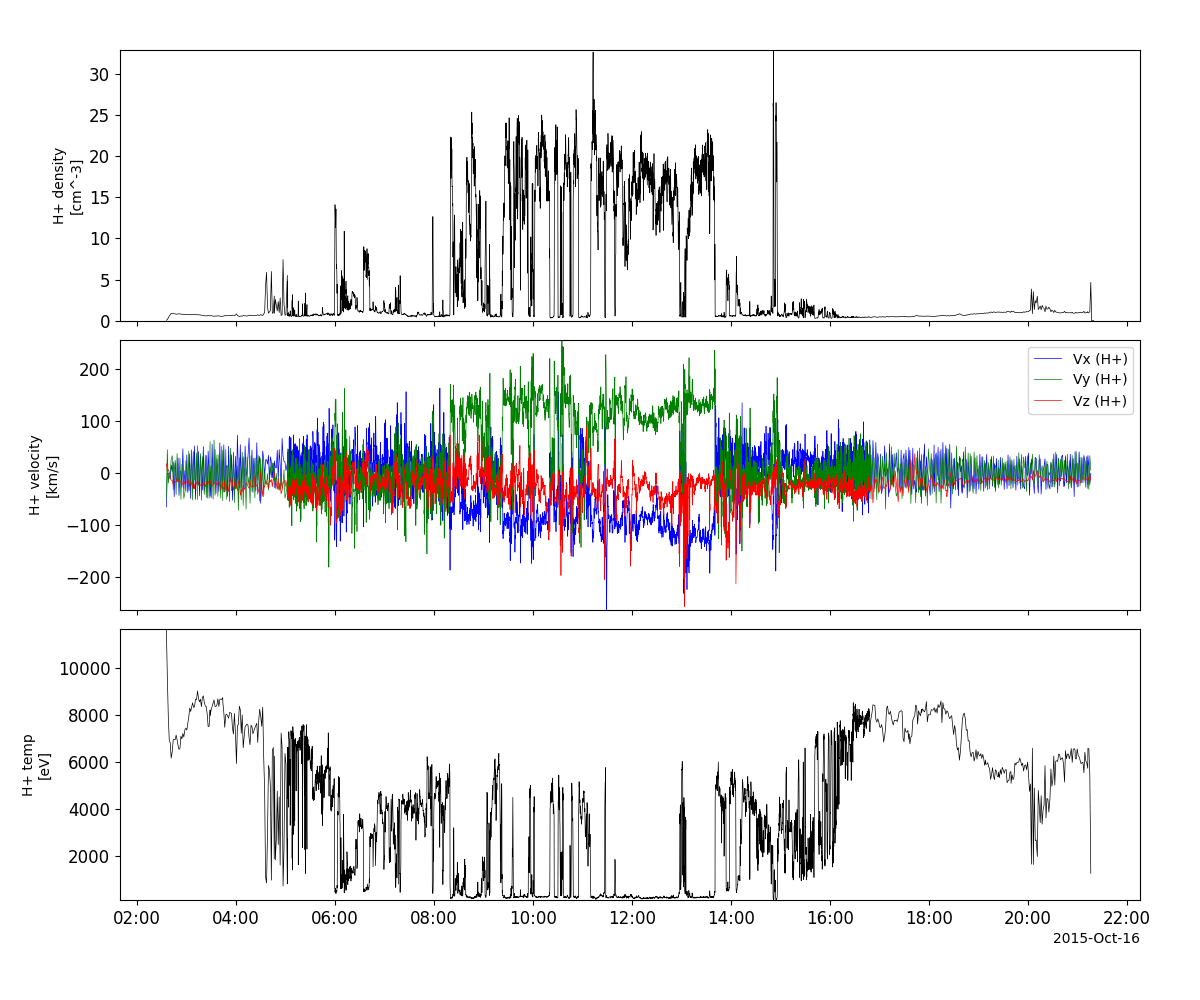
HPCA Example
import pyspedas
from pyspedas import tplot
pyspedas.projects.mms.hpca(trange=['2015-10-16', '2015-10-17'], datatype='moments')
tplot(['mms1_hpca_hplus_number_density', 'mms1_hpca_hplus_ion_bulk_velocity', 'mms1_hpca_hplus_scalar_temperature'])
Mission Ephemeris Coordinates (MEC)
Short name: pyspedas.projects.mms.mec
- pyspedas.projects.mms.mms_load_mec(trange=['2015-10-16', '2015-10-17'], probe='1', data_rate='srvy', level='l2', datatype='epht89q', varformat=None, varnames=[], suffix='', get_support_data=False, time_clip=False, no_update=False, available=False, notplot=False, latest_version=False, major_version=False, min_version=None, cdf_version=None, spdf=False, always_prompt=False)[source]
Load the attitude/ephemeris data from the MMS MEC (Mission Ephemeris and Coordinates) files
- Parameters:
trange (
listofstr) – time range of interest [start time, end time] with the format ‘YYYY-MM-DD’,’YYYY-MM-DD’] or to specify more or less than a day [‘YYYY-MM-DD/hh:mm:ss’,’YYYY-MM-DD/hh:mm:ss’] Default: [‘2015-10-16’, ‘2015-10-17’]probe (
strorlistofstr) – list of probes, valid values for MMS probes are [‘1’,’2’,’3’,’4’]. Default: ‘1’data_rate (
strorlistofstr) – instrument data rates for MEC include [‘brst’, ‘srvy’]. Default: ‘srvy’level (
str) – indicates level of data processing. Default: ‘l2’datatype (
strorlistofstr) – Valid datatypes for MEC are: [‘ephts04d’, ‘epht89q’, ‘epht89d’] Default: ‘epht89q’get_support_data (
bool) – Data with an attribute “VAR_TYPE” with a value of “support_data” will be loaded into tplot. Default: Falsetime_clip (
bool) – Data will be clipped to the exact trange specified by the trange keyword. Default: Falsevarformat (
str) – The file variable formats to load into tplot. Wildcard character “*” is accepted. Default: None (all variables are loaded)varnames (
listofstr) – List of variable names to load. If list is empyt or not specified, all data variables are loaded) Default: [] (all variables are loaded)suffix (
str) – The tplot variable names will be given this suffix. Default: Nonenotplot (
bool) – If True, then data are returned in a hash table instead of being stored in tplot variables (useful for debugging, and access to multidimensional data products) Default: Falseavailable (
bool) – If True, simply return the available data files (without downloading) for the requested parameters Default: Falseno_update (
bool) – Set this flag to preserve the original data. if not set and newer data is found the existing data will be overwritten Default: Falsecdf_version (
str) – Specify a specific CDF version # to load (e.g., cdf_version=’4.3.0’) Default: Nonemin_version (
str) – Specify a minimum CDF version # to load Default: Nonelatest_version (
bool) – Only grab the latest CDF version in the requested time interval Default: Falsemajor_version (
bool) – Only open the latest major CDF version (e.g., X in vX.Y.Z) in the requested time interval Default: Falsealways_prompt (
bool) – Set this keyword to always prompt for the user’s username and password; useful if you accidentally save an incorrect password, or if your SDC password has changed Default: Falsespdf (
bool) – If True, download the data from the SPDF instead of the SDC Default: False
Notes
The default datatype was changed to ‘epht89q’ on 15Nov2021. There are sometimes issues with creating the Tsyganenko 04 data products, which leads to the ‘epht04d’ files not being available. The ‘epht89d’ files contain the same ephemeris data - the only difference are the data products that rely on the field model.
Example
>>> import pyspedas
>>> from pyspedas import tplot
>>> mec_data = pyspedas.projects.mms.mms_load_mec(trange=['2015-10-16', '2015-10-17'], probe='1')
>>> tplot(['mms1_mec_r_gsm', 'mms1_mec_v_gsm'])
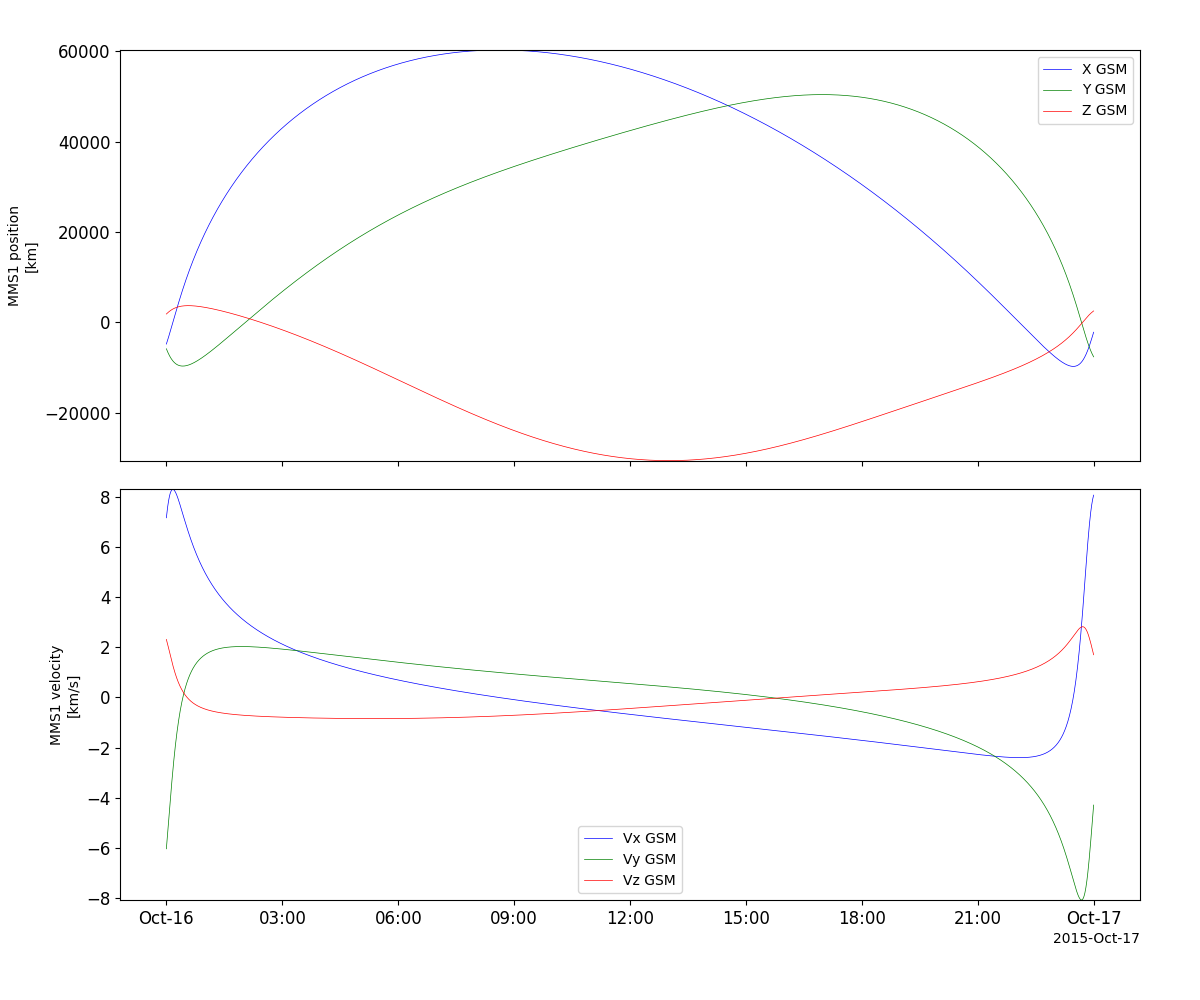
MEC Example
import pyspedas
from pyspedas import tplot
pyspedas.projects.mms.mec(trange=['2015-10-16', '2015-10-17'])
tplot(['mms1_mec_r_gsm', 'mms1_mec_v_gsm'])
Attitude and Ephemeris (STATE)
Short name: pyspedas.projects.mms.state
- pyspedas.projects.mms.mms_load_state(trange=['2015-10-16', '2015-10-17'], probe='1', level='def', datatypes=['pos', 'vel'], no_update=False, pred_or_def=True, suffix='')[source]
This function loads the state (ephemeris and attitude) data from the ASCII files into tplot variables
- Parameters:
trange (
listofstr) – time range of interest [start time, end time] with the format ‘YYYY-MM-DD’,’YYYY-MM-DD’] or to specify more or less than a day [‘YYYY-MM-DD/hh:mm:ss’,’YYYY-MM-DD/hh:mm:ss’] Default: [‘2015-10-16’, ‘2015-10-17’]probe (
strorlistofstr) – list of probes, valid values for MMS probes are [‘1’,’2’,’3’,’4’]. Default: ‘1’level (
str) – indicates level of data (options: ‘def’ (definitive), ‘pred’ (predicted) Default: ‘def’datatypes (
strorlistofstr) – Datatypes for state data to be loaded (options: ‘pos’, ‘vel’, ‘spinras’, ‘spindec’) Default: [‘pos’, ‘vel’]suffix (
str) – The tplot variable names will be given this suffix. Default: Noneno_update (
bool) – Set this flag to preserve the original data. if not set and newer data is found the existing data will be overwritten Default: Falsepred_or_def (
bool) – Load definitive or predicted (if definitive isn’t available); defaults to True Default: True
- Returns:
List of tplot variables created.
- Return type:
Example
>>> import pyspedas
>>> from pyspedas import tplot
>>> pos_data = pyspedas.projects.mms.mms_load_state(trange=['2015-10-16', '2015-10-17'], probe='1', datatypes='pos', level='def')
>>> tplot('mms1_defeph_pos')
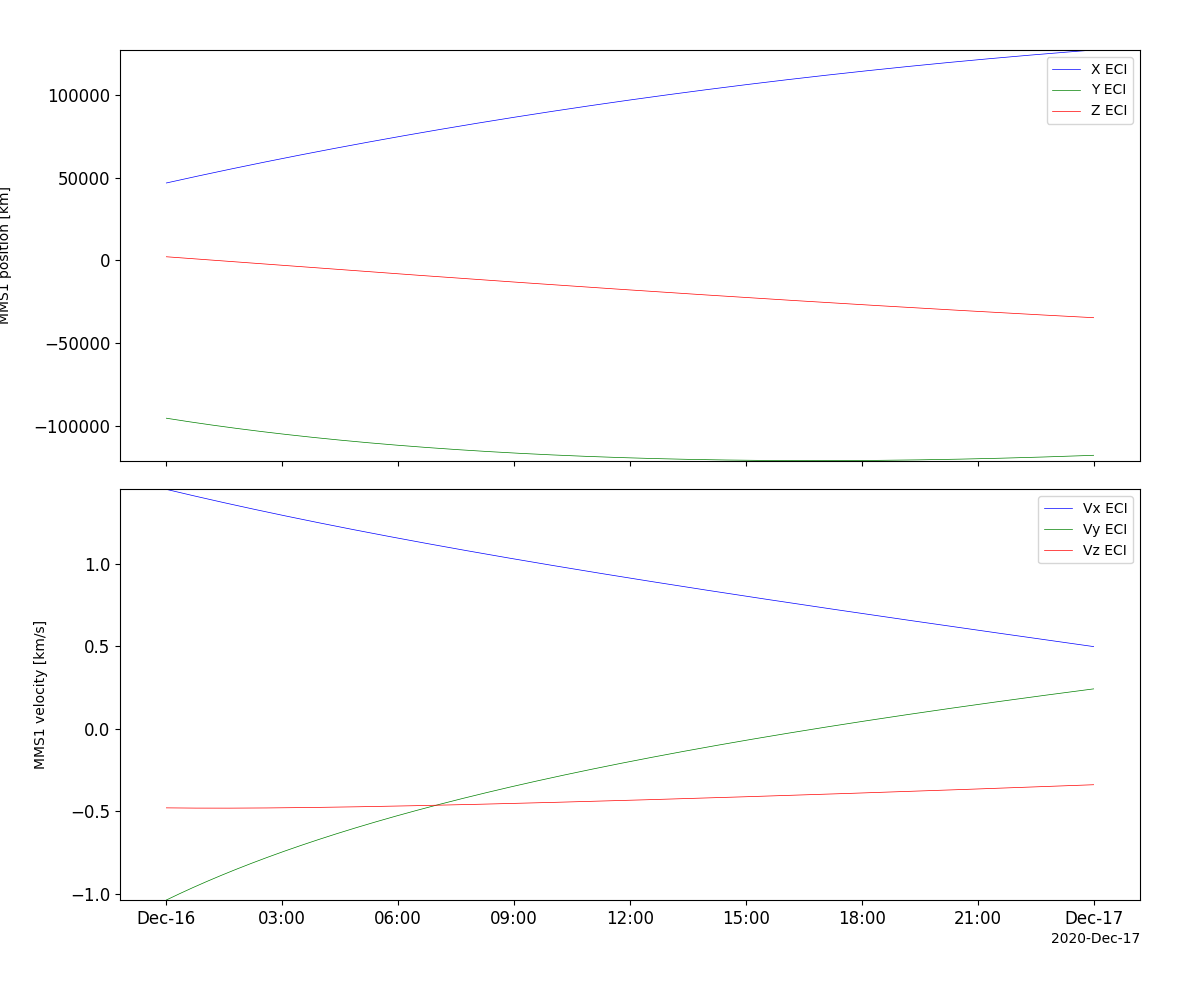
State Example
import pyspedas
from pyspedas import tplot
pyspedas.projects.mms.state(trange=['2020-12-16', '2020-12-17'])
tplot(['mms1_defeph_pos', 'mms1_defeph_vel'])
Tetrahedron Quality Factor
Short name: pyspedas.projects.mms.tetrahedron_qf
- pyspedas.projects.mms.mms_load_tetrahedron_qf(trange=['2015-10-16', '2015-10-17'], no_update=False, suffix='')[source]
Load the MMS tetrahedron quality factor data from the ASCII files into tplot variables
- Parameters:
trange (
listofstr) – time range of interest [start time, end time] with the format ‘YYYY-MM-DD’,’YYYY-MM-DD’] or to specify more or less than a day [‘YYYY-MM-DD/hh:mm:ss’,’YYYY-MM-DD/hh:mm:ss’] Default: [‘2015-10-16’, ‘2015-10-17’]suffix (
str) – The tplot variable names will be given this suffix. By default, no suffix is added. Default: Noneno_update (
bool) – Set this flag to preserve the original data. if not set and newer data is found the existing data will be overwritten Default: False
- Returns:
List of tplot variables created.
- Return type:
Example
>>> import pyspedas
>>> from pyspedas import tplot
>>> qf_vars = pyspedas.projects.mms.mms_load_tetrahedron_qf(trange=['2015-10-16', '2015-10-17'])
>>> tplot('mms_tetrahedron_qf')
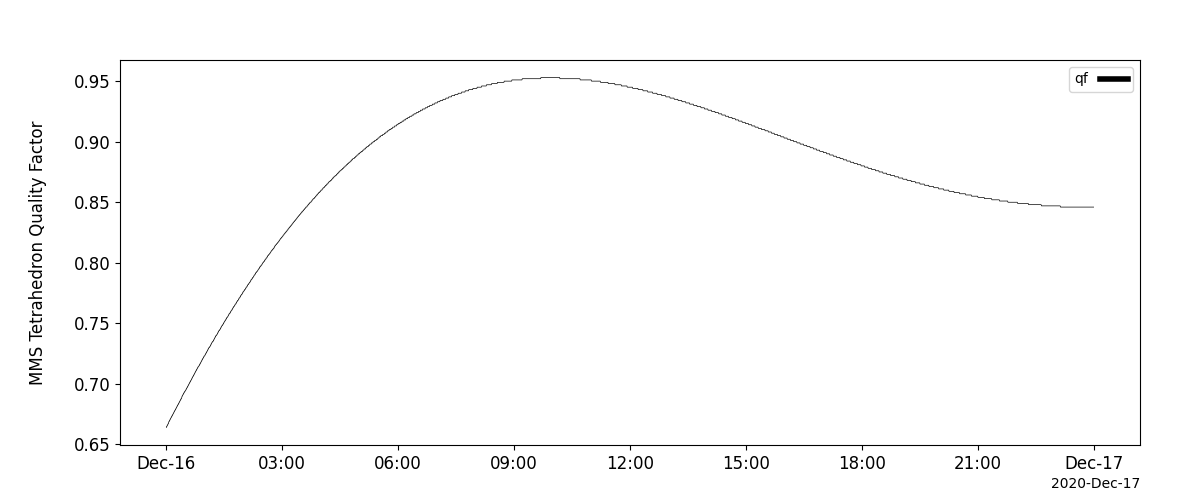
Tetrahedron QF Example
import pyspedas
from pyspedas import tplot
pyspedas.projects.mms.tetrahedron_qf(trange=['2020-12-16', '2020-12-17'])
tplot(['mms_tetrahedron_qf'])