Geotail
The routines in this module can be used to load data from the Geotail mission.
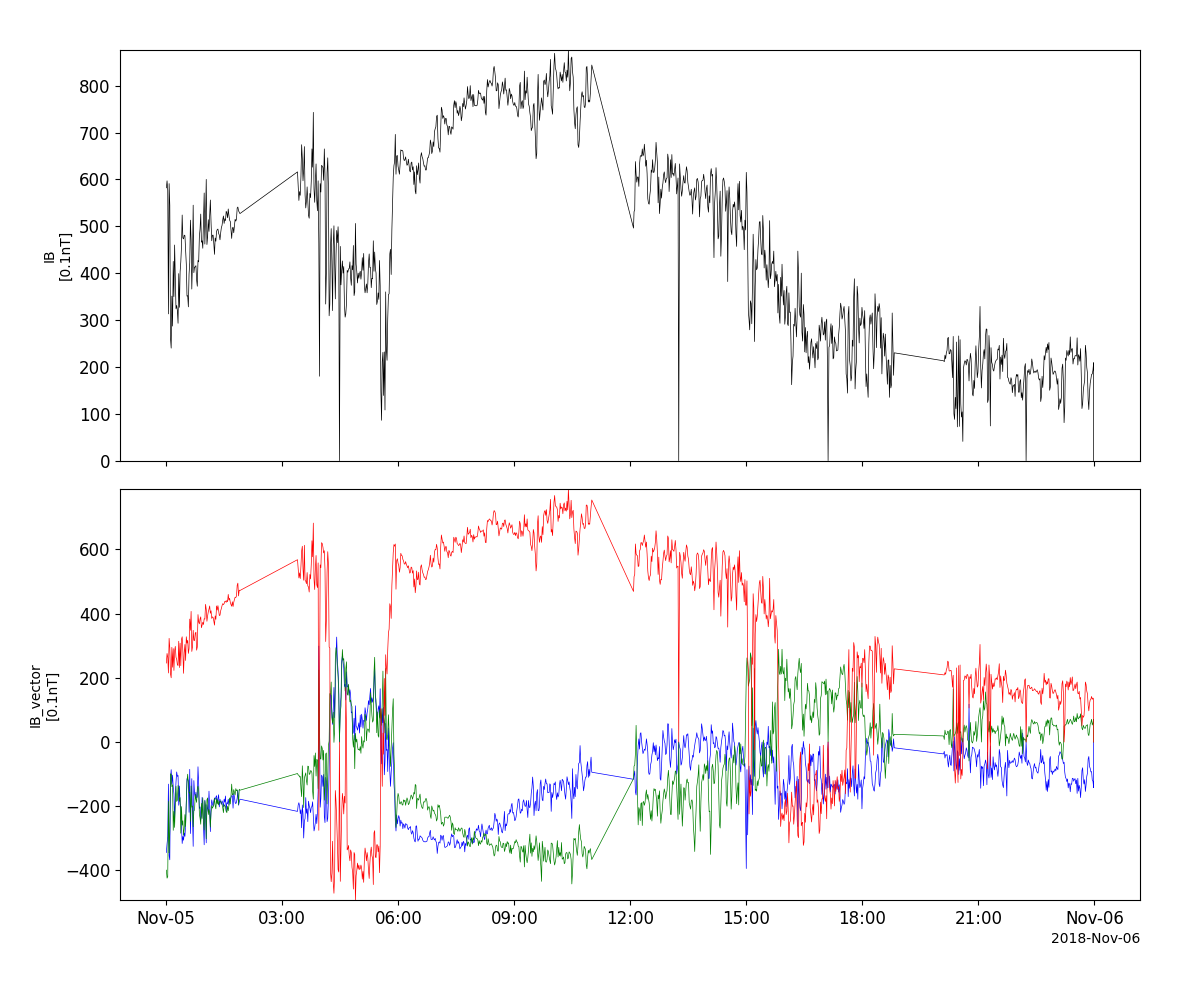
Magnetic Field Experiment (MGF)
- pyspedas.projects.geotail.mgf(trange=['2018-11-5', '2018-11-6'], datatype='k0', suffix='', prefix='', get_support_data=False, varformat=None, varnames=[], downloadonly=False, notplot=False, no_update=False, time_clip=False, force_download=False)[source]
This function loads data from the MGF instrument
- Parameters:
trange (
listofstr) – time range of interest [starttime, endtime] with the format ‘YYYY-MM-DD’,’YYYY-MM-DD’] or to specify more or less than a day [‘YYYY-MM-DD/hh:mm:ss’,’YYYY-MM-DD/hh:mm:ss’]datatype (
str) – Data type; Valid options:suffix (
str) – The tplot variable names will be given this suffix. By default, no suffix is added.prefix (
str) – The tplot variable names will be given this prefix. Default: no prefix is addedget_support_data (
bool) – Data with an attribute “VAR_TYPE” with a value of “support_data” will be loaded into tplot. By default, only loads in data with a “VAR_TYPE” attribute of “data”.varformat (
str) – The file variable formats to load into tplot. Wildcard character “*” is accepted. By default, all variables are loaded in.varnames (
listofstr) – List of variable names to load (if not specified, all data variables are loaded)downloadonly (
bool) – Set this flag to download the CDF files, but not load them into tplot variablesnotplot (
bool) – Return the data in hash tables instead of creating tplot variablesno_update (
bool) – If set, only load data from your local cachetime_clip (
bool) – Time clip the variables to exactly the range specified in the trange keywordforce_download (
bool) – Download file even if local version is more recent than server version Default: False
- Return type:
Listoftplot variables created.
Example
import pyspedas
from pyspedas import tplot
mgf_vars = pyspedas.projects.geotail.mgf(trange=['2018-11-5', '2018-11-6'])
tplot(['IB', 'IB_vector'])
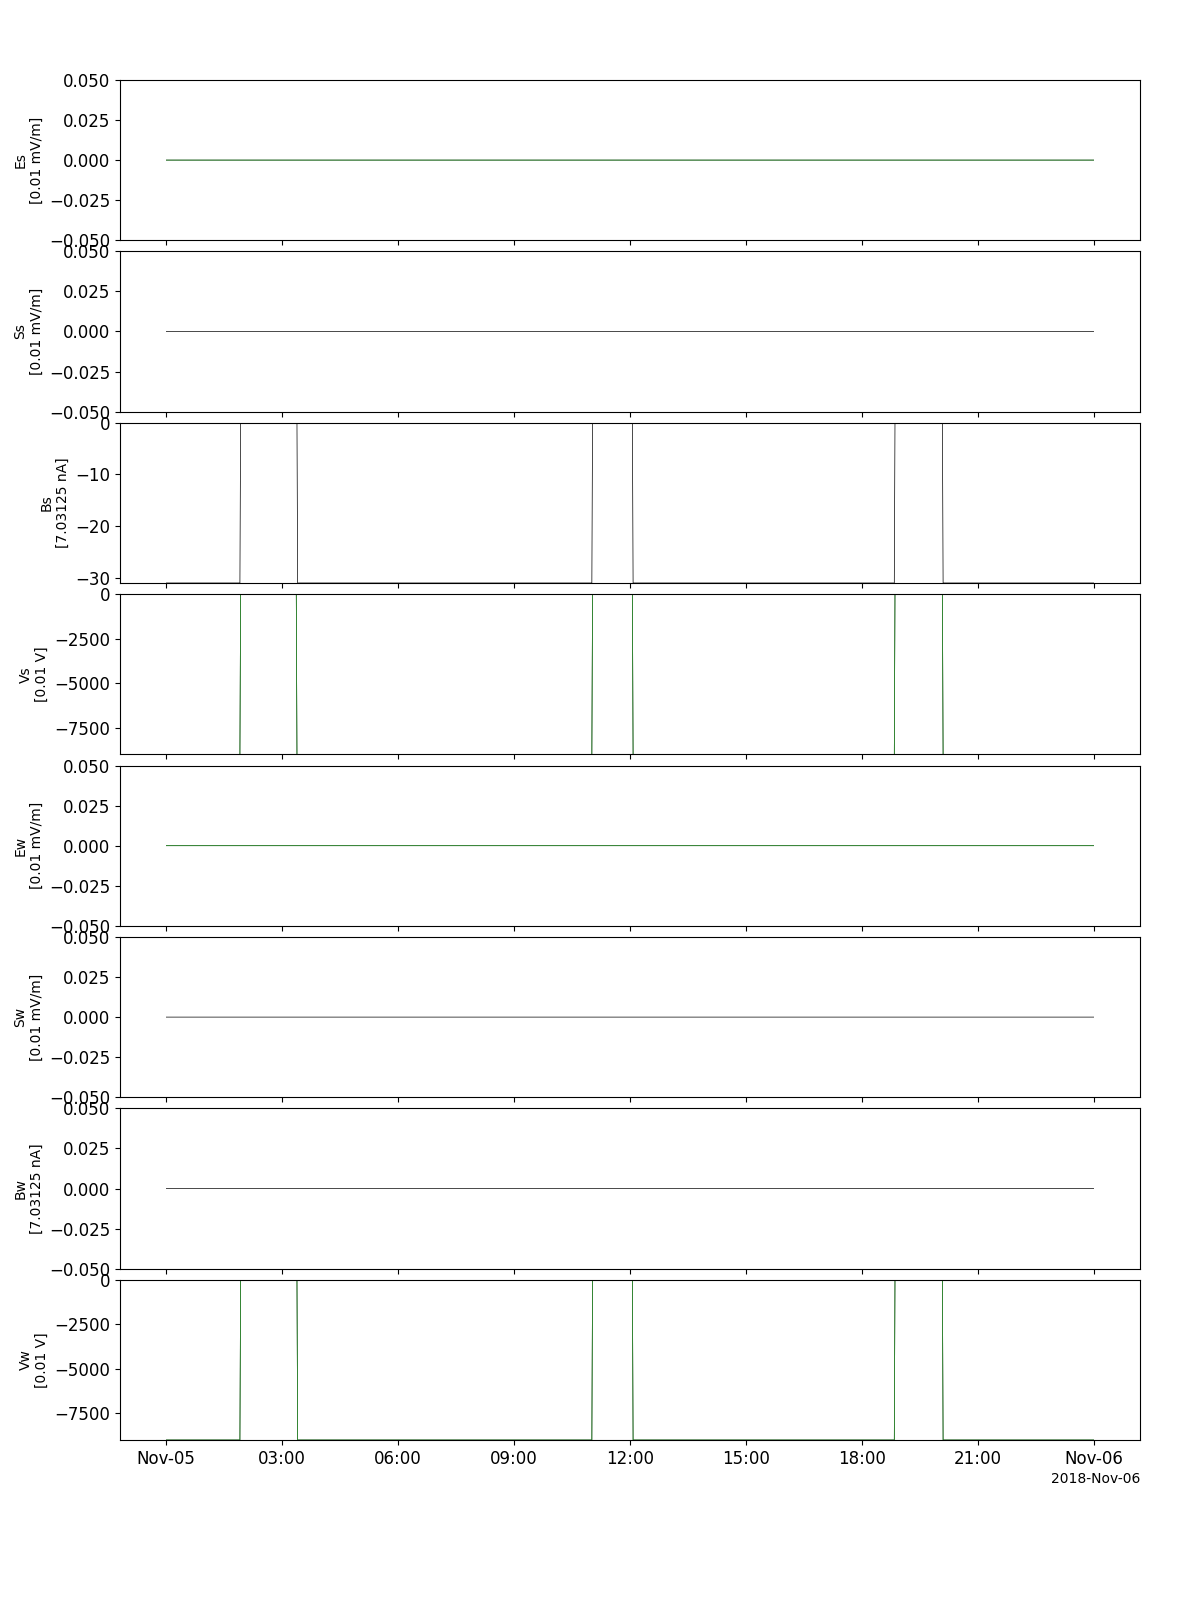
Electric Field Detector (EFD)
- pyspedas.projects.geotail.efd(trange=['2018-11-5', '2018-11-6'], datatype='k0', suffix='', prefix='', get_support_data=False, varformat=None, varnames=[], downloadonly=False, notplot=False, no_update=False, time_clip=False, force_download=False)[source]
This function loads data from the EFD instrument
- Parameters:
trange (
listofstr) – time range of interest [starttime, endtime] with the format ‘YYYY-MM-DD’,’YYYY-MM-DD’] or to specify more or less than a day [‘YYYY-MM-DD/hh:mm:ss’,’YYYY-MM-DD/hh:mm:ss’]datatype (
str) – Data type; Valid options:suffix (
str) – The tplot variable names will be given this suffix. By default, no suffix is added.prefix (
str) – The tplot variable names will be given this prefix. Default: no prefix is addedget_support_data (
bool) – Data with an attribute “VAR_TYPE” with a value of “support_data” will be loaded into tplot. By default, only loads in data with a “VAR_TYPE” attribute of “data”.varformat (
str) – The file variable formats to load into tplot. Wildcard character “*” is accepted. By default, all variables are loaded in.varnames (
listofstr) – List of variable names to load (if not specified, all data variables are loaded)downloadonly (
bool) – Set this flag to download the CDF files, but not load them into tplot variablesnotplot (
bool) – Return the data in hash tables instead of creating tplot variablesno_update (
bool) – If set, only load data from your local cachetime_clip (
bool) – Time clip the variables to exactly the range specified in the trange keywordforce_download (
bool) – Download file even if local version is more recent than server version Default: False
- Return type:
Listoftplot variables created.
Example
import pyspedas
from pyspedas import tplot
efd_vars = pyspedas.projects.geotail.efd(trange=['2018-11-5', '2018-11-6'])
tplot(['Es', 'Ss', 'Bs', 'Vs', 'Ew', 'Sw', 'Bw', 'Vw'])
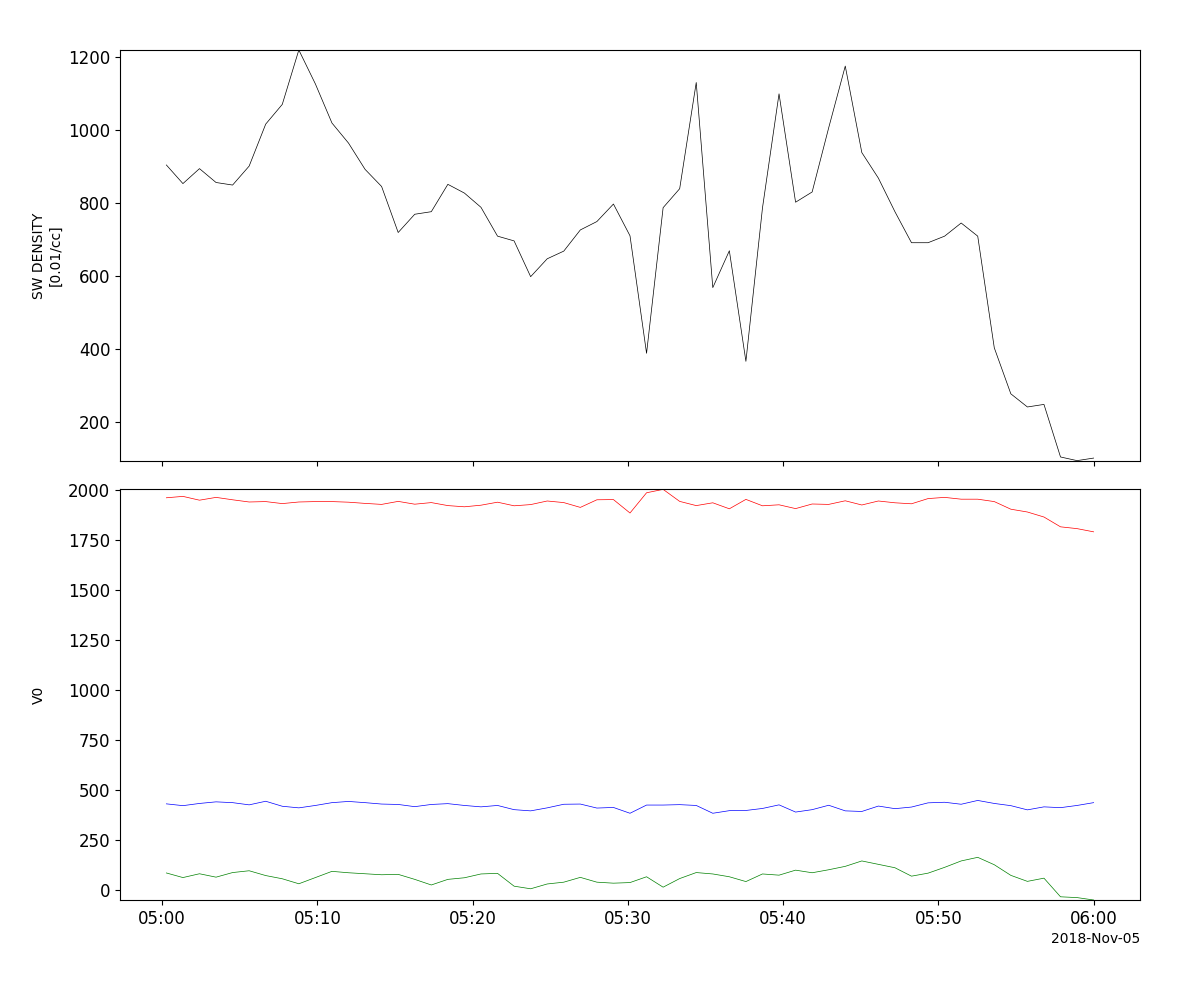
Low Energy Particle experiment (LEP)
- pyspedas.projects.geotail.lep(trange=['2018-11-5', '2018-11-6'], datatype='k0', suffix='', prefix='', get_support_data=False, varformat=None, varnames=[], downloadonly=False, notplot=False, no_update=False, time_clip=False, force_download=False)[source]
This function loads data from the LEP instrument
- Parameters:
trange (
listofstr) – time range of interest [starttime, endtime] with the format ‘YYYY-MM-DD’,’YYYY-MM-DD’] or to specify more or less than a day [‘YYYY-MM-DD/hh:mm:ss’,’YYYY-MM-DD/hh:mm:ss’]datatype (
str) – Data type; Valid options:suffix (
str) – The tplot variable names will be given this suffix. By default, no suffix is added.prefix (
str) – The tplot variable names will be given this prefix. Default: no prefix is addedget_support_data (
bool) – Data with an attribute “VAR_TYPE” with a value of “support_data” will be loaded into tplot. By default, only loads in data with a “VAR_TYPE” attribute of “data”.varformat (
str) – The file variable formats to load into tplot. Wildcard character “*” is accepted. By default, all variables are loaded in.varnames (
listofstr) – List of variable names to load (if not specified, all data variables are loaded)downloadonly (
bool) – Set this flag to download the CDF files, but not load them into tplot variablesnotplot (
bool) – Return the data in hash tables instead of creating tplot variablesno_update (
bool) – If set, only load data from your local cachetime_clip (
bool) – Time clip the variables to exactly the range specified in the trange keywordforce_download (
bool) – Download file even if local version is more recent than server version Default: False
- Return type:
Listoftplot variables created.
Example
import pyspedas
from pyspedas import tplot
lep_vars = pyspedas.projects.geotail.lep(trange=['2018-11-5/05:00', '2018-11-5/06:00'], time_clip=True)
tplot(['N0', 'V0'])
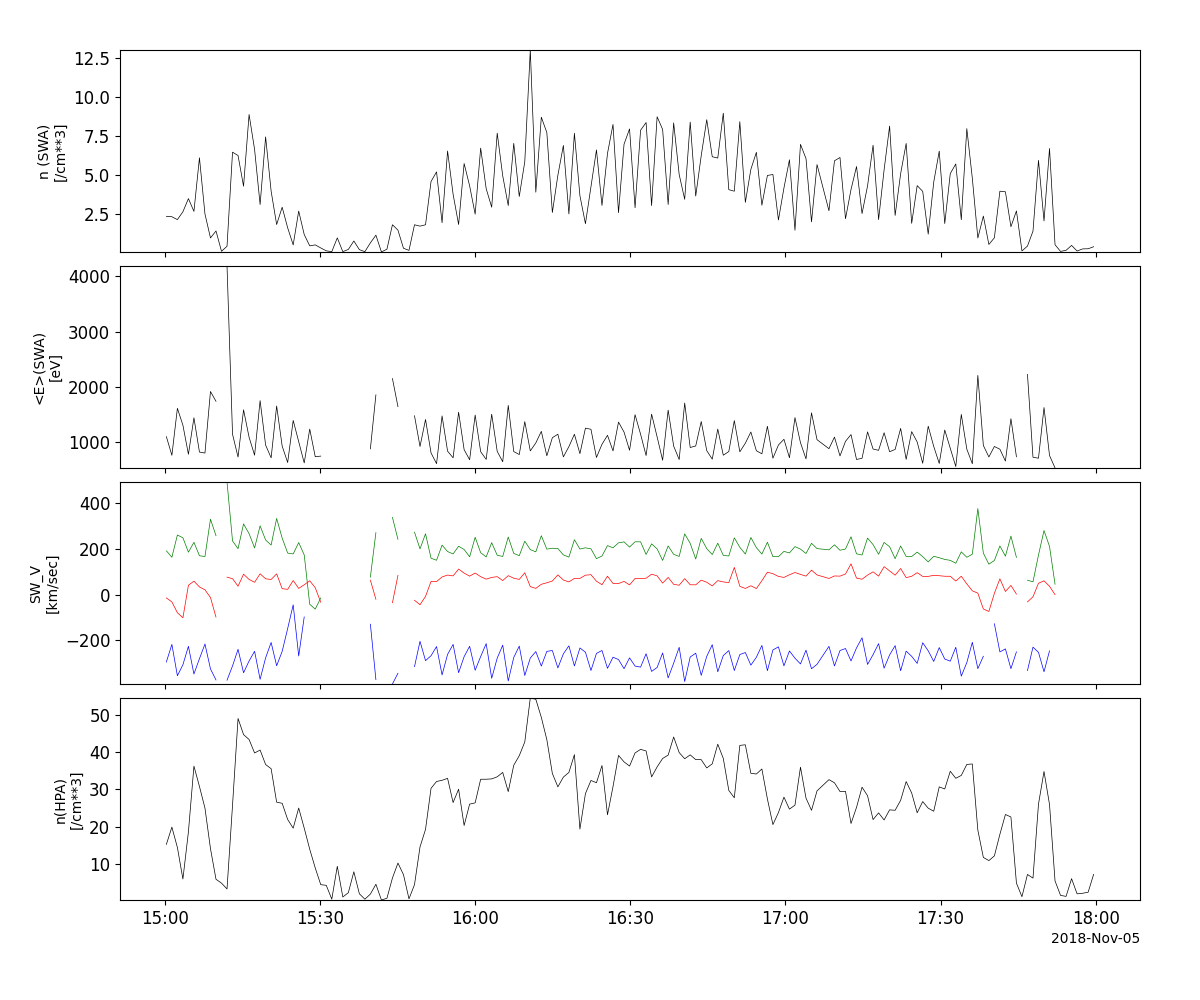
Comprehensive Plasma Instrumentation (CPI)
- pyspedas.projects.geotail.cpi(trange=['2018-11-5', '2018-11-6'], datatype='k0', suffix='', prefix='', get_support_data=False, varformat=None, varnames=[], downloadonly=False, notplot=False, no_update=False, time_clip=False, force_download=False)[source]
This function loads data from the CPI instrument
- Parameters:
trange (
listofstr) – time range of interest [starttime, endtime] with the format ‘YYYY-MM-DD’,’YYYY-MM-DD’] or to specify more or less than a day [‘YYYY-MM-DD/hh:mm:ss’,’YYYY-MM-DD/hh:mm:ss’]datatype (
str) – Data type; Valid options:suffix (
str) – The tplot variable names will be given this suffix. By default, no suffix is added.prefix (
str) – The tplot variable names will be given this prefix. Default: no prefix is addedget_support_data (
bool) – Data with an attribute “VAR_TYPE” with a value of “support_data” will be loaded into tplot. By default, only loads in data with a “VAR_TYPE” attribute of “data”.varformat (
str) – The file variable formats to load into tplot. Wildcard character “*” is accepted. By default, all variables are loaded in.varnames (
listofstr) – List of variable names to load (if not specified, all data variables are loaded)downloadonly (
bool) – Set this flag to download the CDF files, but not load them into tplot variablesnotplot (
bool) – Return the data in hash tables instead of creating tplot variablesno_update (
bool) – If set, only load data from your local cachetime_clip (
bool) – Time clip the variables to exactly the range specified in the trange keywordforce_download (
bool) – Download file even if local version is more recent than server version Default: False
- Return type:
Listoftplot variables created.
Example
import pyspedas
from pyspedas import tplot
cpi_vars = pyspedas.projects.geotail.cpi(trange=['2018-11-5/15:00', '2018-11-5/18:00'], time_clip=True)
tplot(['SW_P_Den', 'SW_P_AVGE', 'SW_V', 'HP_P_Den'])
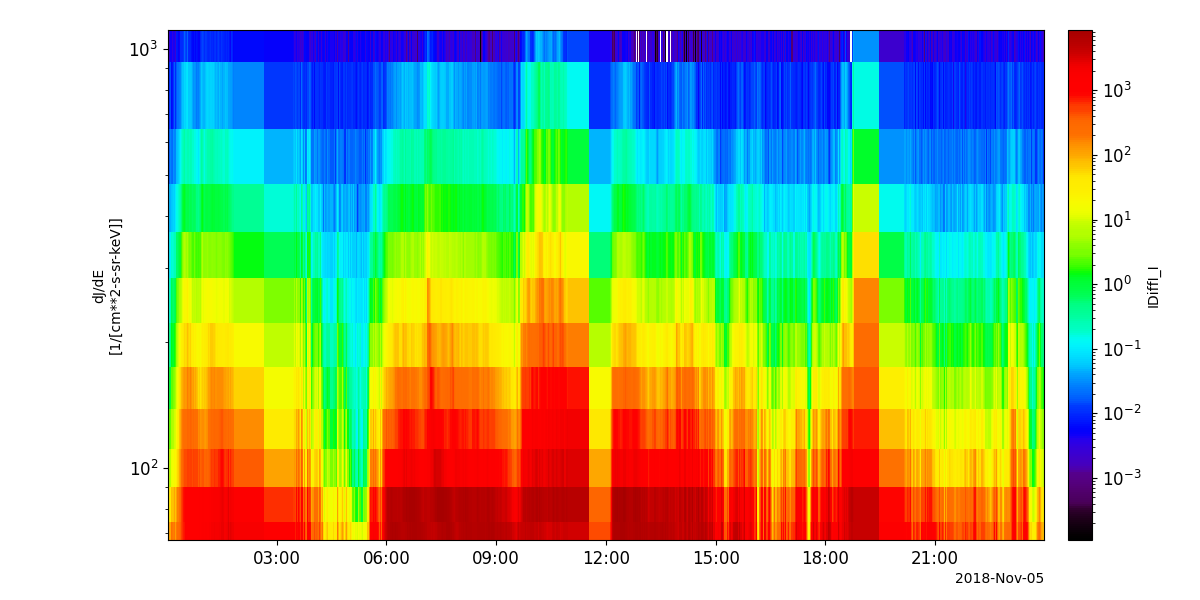
Energetic Particles and Ion Composition Instrument (EPIC)
- pyspedas.projects.geotail.epic(trange=['2018-11-5', '2018-11-6'], datatype='k0', suffix='', prefix='', get_support_data=False, varformat=None, varnames=[], downloadonly=False, notplot=False, no_update=False, time_clip=False, force_download=False)[source]
This function loads data from the EPIC instrument
- Parameters:
trange (
listofstr) – time range of interest [starttime, endtime] with the format ‘YYYY-MM-DD’,’YYYY-MM-DD’] or to specify more or less than a day [‘YYYY-MM-DD/hh:mm:ss’,’YYYY-MM-DD/hh:mm:ss’]datatype (
str) – Data type; Valid options:suffix (
str) – The tplot variable names will be given this suffix. By default, no suffix is added.prefix (
str) – The tplot variable names will be given this prefix. Default: no prefix is addedget_support_data (
bool) – Data with an attribute “VAR_TYPE” with a value of “support_data” will be loaded into tplot. By default, only loads in data with a “VAR_TYPE” attribute of “data”.varformat (
str) – The file variable formats to load into tplot. Wildcard character “*” is accepted. By default, all variables are loaded in.varnames (
listofstr) – List of variable names to load (if not specified, all data variables are loaded)downloadonly (
bool) – Set this flag to download the CDF files, but not load them into tplot variablesnotplot (
bool) – Return the data in hash tables instead of creating tplot variablesno_update (
bool) – If set, only load data from your local cachetime_clip (
bool) – Time clip the variables to exactly the range specified in the trange keywordforce_download (
bool) – Download file even if local version is more recent than server version Default: False
- Return type:
Listoftplot variables created.
Example
import pyspedas
from pyspedas import tplot
epic_vars = pyspedas.projects.geotail.epic(trange=['2018-11-5', '2018-11-6'])
tplot('IDiffI_I')
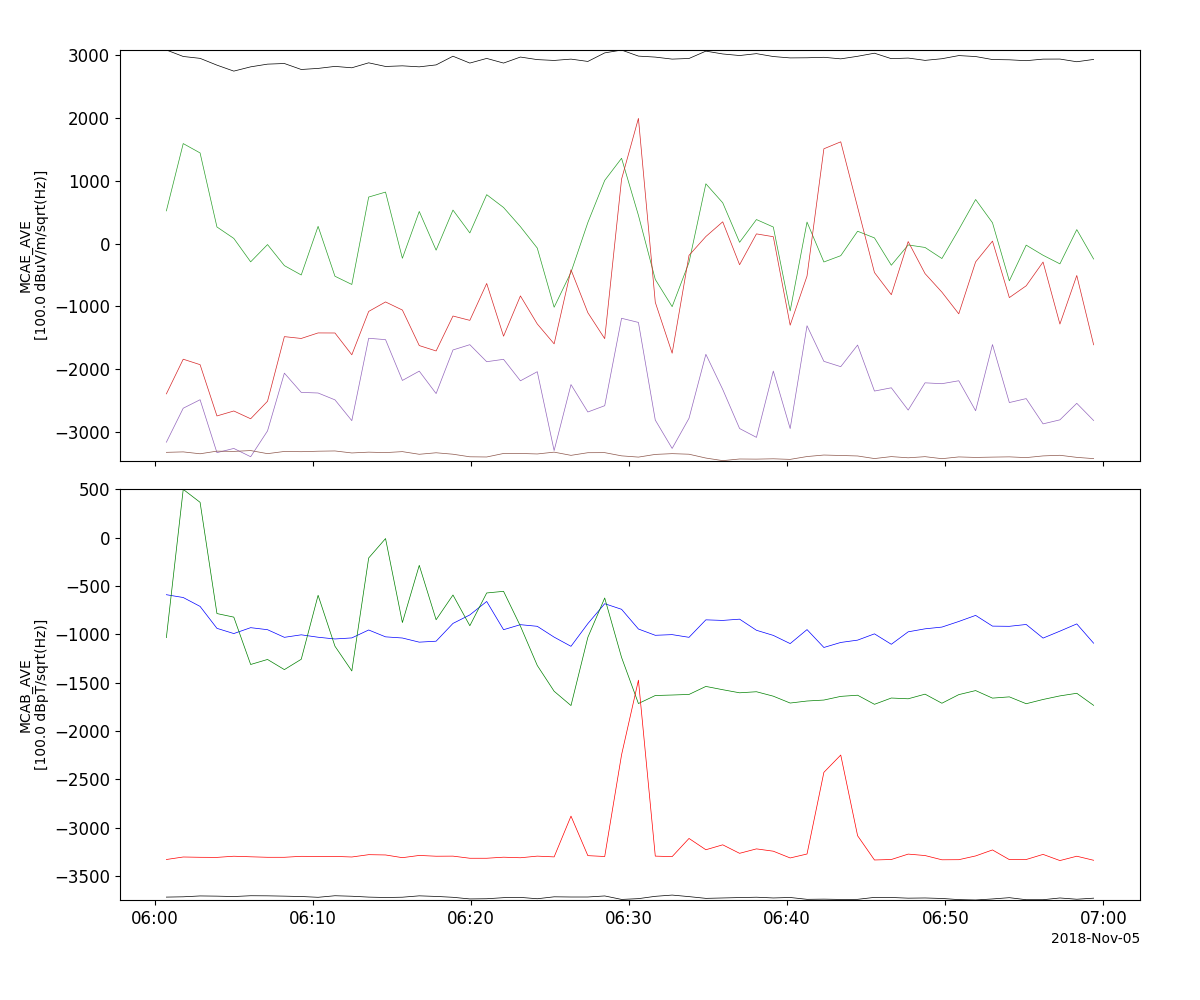
Plasma Wave Instrument (PWI)
- pyspedas.projects.geotail.pwi(trange=['2018-11-5', '2018-11-6'], datatype='k0', suffix='', prefix='', get_support_data=False, varformat=None, varnames=[], downloadonly=False, notplot=False, no_update=False, time_clip=False, force_download=False)[source]
This function loads data from the PWI instrument
- Parameters:
trange (
listofstr) – time range of interest [starttime, endtime] with the format [‘YYYY-MM-DD’,’YYYY-MM-DD’] or to specify more or less than a day [‘YYYY-MM-DD/hh:mm:ss’,’YYYY-MM-DD/hh:mm:ss’]datatype (
str) – Data type; Valid options:suffix (
str) – The tplot variable names will be given this suffix. By default, no suffix is added.prefix (
str) – The tplot variable names will be given this prefix. Default: no prefix is addedget_support_data (
bool) – Data with an attribute “VAR_TYPE” with a value of “support_data” will be loaded into tplot. By default, only loads in data with a “VAR_TYPE” attribute of “data”.varformat (
str) – The file variable formats to load into tplot. Wildcard character “*” is accepted. By default, all variables are loaded in.varnames (
listofstr) – List of variable names to load (if not specified, all data variables are loaded)downloadonly (
bool) – Set this flag to download the CDF files, but not load them into tplot variablesnotplot (
bool) – Return the data in hash tables instead of creating tplot variablesno_update (
bool) – If set, only load data from your local cachetime_clip (
bool) – Time clip the variables to exactly the range specified in the trange keywordforce_download (
bool) – Download file even if local version is more recent than server version Default: False
- Return type:
Listoftplot variables created.
Example
import pyspedas
from pyspedas import tplot
pwi_vars = pyspedas.projects.geotail.pwi(trange=['2018-11-5/06:00', '2018-11-5/07:00'], time_clip=True)
tplot(['MCAE_AVE', 'MCAB_AVE'])