Advanced Composition Explorer (ACE)
The routines in this module can be used to load data from the Advanced Composition Explorer (ACE) mission.
Magnetometer (MFI)
- pyspedas.projects.ace.mfi(trange=['2018-11-5', '2018-11-6'], datatype='h3', prefix='', suffix='', get_support_data=False, varformat=None, varnames=[], downloadonly=False, notplot=False, no_update=False, time_clip=False, force_download=False)[source]
Loads data from the ACE Fluxgate Magnetometer
- Parameters:
trange (
listofstr) – time range of interest [starttime, endtime] with the format ‘YYYY-MM-DD’,’YYYY-MM-DD’] or to specify more or less than a day [‘YYYY-MM-DD/hh:mm:ss’,’YYYY-MM-DD/hh:mm:ss’] Default: [‘2018-11-5’, ‘2018-11-6’]datatype (
str) –Data type; Valid options:
h0: 16-Second Level 2 Data
h1: 4-Minute Level 2 Data
h2: 1-Hour Level 2 Data
h3: (default) 1-Second Level 2 Data
k0: 5-Minute Key Parameters [PRELIM]
k1: 16-Second Key Parameters [PRELIM]
k2: 1-Hour Key Parameters [PRELIM]
Default: ‘h3’
prefix (
str) – The tplot variable names will be given this prefix. By default, no prefix is added. Default: ‘’suffix (
str) – The tplot variable names will be given this suffix. By default, no suffix is added. Default: ‘’get_support_data (
bool) – Data with an attribute “VAR_TYPE” with a value of “support_data” will be loaded into tplot. By default, only loads in data with a “VAR_TYPE” attribute of “data”. Default: Falsevarformat (
str) – The file variable formats to load into tplot. Wildcard character “*” is accepted. By default, all variables are loaded in. Default: Nonevarnames (
listofstr) – List of variable names to load (if not specified, all data variables are loaded) Default: []downloadonly (
bool) – Set this flag to download the CDF files, but not load them into tplot variables Default: Falsenotplot (
bool) – Return the data in hash tables instead of creating tplot variables Default: Falseno_update (
bool) – If set, only load data from your local cache Default: Falsetime_clip (
bool) – Time clip the variables to exactly the range specified in the trange keyword Default: Falseforce_download (
bool) – Download file even if local version is more recent than server version Default: False
- Returns:
A list of the tplot variables created.
- Return type:
Examples
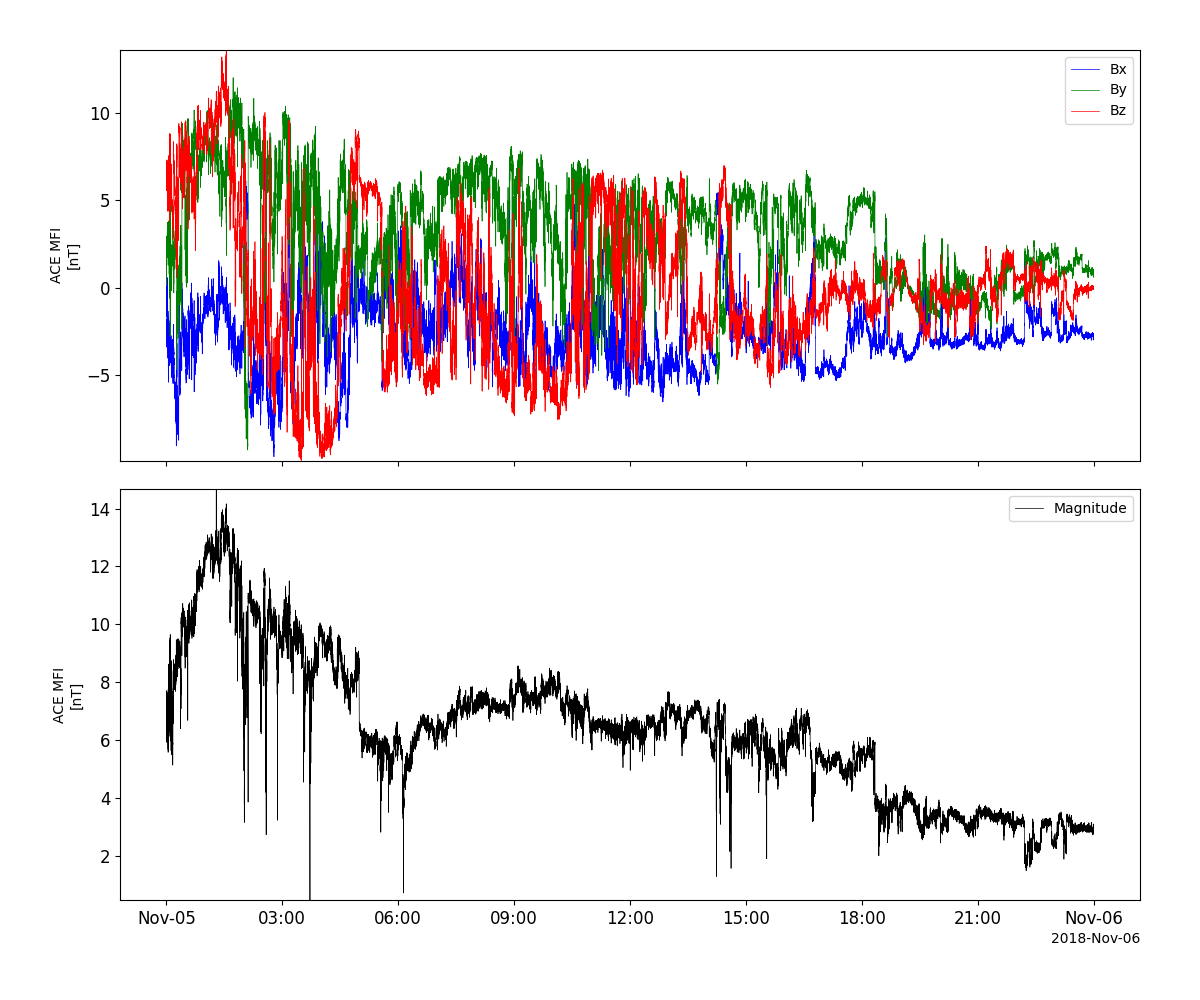
>>> import pyspedas
>>> from pyspedas import tplot
>>> mfi_vars = pyspedas.projects.ace.mfi(trange=['2018-11-5', '2018-11-6'])
>>> tplot(['BGSEc', 'Magnitude'])
Example
import pyspedas
from pyspedas import tplot
mfi_vars = pyspedas.projects.ace.mfi(trange=['2018-11-5', '2018-11-6'])
tplot(['BGSEc', 'Magnitude'])
Solar Wind Electron, Proton and Alpha Monitor (SWEPAM)
- pyspedas.projects.ace.swe(trange=['2018-11-5', '2018-11-6'], datatype='h0', prefix='', suffix='', get_support_data=False, varformat=None, varnames=[], downloadonly=False, notplot=False, no_update=False, time_clip=False, force_download=False)[source]
Load data from the ACE Solar Wind Electron, Proton and Alpha Monitor (SWEPAM)
- Parameters:
trange (
listofstr) – time range of interest [starttime, endtime] with the format ‘YYYY-MM-DD’,’YYYY-MM-DD’] or to specify more or less than a day [‘YYYY-MM-DD/hh:mm:ss’,’YYYY-MM-DD/hh:mm:ss’] Default: [‘2018-11-5’, ‘2018-11-6’]datatype (
str) –Data type; Valid options:
h0: (default) 64-Second Level 2 Data
h2: 1-Hour Level 2 Data
k0: 5-Minute Key Parameters [PRELIM]
k1: 1-Hour Key Parameters [PRELIM]
Default: ‘h0’
prefix (
str) – The tplot variable names will be given this prefix. By default, no prefix is added. Default: ‘’suffix (
str) – The tplot variable names will be given this suffix. By default, no suffix is added. Default: ‘’get_support_data (
bool) – Data with an attribute “VAR_TYPE” with a value of “support_data” will be loaded into tplot. By default, only loads in data with a “VAR_TYPE” attribute of “data”. Default: Falsevarformat (
str) – The file variable formats to load into tplot. Wildcard character “*” is accepted. By default, all variables are loaded in. Default: Nonevarnames (
listofstr) – List of variable names to load (if not specified, all data variables are loaded) Default: []downloadonly (
bool) – Set this flag to download the CDF files, but not load them into tplot variables Default: Falsenotplot (
bool) – Return the data in hash tables instead of creating tplot variables Default: Falseno_update (
bool) – If set, only load data from your local cache Default: Falsetime_clip (
bool) – Time clip the variables to exactly the range specified in the trange keyword Default: Falseforce_download (
bool) – Download file even if local version is more recent than server version Default: False
- Returns:
A list of the tplot variables created.
- Return type:
Examples
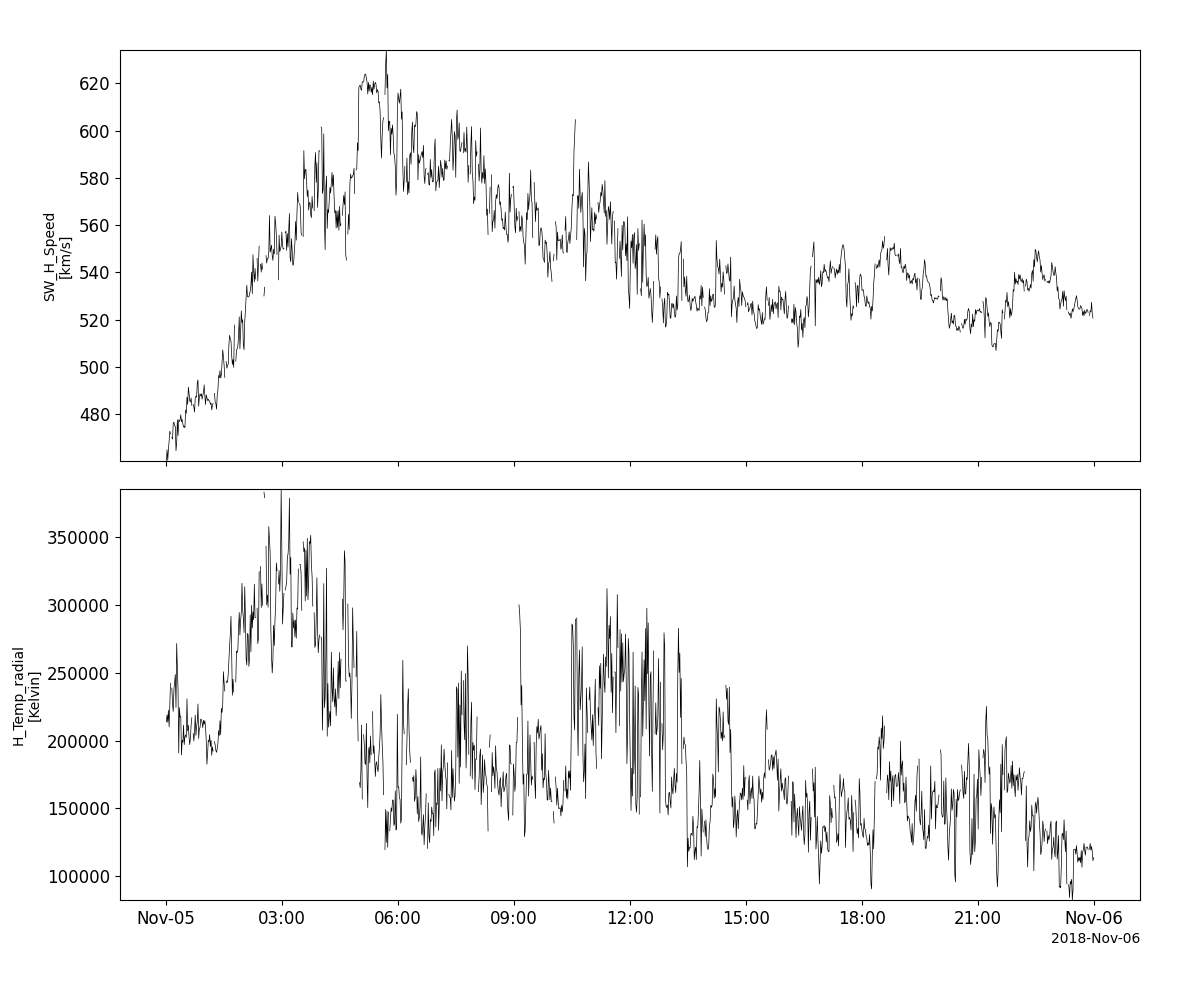
>>> import pyspedas
>>> from pyspedas import tplot
>>> swe_vars = pyspedas.projects.ace.swe(trange=['2018-11-5', '2018-11-6'])
>>> tplot(['Vp', 'Tpr'])
Example
import pyspedas
from pyspedas import tplot
swe_vars = pyspedas.projects.ace.swe(trange=['2018-11-5', '2018-11-6'])
tplot(['Vp', 'Tpr'])
Electron, Proton, and Alpha-particle Monitor (EPAM)
- pyspedas.projects.ace.epam(trange=['2018-11-5', '2018-11-6'], datatype='k0', prefix='', suffix='', get_support_data=False, varformat=None, varnames=[], downloadonly=False, notplot=False, no_update=False, time_clip=False, force_download=False)[source]
Load data from the ACE Electron Proton Alpha Monitor (EPAM)
- Parameters:
trange (
listofstr) – time range of interest [starttime, endtime] with the format ‘YYYY-MM-DD’,’YYYY-MM-DD’] or to specify more or less than a day [‘YYYY-MM-DD/hh:mm:ss’,’YYYY-MM-DD/hh:mm:ss’] Default: [‘2018-11-5’, ‘2018-11-6’]datatype (
str) –Data type; Valid options:
h1: 5-Minute Level 2 Data
h2: 1-Hour Level 2 Data
h3: 12-second Level 2 Data
k0: (default) 5-Minute Key Parameters
k1: 1-Hour Key Parameters
Default: ‘k0’
prefix (
str) – The tplot variable names will be given this prefix. By default, no prefix is added. Default: ‘’suffix (
str) – The tplot variable names will be given this suffix. By default, no suffix is added. Default: ‘’get_support_data (
bool) – Data with an attribute “VAR_TYPE” with a value of “support_data” will be loaded into tplot. By default, only loads in data with a “VAR_TYPE” attribute of “data”. Default: Falsevarformat (
str) – The file variable formats to load into tplot. Wildcard character “*” is accepted. By default, all variables are loaded in. Default: Nonevarnames (
listofstr) – List of variable names to load (if not specified, all data variables are loaded) Default: []downloadonly (
bool) – Set this flag to download the CDF files, but not load them into tplot variables Default: Falsenotplot (
bool) – Return the data in hash tables instead of creating tplot variables Default: Falseno_update (
bool) – If set, only load data from your local cache Default: Falsetime_clip (
bool) – Time clip the variables to exactly the range specified in the trange keyword Default: Falseforce_download (
bool) – Download file even if local version is more recent than server version Default: False
- Returns:
List of the tplot variables created.
- Return type:
Examples
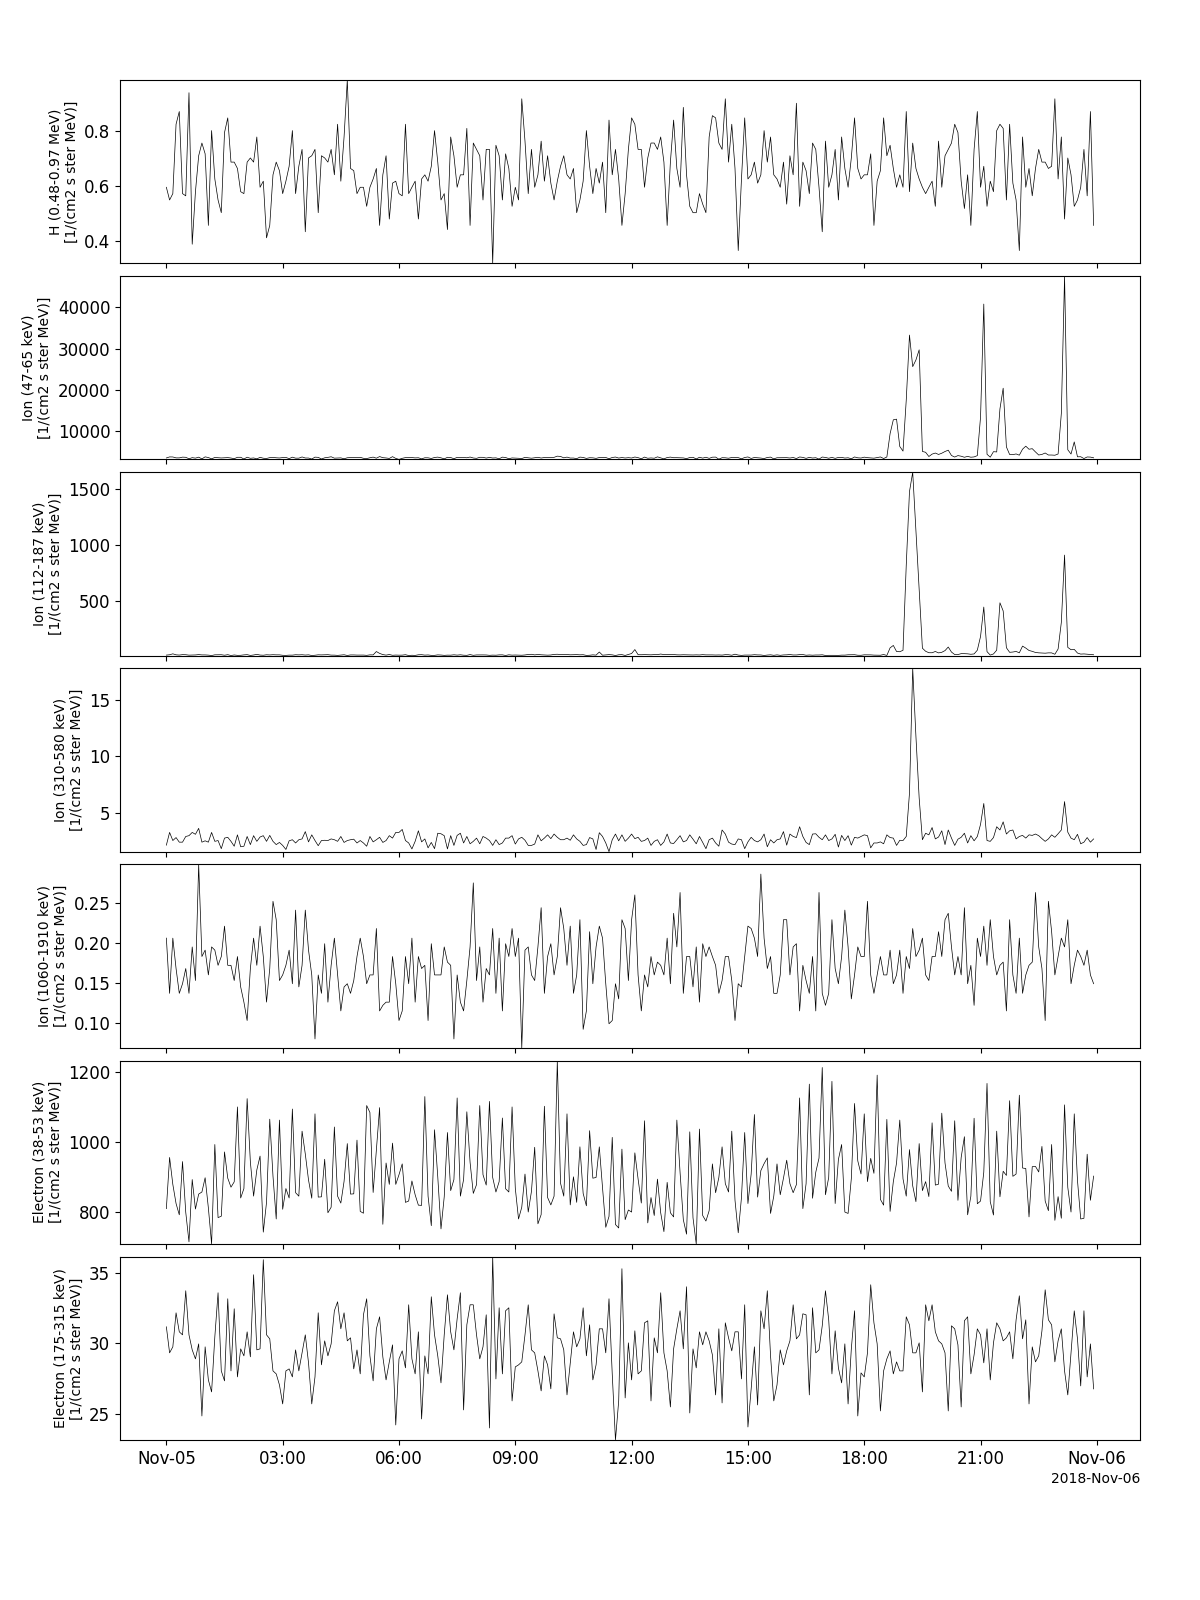
>>> import pyspedas
>>> from pyspedas import tplot
>>> epam_vars = pyspedas.projects.ace.epam(trange=['2018-11-5', '2018-11-6'])
>>> tplot(['H_lo', 'Ion_very_lo', 'Ion_lo', 'Ion_mid', 'Ion_hi', 'Electron_lo', 'Electron_hi'])
Example
import pyspedas
from pyspedas import tplot
epam_vars = pyspedas.projects.ace.epam(trange=['2018-11-5', '2018-11-6'])
tplot(['H_lo', 'Ion_very_lo', 'Ion_lo', 'Ion_mid', 'Ion_hi', 'Electron_lo', 'Electron_hi'])
Cosmic Ray Isotope Spectrometer (CRIS)
- pyspedas.projects.ace.cris(trange=['2018-11-5', '2018-11-6'], datatype='h2', prefix='', suffix='', get_support_data=False, varformat=None, varnames=[], downloadonly=False, notplot=False, no_update=False, time_clip=False, force_download=False)[source]
Load data from the ACE Cosmic Ray Isotope Spectrometer (CRIS)
- Parameters:
trange (
listofstr) – time range of interest [starttime, endtime] with the format ‘YYYY-MM-DD’,’YYYY-MM-DD’] or to specify more or less than a day [‘YYYY-MM-DD/hh:mm:ss’,’YYYY-MM-DD/hh:mm:ss’] Default:[‘2018-11-5’, ‘2018-11-6’]datatype (
str) –Data type; Valid options:
h2: (default) 1-Hour Level 2 Data
h3: Daily-averaged Level 2 Data
Default: ‘h2’
prefix (
str) – The tplot variable names will be given this prefix. By default, no prefix is added. Default: ‘’suffix (
str) – The tplot variable names will be given this suffix. By default, no suffix is added. Default: ‘’get_support_data (
bool) – Data with an attribute “VAR_TYPE” with a value of “support_data” will be loaded into tplot. By default, only loads in data with a “VAR_TYPE” attribute of “data”. Default: Falsevarformat (
str) – The file variable formats to load into tplot. Wildcard character “*” is accepted. By default, all variables are loaded in. Default: Nonevarnames (
listofstr) – List of variable names to load (if not specified, all data variables are loaded) Default: []downloadonly (
bool) – Set this flag to download the CDF files, but not load them into tplot variables Default: Falsenotplot (
bool) – Return the data in hash tables instead of creating tplot variables Default: Falseno_update (
bool) – If set, only load data from your local cache Default: Falsetime_clip (
bool) – Time clip the variables to exactly the range specified in the trange keyword Default: Falseforce_download (
bool) – Download file even if local version is more recent than server version Default: False
- Returns:
List of the tplot variables created.
- Return type:
Examples
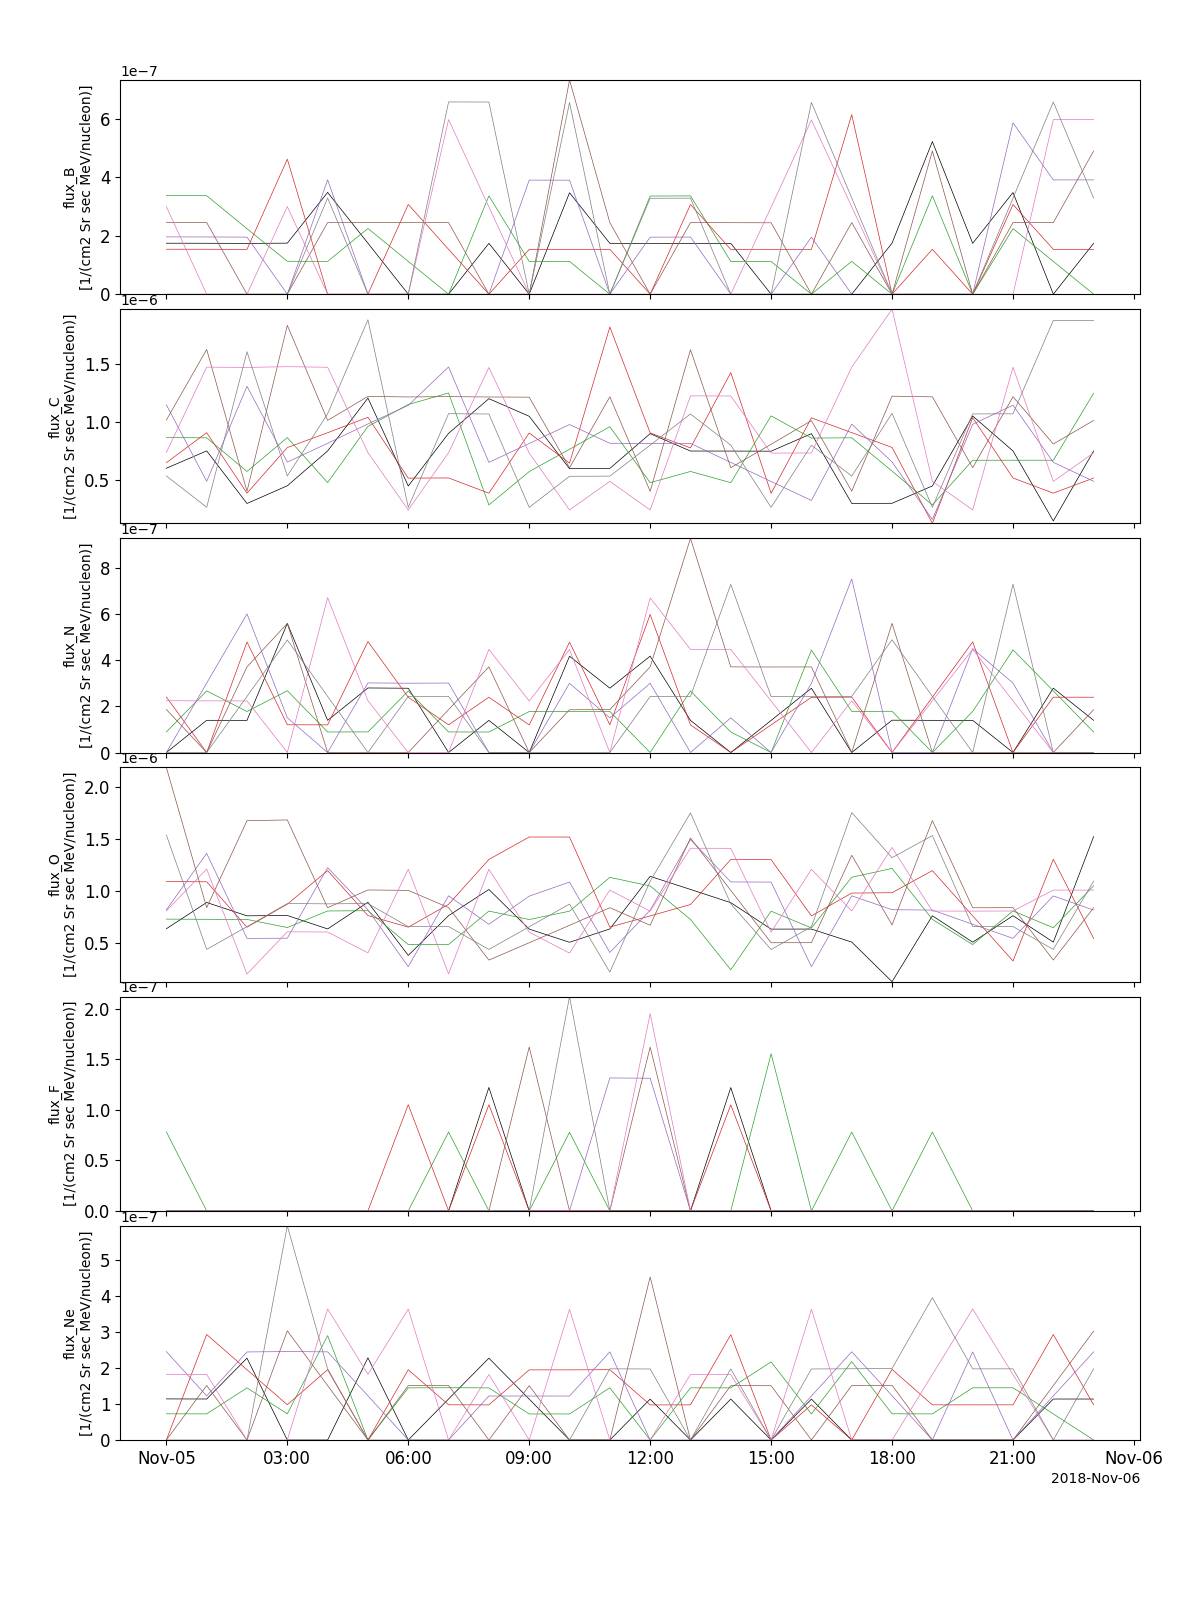
>>> import pyspedas
>>> from pyspedas import tplot
>>> cris_vars = pyspedas.projects.ace.cris(trange=['2018-11-5', '2018-11-6'])
>>> tplot(['flux_B', 'flux_C', 'flux_N', 'flux_O', 'flux_F', 'flux_Ne'])
Example
import pyspedas
from pyspedas import tplot
cris_vars = pyspedas.projects.ace.cris(trange=['2018-11-5', '2018-11-6'])
tplot(['flux_B', 'flux_C', 'flux_N', 'flux_O', 'flux_F', 'flux_Ne'])
Solar Isotope Spectrometer (SIS)
- pyspedas.projects.ace.sis(trange=['2018-11-5', '2018-11-6'], datatype='k0', prefix='', suffix='', get_support_data=False, varformat=None, varnames=[], downloadonly=False, notplot=False, no_update=False, time_clip=False, force_download=False)[source]
Load data from the ACE Solar Isotope Spectrometer (SIS)
- Parameters:
trange (
listofstr) – time range of interest [starttime, endtime] with the format ‘YYYY-MM-DD’,’YYYY-MM-DD’] or to specify more or less than a day [‘YYYY-MM-DD/hh:mm:ss’,’YYYY-MM-DD/hh:mm:ss’] Default: [‘2018-11-5’, ‘2018-11-6’]datatype (
str) –Data type; Valid options:
h1: 256-sec Level 2 Data
h2: 1-Hour Level 2 Data
k0: 1-Hour Key Parameters
Default: ‘k0’
prefix (
str) – The tplot variable names will be given this prefix. By default, no prefix is added. Default: ‘’suffix (
str) – The tplot variable names will be given this suffix. By default, no suffix is added. Default: ‘’get_support_data (
bool) – Data with an attribute “VAR_TYPE” with a value of “support_data” will be loaded into tplot. By default, only loads in data with a “VAR_TYPE” attribute of “data”. Default: Falsevarformat (
str) – The file variable formats to load into tplot. Wildcard character “*” is accepted. By default, all variables are loaded in. Default: Nonevarnames (
listofstr) – List of variable names to load (if not specified, all data variables are loaded) Default: []downloadonly (
bool) – Set this flag to download the CDF files, but not load them into tplot variables Default: Falsenotplot (
bool) – Return the data in hash tables instead of creating tplot variables Default: Falseno_update (
bool) – If set, only load data from your local cache Default: Falsetime_clip (
bool) – Time clip the variables to exactly the range specified in the trange keyword Default: Falseforce_download (
bool) – Download file even if local version is more recent than server version Default: False
- Returns:
A list of the tplot variables created.
- Return type:
Examples
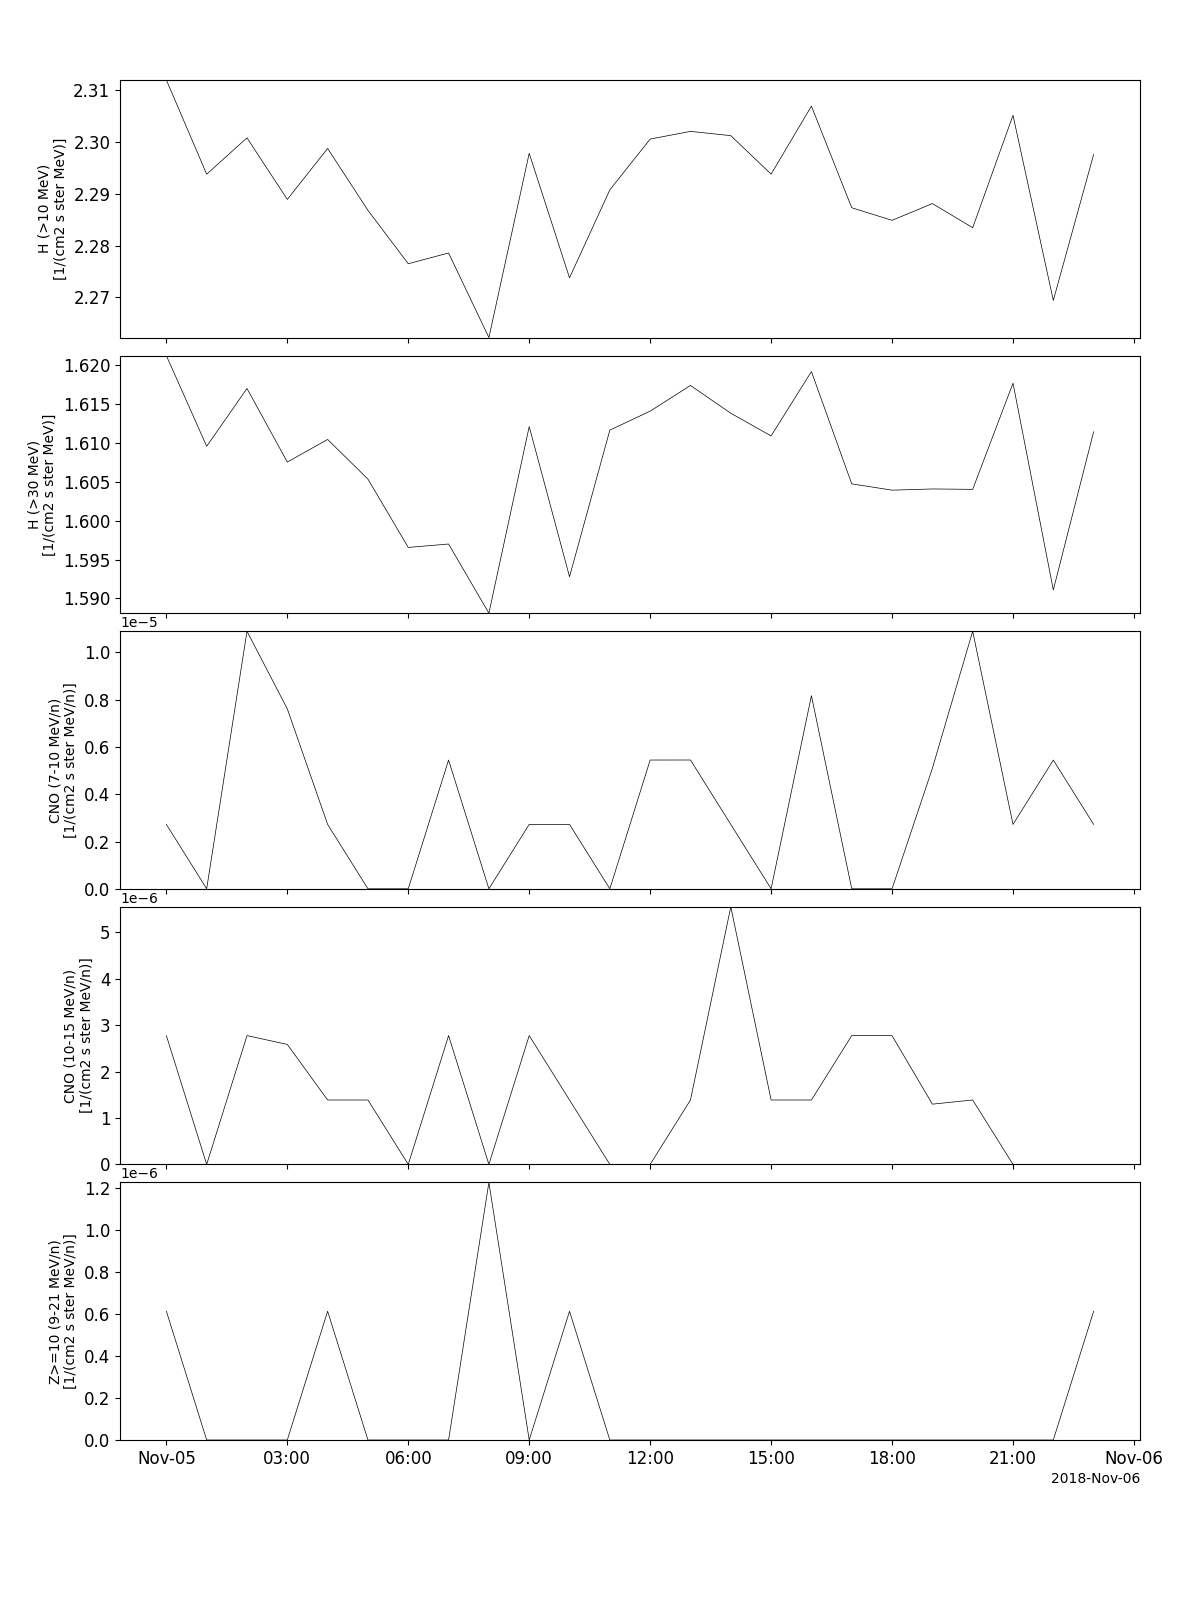
>>> import pyspedas
>>> from pyspedas import tplot
>>> sis_vars = pyspedas.projects.ace.sis(trange=['2018-11-5', '2018-11-6'])
>>> tplot(['H_lo', 'H_hi', 'CNO_lo', 'CNO_hi', 'Z_ge_10'])
Example
import pyspedas
from pyspedas import tplot
sis_vars = pyspedas.projects.ace.sis(trange=['2018-11-5', '2018-11-6'])
tplot(['H_lo', 'H_hi', 'CNO_lo', 'CNO_hi', 'Z_ge_10'])
Ultra Low Energy Isotope Spectrometer (ULEIS)
- pyspedas.projects.ace.uleis(trange=['2018-11-5', '2018-11-6'], datatype='h2', prefix='', suffix='', get_support_data=False, varformat=None, varnames=[], downloadonly=False, notplot=False, no_update=False, time_clip=False, force_download=False)[source]
Load data from the ACE Ultra Low Energy Isotope Spectrometer (ULEIS)
- Parameters:
trange (
listofstr) – time range of interest [starttime, endtime] with the format ‘YYYY-MM-DD’,’YYYY-MM-DD’] or to specify more or less than a day [‘YYYY-MM-DD/hh:mm:ss’,’YYYY-MM-DD/hh:mm:ss’] Default: [‘2018-11-5’, ‘2018-11-6’]datatype (
str) –Data type; Valid options:
h2: 1-Hour Level 2 Data
Default; ‘h2’
prefix (
str) – The tplot variable names will be given this prefix. By default, no prefix is added. Default: ‘’suffix (
str) – The tplot variable names will be given this suffix. By default, no suffix is added. Default: ‘’get_support_data (
bool) – Data with an attribute “VAR_TYPE” with a value of “support_data” will be loaded into tplot. By default, only loads in data with a “VAR_TYPE” attribute of “data”. Default: Falsevarformat (
str) – The file variable formats to load into tplot. Wildcard character “*” is accepted. By default, all variables are loaded in. Default: Nonevarnames (
listofstr) – List of variable names to load (if not specified, all data variables are loaded) Default: []downloadonly (
bool) – Set this flag to download the CDF files, but not load them into tplot variables Default: Falsenotplot (
bool) – Return the data in hash tables instead of creating tplot variables Default: Falseno_update (
bool) – If set, only load data from your local cache Default: Falsetime_clip (
bool) – Time clip the variables to exactly the range specified in the trange keyword Default; Falseforce_download (
bool) – Download file even if local version is more recent than server version Default: False
- Returns:
A list of the tplot variables created.
- Return type:
Examples
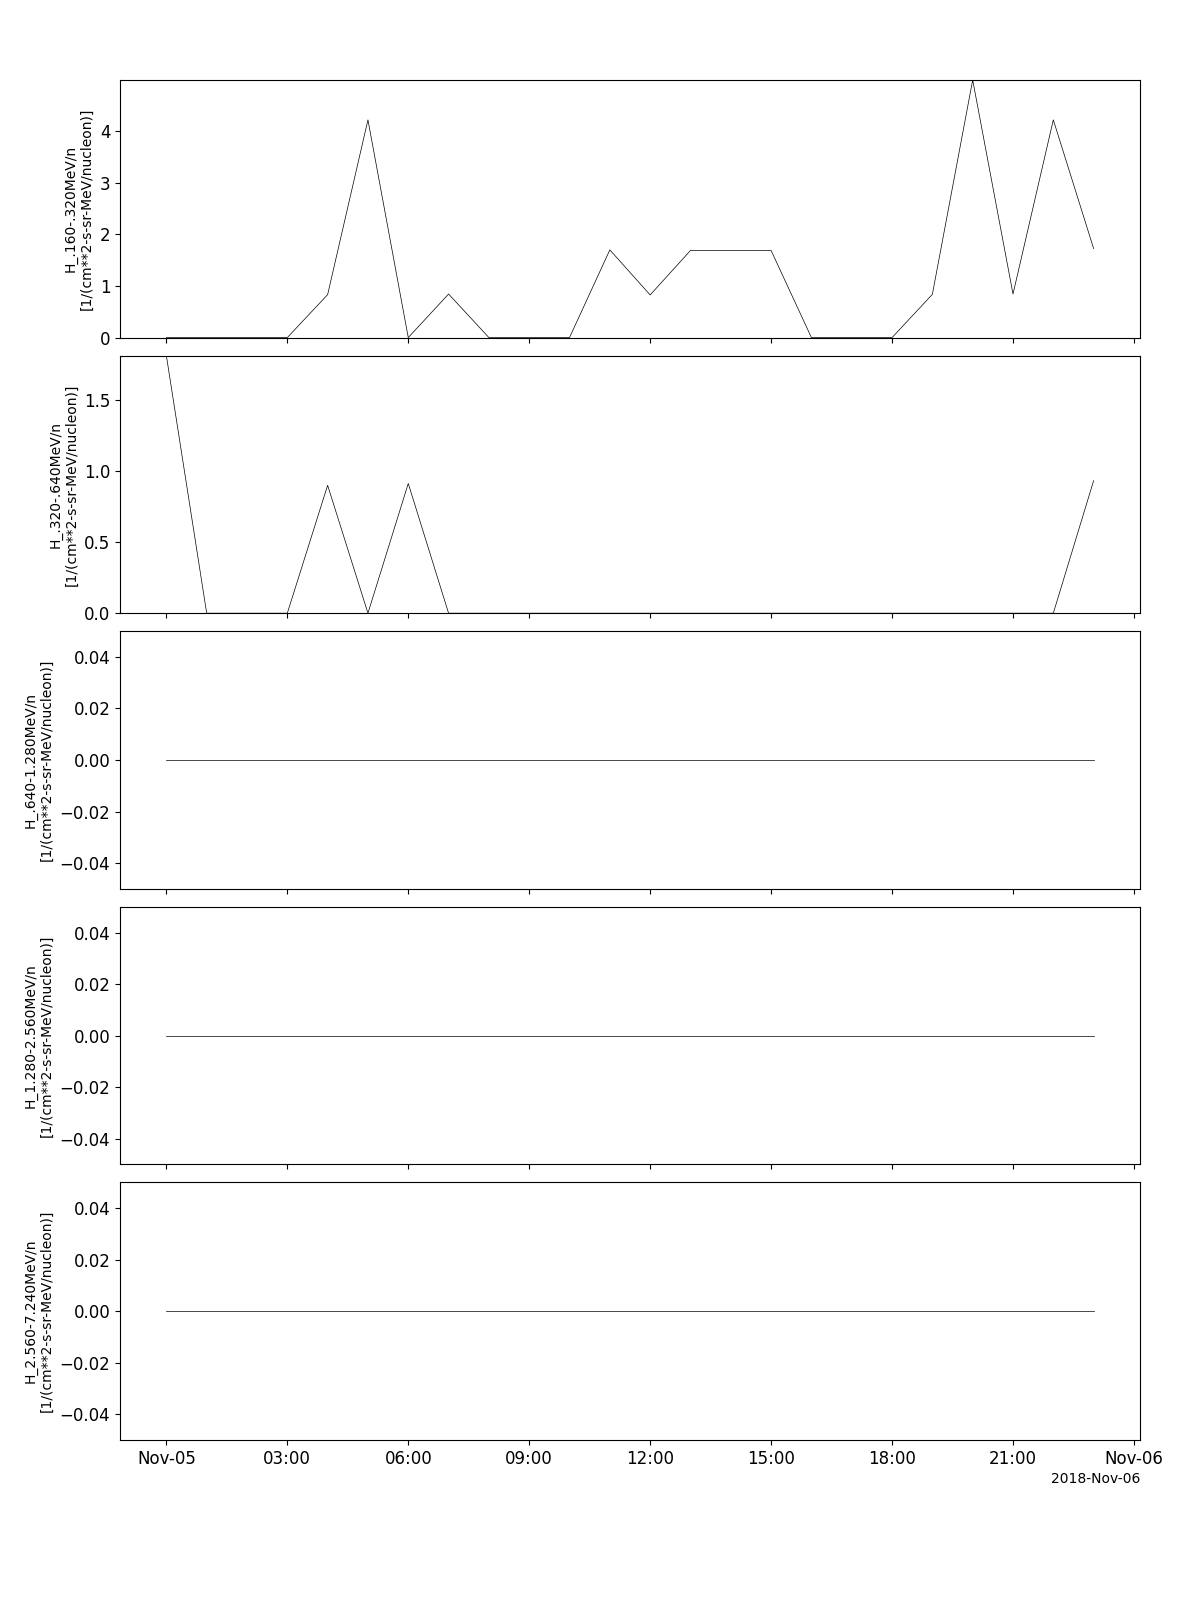
>>> import pyspedas
>>> from pyspedas import tplot
>>> uleis_vars = pyspedas.projects.ace.uleis(trange=['2018-11-5', '2018-11-6'])
>>> tplot(['H_S1', 'H_S2', 'H_S3', 'H_S4', 'H_S5'])
Example
import pyspedas
from pyspedas import tplot
uleis_vars = pyspedas.projects.ace.uleis(trange=['2018-11-5', '2018-11-6'])
tplot(['H_S1', 'H_S2', 'H_S3', 'H_S4', 'H_S5'])
Solar Energetic Particle Ionic Charge Analyzer (SEPICA)
- pyspedas.projects.ace.sepica(trange=['2004-11-5', '2004-11-6'], datatype='h2', prefix='', suffix='', get_support_data=False, varformat=None, varnames=[], downloadonly=False, notplot=False, no_update=False, time_clip=False, force_download=False)[source]
Load data from the ACE Solar Energetic Particle Ionic Charge Analyzer (SEPICA)
- Parameters:
trange (
listofstr) – time range of interest [starttime, endtime] with the format ‘YYYY-MM-DD’,’YYYY-MM-DD’] or to specify more or less than a day [‘YYYY-MM-DD/hh:mm:ss’,’YYYY-MM-DD/hh:mm:ss’] Default: [‘2004-11-5’, ‘2004-11-6’]datatype (
str) –Data type; Valid options:
h2: 1-Hour Level 2 Data
Defalut: ‘h2’
prefix (
str) – The tplot variable names will be given this prefix. By default, no prefix is added. Default: ‘’suffix (
str) – The tplot variable names will be given this suffix. By default, no suffix is added. Default: ‘’get_support_data (
bool) – Data with an attribute “VAR_TYPE” with a value of “support_data” will be loaded into tplot. By default, only loads in data with a “VAR_TYPE” attribute of “data”. Default: Falsevarformat (
str) – The file variable formats to load into tplot. Wildcard character “*” is accepted. By default, all variables are loaded in. Default: Nonevarnames (
listofstr) – List of variable names to load (if not specified, all data variables are loaded) Default: []downloadonly (
bool) – Set this flag to download the CDF files, but not load them into tplot variables Default: Falsenotplot (
bool) – Return the data in hash tables instead of creating tplot variables Default: Falseno_update (
bool) – If set, only load data from your local cache Default: Falsetime_clip (
bool) – Time clip the variables to exactly the range specified in the trange keyword Default: Falseforce_download (
bool) – Download file even if local version is more recent than server version Default: False
- Returns:
A list of the tplot variables created.
- Return type:
Example:
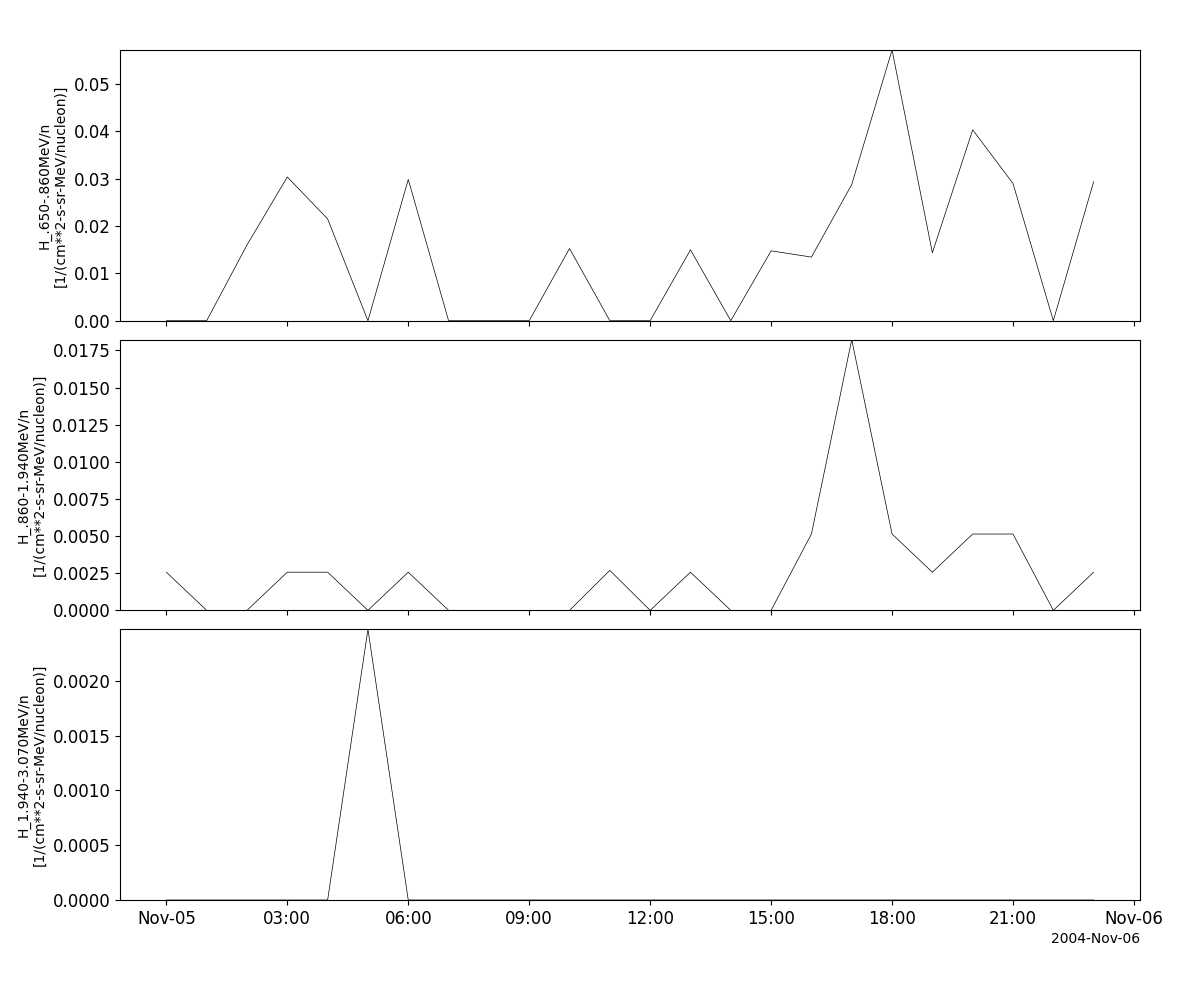
>>> import pyspedas
>>> from pyspedas import tplot
>>> sepica_vars = pyspedas.projects.ace.sepica(trange=['2004-11-5', '2004-11-6'])
>>> tplot(['H1', 'H2', 'H3'])
Example
import pyspedas
from pyspedas import tplot
sepica_vars = pyspedas.projects.ace.sepica(trange=['2004-11-5', '2004-11-6'])
tplot(['H1', 'H2', 'H3'])
Solar Wind Ion Composition Spectrometer (SWICS)
- pyspedas.projects.ace.swics(trange=['2018-11-5', '2018-11-6'], datatype='sw2_h3', prefix='', suffix='', get_support_data=False, varformat=None, varnames=[], downloadonly=False, notplot=False, no_update=False, time_clip=False, force_download=False)[source]
This function loads data from the Solar Wind Ion Composition Spectrometer (SWICS)
- Parameters:
trange (
listofstr) – time range of interest [starttime, endtime] with the format ‘YYYY-MM-DD’,’YYYY-MM-DD’] or to specify more or less than a day [‘YYYY-MM-DD/hh:mm:ss’,’YYYY-MM-DD/hh:mm:ss’] Default: [‘2018-11-5’, ‘2018-11-6’]datatype (
str) –Data type; Valid options:
sw2_h3: (default) SWICS 2.0 Solar Wind 2-Hour Level 2 Data
swi_h2: SWICS 1.1 Solar Wind 1-Hour Level 2 Data
swi_h3: SWICS 1.1 Solar Wind 2-Hour Level 2 Data
swi_h4: SWICS 1.1 Solar Wind 1-Day Level 2 Data
swi_h5: SWICS 1.1 Solar Wind 2-Hour Level 2 Q-state distributions
swi_h6: Solar Wind Protons 12-min Level 2 Data
Default: ‘sw2_h3’
prefix (
str) – The tplot variable names will be given this prefix. By default, no prefix is added. Default: ‘’suffix (
str) – The tplot variable names will be given this suffix. By default, no suffix is added. Default: ‘’get_support_data (
bool) – Data with an attribute “VAR_TYPE” with a value of “support_data” will be loaded into tplot. By default, only loads in data with a “VAR_TYPE” attribute of “data”. Default: Falsevarformat (
str) – The file variable formats to load into tplot. Wildcard character “*” is accepted. By default, all variables are loaded in. Default: Nonevarnames (
listofstr) – List of variable names to load (if not specified, all data variables are loaded) Default: []downloadonly (
bool) – Set this flag to download the CDF files, but not load them into tplot variables Default: Falsenotplot (
bool) – Return the data in hash tables instead of creating tplot variables Default: Falseno_update (
bool) – If set, only load data from your local cache Default: Falsetime_clip (
bool) – Time clip the variables to exactly the range specified in the trange keyword Default: Falseforce_download (
bool) – Download file even if local version is more recent than server version Default: False
- Returns:
A list of the tplot variables created.
- Return type:
Example:
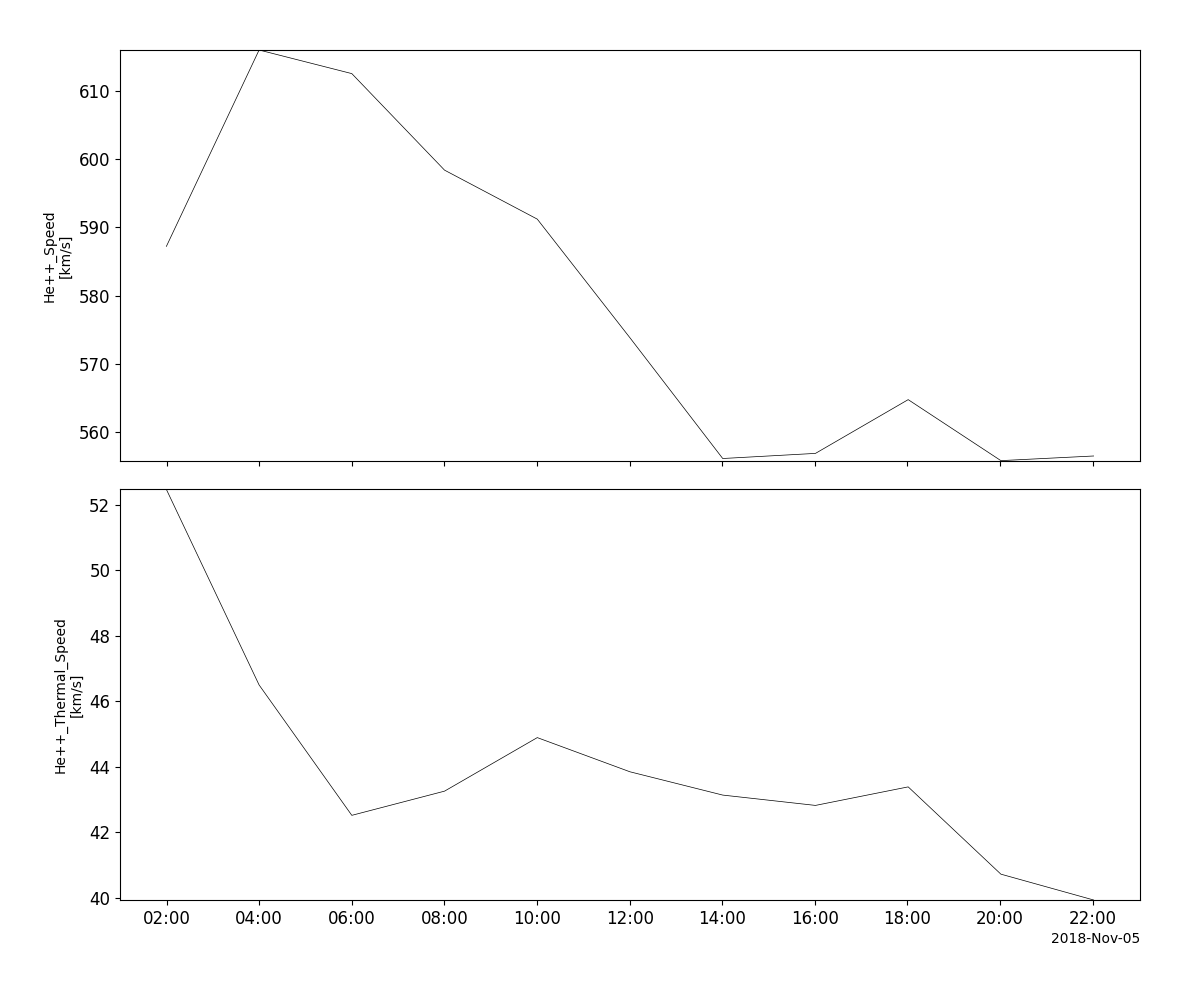
>>> import pyspedas
>>> from pyspedas import tplot
>>> swi_vars = pyspedas.projects.ace.swics(trange=['2018-11-5', '2018-11-6'])
>>> tplot(['vHe2', 'vthHe2'])
Example
import pyspedas
from pyspedas import tplot
swi_vars = pyspedas.projects.ace.swics(trange=['2018-11-5', '2018-11-6'])
tplot(['vHe2', 'vthHe2'])