Arase (ERG) Analysis Tools
Coordinate transformations
The ERG mission defines coordinate systems SGA, SGI, and DSI. The J2000 system serves as a bridge between the ERG systems and the geophysical systems handled by pyspedas.cotrans().
The top-level routine for converting between SGA, SGI, DSI, and J2000 is erg_cotrans.
- pyspedas.projects.erg.erg_cotrans(in_name='', out_name='', in_coord='', out_coord='', noload=False)[source]
- Parameters:
in_name – str name of input tplot variable to be transformed
out_name – str Name of output tplot variable in which the transformed data are stored. If not explicitly provided, out_name is automatically generated from “in_name” by replacing the coordinate name with a new one. For example, if you runs erg_cotrans(in_name=’xxxx_sgi’, out_coord=’sga’) then the result is stored in a newly created tplot variable ‘xxxx_sga’.
in_coord – str ‘sga’, ‘sgi’, ‘dsi’, or ‘j2000’ Set to explicitly give the coordinate system name for the input variable. If not given, this routine tries to guess it from the name of the input tplot variable (in_name).
out_coord – str ‘sga’, ‘sgi’, ‘dsi’, or ‘j2000’ Set to explicitly give the coordinate system name for the output variable. If not given, the coordinate system name is obtained from the variable name as done for in_coord.
- Returns:
None
- pyspedas.projects.erg.dsi2j2000(name_in=None, name_out=None, no_orb=False, J20002DSI=False, noload=False)[source]
This function transform a time series data between the DSI and J2000 coordinate systems
- Parameters:
name_in – str input tplot variable to be transformed
name_out – str Name of the tplot variable in which the transformed data is stored
J20002DSI – bool Set to transform data from J2000 to DSI. If not set, it transforms data from DSI to J2000.
- Returns:
None
- pyspedas.projects.erg.sga2sgi(name_in=None, name_out=None, SGI2SGA=False, noload=False)[source]
This transform a time series data between the SGA and SGI coordinate systems.
- Parameters:
name_in – str input tplot variable to be transformed
name_out – str Name of the tplot variable in which the transformed data is stored
SGI2SGA – bool Set to transform data from SGI to SGA. If not set, it transforms data from SGA to SGI.
- Returns:
None
- pyspedas.projects.erg.sgi2dsi(name_in=None, name_out=None, DSI2SGI=False, noload=False)[source]
This transform a time series data between the SGI and DSI coordinate systems.
- Parameters:
name_in – str input tplot variable to be transformed
name_out – str Name of the tplot variable in which the transformed data is stored
DSI2SGI – bool Set to transform data from DSI to SGI (despun coord –> spinning coord). If not set, it transforms data from SGI to DSI (spinning coord –> despun coord).
- Returns:
None
Particle Tools
- pyspedas.projects.erg.erg_hep_part_products(in_tvarname, species=None, outputs=['energy'], no_ang_weighting=True, suffix='', units='flux', datagap=8.1, regrid=[16, 16], pitch=[0.0, 180.0], theta=[-90.0, 90.0], phi_in=[0.0, 360.0], gyro=[0.0, 360.0], energy=None, fac_type='phigeo', trange=None, mag_name=None, pos_name=None, relativistic=False, no_regrid=True, include_allazms=False, muconv=False)[source]
- pyspedas.projects.erg.erg_lep_part_products(in_tvarname, species=None, outputs=['energy'], no_ang_weighting=True, suffix='', units='flux', datagap=32.1, regrid=[16, 16], pitch=[0.0, 180.0], theta=[-90.0, 90.0], phi_in=[0.0, 360.0], gyro=[0.0, 360.0], energy=None, fac_type='mphism', trange=None, mag_name=None, pos_name=None, relativistic=False, no_regrid=False)[source]
- pyspedas.projects.erg.erg_mep_part_products(in_tvarname, species=None, outputs=['energy'], no_ang_weighting=True, suffix='', units='flux', datagap=16.1, regrid=[32, 16], pitch=[0.0, 180.0], theta=[-90.0, 90.0], phi_in=[0.0, 360.0], gyro=[0.0, 360.0], energy=None, fac_type='mphism', trange=None, mag_name=None, pos_name=None, relativistic=False, no_regrid=False)[source]
- Parameters:
in_tvarname (
str) – The name of a tplot variable containing ERG/MEP 3dflux dataspecies (
str)-
The output quantities to generate. Valid options are:
energy
theta
phi
gyro
pa
moments
fac_energy
fac_moments
no_ang_weighting (
bool)suffix (
str) – A suffix to be appended to the output tplot variable namesunits (
str)datagap (
float) – A time in seconds; data gaps longer than this time will be marked with NaNspitch (
listoffloat) – Lower and upper pitch angle limits to usetheta (
listoffloat) – Lower and upper theta angle limits to usephi_in (
listoffloat) – Lower and upper phi angle limits to usegyro (
listoffloat) – Lower and upper gyro angle limits to useenergy (
listoffloat) – Lower and upper energu limits to use when cleaning the datafac_type (
str) – Type of field-aligned coordinate frame to use. Default: ‘mphism’trange (
listofstr) – A list containing the start and end times to use for generating the productsmag_name (
str) – tplot name of the magnetic field variablepos_name (
str) – tplot name of the orbit position variablerelativistic (
bool)no_regrid (
bool)
- Returns:
A list of tplot variables created
- Return type:
Example
import pyspedas
from pyspedas.projects.erg import erg_mep_part_products
from pyspedas import timespan, tplot
timespan('2017-04-05 21:45:00', 2.25, keyword='hours')
pyspedas.projects.erg.mepe( trange=[ '2017-04-05 21:45:00', '2017-04-05 23:59:59'], datatype='3dflux' )
vars = pyspedas.projects.erg.mgf(trange=['2017-04-05 21:45:00', '2017-04-05 23:59:59']) # Load necessary B-field data
vars = pyspedas.projects.erg.orb(trange=['2017-04-05 21:45:00', '2017-04-05 23:59:59']) # Load necessary orbit data
mag_vn = 'erg_mgf_l2_mag_8sec_dsi'
pos_vn = 'erg_orb_l2_pos_gse'
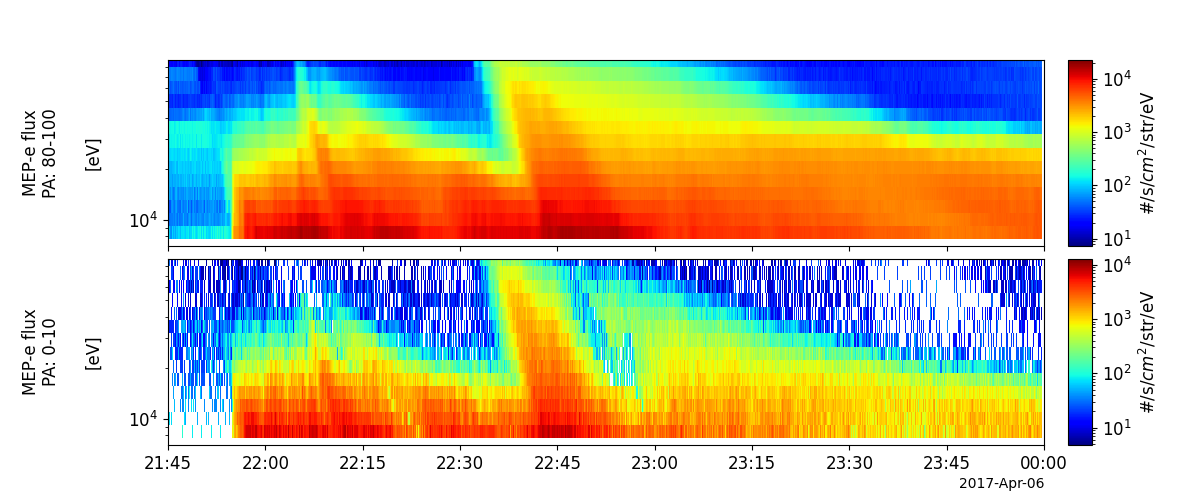
# Calculate energy-time spectra of electron flux for limited pitch-angle (PA) ranges
## Here we calculate energy-time spectra for PA = 0-10 deg and PA = 80-100 deg.
vars = erg_mep_part_products('erg_mepe_l2_3dflux_FEDU', outputs='fac_energy', pitch=[80., 100.],
fac_type='xdsi', mag_name=mag_vn, pos_name=pos_vn,
trange=['2017-04-05 21:45:00', '2017-04-05 23:59:59'], suffix='_pa80-100')
vars = erg_mep_part_products('erg_mepe_l2_3dflux_FEDU', outputs='fac_energy', pitch=[0., 10.], fac_type='xdsi',
mag_name=mag_vn, pos_name=pos_vn,
trange=['2017-04-05 21:45:00', '2017-04-05 23:59:59'], suffix='_pa0-10')
## Decorate the obtained spectrum variables
pyspedas.options('erg_mepe_l2_3dflux_FEDU_energy_mag_pa80-100', 'ytitle', 'MEP-e flux\nPA: 80-100\n\n[eV]')
pyspedas.options('erg_mepe_l2_3dflux_FEDU_energy_mag_pa0-10', 'ytitle', 'MEP-e flux\nPA: 0-10\n\n[eV]')
tplot(['erg_mepe_l2_3dflux_FEDU_energy_mag_pa80-100', 'erg_mepe_l2_3dflux_FEDU_energy_mag_pa0-10'], save_png='erg_mep_en_pa_limit.png')
- pyspedas.projects.erg.erg_xep_part_products(in_tvarname, species=None, outputs=['energy'], no_ang_weighting=True, suffix='', units='flux', datagap=15.0, regrid=[16, 12], pitch=[0.0, 180.0], theta=[-90.0, 90.0], phi_in=[0.0, 360.0], gyro=[0.0, 360.0], energy=None, fac_type='mphism', trange=None, mag_name=None, pos_name=None, relativistic=False, no_regrid=False)[source]